
|
|||||
|
 | |
| |
| |
| |
| |
| |
|
Gene: PXK |
Gene summary for PXK |
| Gene information | Species | Human | Gene symbol | PXK | Gene ID | 54899 |
| Gene name | PX domain containing serine/threonine kinase like | |
| Gene Alias | MONAKA | |
| Cytomap | 3p14.3 | |
| Gene Type | protein-coding | GO ID | GO:0006810 | UniProtAcc | A0A0C4DG95 |
Top |
Malignant transformation analysis |
| Identification of the aberrant gene expression in precancerous and cancerous lesions by comparing the gene expression of stem-like cells in diseased tissues with normal stem cells |
| Entrez ID | Symbol | Replicates | Species | Organ | Tissue | Adj P-value | Log2FC | Malignancy |
| 54899 | PXK | HCC1_Meng | Human | Liver | HCC | 2.34e-11 | -1.36e-03 | 0.0246 |
| 54899 | PXK | S014 | Human | Liver | HCC | 1.79e-25 | 9.89e-01 | 0.2254 |
| 54899 | PXK | S015 | Human | Liver | HCC | 9.10e-25 | 1.38e+00 | 0.2375 |
| 54899 | PXK | S016 | Human | Liver | HCC | 3.05e-38 | 1.16e+00 | 0.2243 |
| 54899 | PXK | S027 | Human | Liver | HCC | 7.13e-08 | 5.68e-01 | 0.2446 |
| 54899 | PXK | S028 | Human | Liver | HCC | 6.26e-16 | 6.05e-01 | 0.2503 |
| 54899 | PXK | S029 | Human | Liver | HCC | 2.04e-14 | 7.67e-01 | 0.2581 |
| 54899 | PXK | male-WTA | Human | Thyroid | PTC | 7.43e-26 | 9.91e-02 | 0.1037 |
| 54899 | PXK | PTC01 | Human | Thyroid | PTC | 8.46e-14 | -2.07e-02 | 0.1899 |
| 54899 | PXK | PTC04 | Human | Thyroid | PTC | 2.21e-11 | 3.36e-02 | 0.1927 |
| 54899 | PXK | PTC05 | Human | Thyroid | PTC | 2.46e-18 | 7.38e-01 | 0.2065 |
| 54899 | PXK | PTC06 | Human | Thyroid | PTC | 1.09e-22 | 3.75e-01 | 0.2057 |
| 54899 | PXK | PTC07 | Human | Thyroid | PTC | 3.24e-18 | 3.11e-01 | 0.2044 |
| 54899 | PXK | ATC12 | Human | Thyroid | ATC | 2.36e-10 | -1.12e-01 | 0.34 |
| 54899 | PXK | ATC13 | Human | Thyroid | ATC | 7.09e-17 | 1.97e-01 | 0.34 |
| 54899 | PXK | ATC2 | Human | Thyroid | ATC | 3.84e-02 | 5.93e-01 | 0.34 |
| 54899 | PXK | ATC3 | Human | Thyroid | ATC | 2.07e-02 | -7.30e-02 | 0.338 |
| 54899 | PXK | ATC4 | Human | Thyroid | ATC | 1.10e-08 | -7.85e-02 | 0.34 |
| 54899 | PXK | ATC5 | Human | Thyroid | ATC | 1.59e-19 | 2.48e-01 | 0.34 |
| Page: 1 |
| Tissue | Expression Dynamics | Abbreviation |
| Liver | 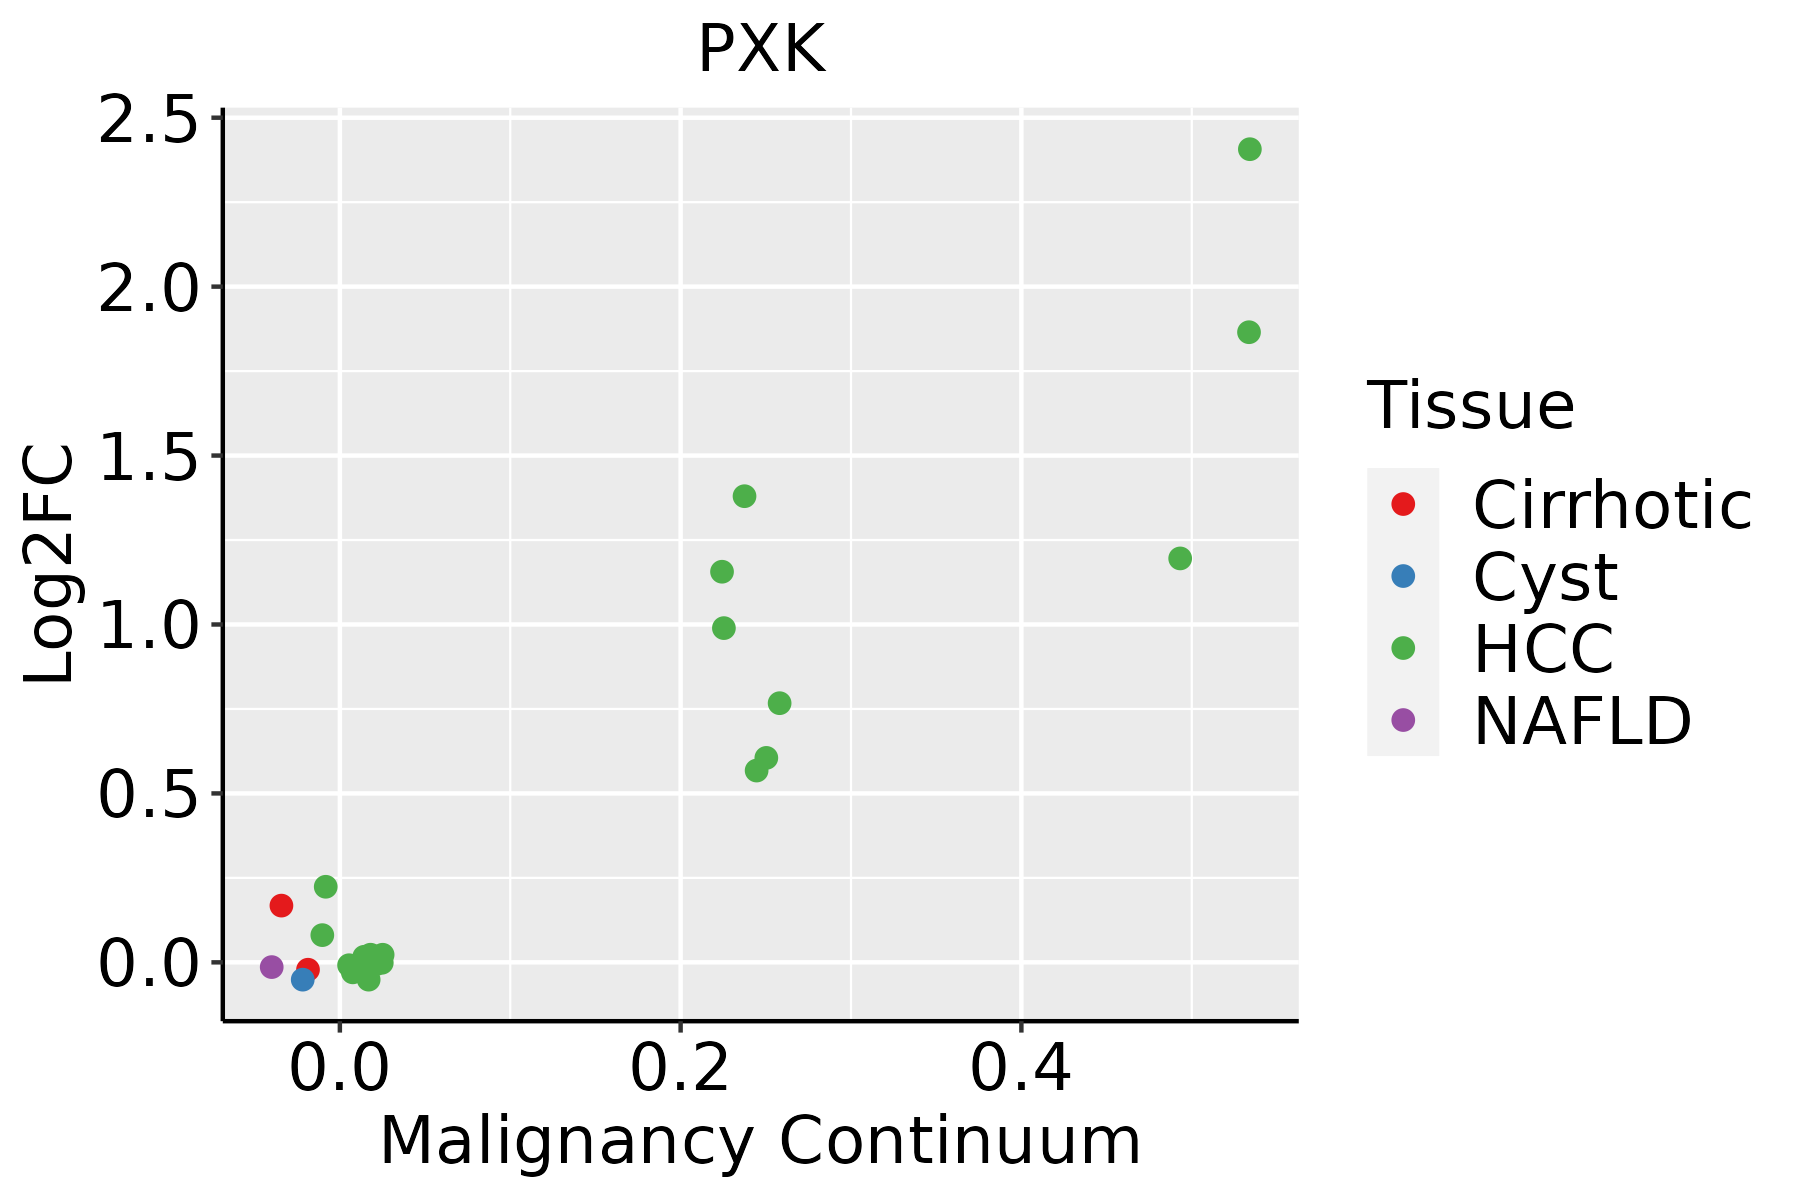 | HCC: Hepatocellular carcinoma |
| NAFLD: Non-alcoholic fatty liver disease | ||
| Thyroid | 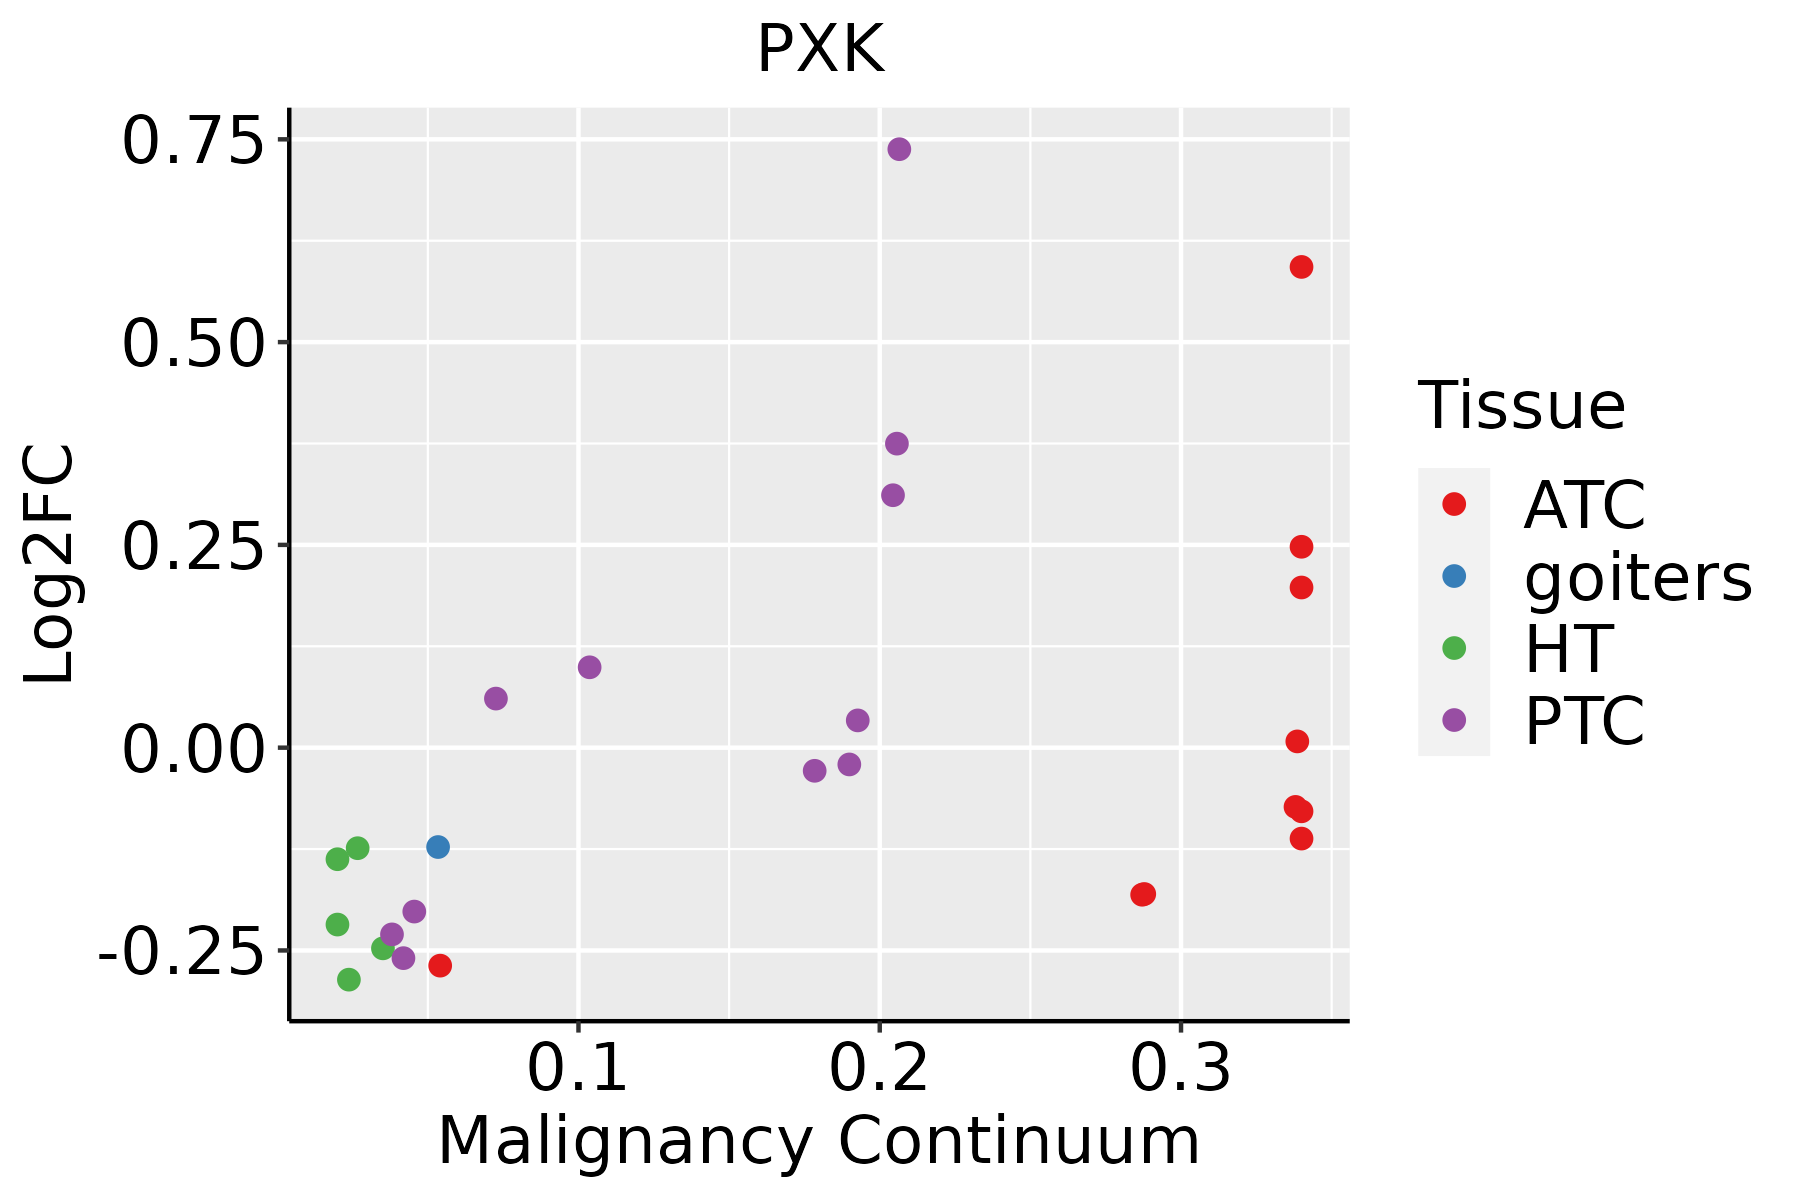 | ATC: Anaplastic thyroid cancer |
| HT: Hashimoto's thyroiditis | ||
| PTC: Papillary thyroid cancer |
| ∗log2FC in expression of this searched gene in stem-like cells from each diseased tissue sample relative to stem-like cells in normal samples in each tissue plotted against the malignancy continuum. Samples are colored based on if they are from different disease stage. |
Top |
Malignant transformation related pathway analysis |
| Find out the enriched GO biological processes and KEGG pathways involved in transition from healthy to precancer to cancer |
| Tissue | Disease Stage | Enriched GO biological Processes |
| Colorectum | AD |  |
| Colorectum | SER |  |
| Colorectum | MSS |  |
| Colorectum | MSI-H |  |
| Colorectum | FAP |  |
| ∗Top 15 enriched GO BP terms are showed in the bar plot of each disease state in each tissue. Each row represents a significant GO biological process which is colored according to the -log10(p.adjust). |
| Page: 1 2 3 4 5 6 7 8 9 |
| GO ID | Tissue | Disease Stage | Description | Gene Ratio | Bg Ratio | pvalue | p.adjust | Count |
| GO:005134622 | Liver | HCC | negative regulation of hydrolase activity | 195/7958 | 379/18723 | 2.44e-04 | 1.82e-03 | 195 |
| GO:004346211 | Liver | HCC | regulation of ATPase activity | 29/7958 | 46/18723 | 3.95e-03 | 1.74e-02 | 29 |
| GO:0051346112 | Thyroid | PTC | negative regulation of hydrolase activity | 146/5968 | 379/18723 | 3.33e-03 | 1.62e-02 | 146 |
| GO:00510518 | Thyroid | PTC | negative regulation of transport | 176/5968 | 470/18723 | 5.44e-03 | 2.49e-02 | 176 |
| GO:00434629 | Thyroid | PTC | regulation of ATPase activity | 23/5968 | 46/18723 | 7.89e-03 | 3.33e-02 | 23 |
| GO:005134629 | Thyroid | ATC | negative regulation of hydrolase activity | 155/6293 | 379/18723 | 1.64e-03 | 8.23e-03 | 155 |
| GO:005105114 | Thyroid | ATC | negative regulation of transport | 183/6293 | 470/18723 | 8.12e-03 | 3.13e-02 | 183 |
| Page: 1 |
| Pathway ID | Tissue | Disease Stage | Description | Gene Ratio | Bg Ratio | pvalue | p.adjust | qvalue | Count |
| Page: 1 |
Top |
Cell-cell communication analysis |
| Identification of potential cell-cell interactions between two cell types and their ligand-receptor pairs for different disease states |
| Ligand | Receptor | LRpair | Pathway | Tissue | Disease Stage |
| Page: 1 |
Top |
Single-cell gene regulatory network inference analysis |
| Find out the significant the regulons (TFs) and the target genes of each regulon across cell types for different disease states |
| TF | Cell Type | Tissue | Disease Stage | Target Gene | RSS | Regulon Activity |
| ∗The dot plots of a searched regulon are shown for all cell subpopulations in each disease state of each tissue based on the regulon specific score inferred using pySCENIC and by calculating the average expression. |
| Page: 1 |
Top |
Somatic mutation of malignant transformation related genes |
| Annotation of somatic variants for genes involved in malignant transformation |
| Hugo Symbol | Variant Class | Variant Classification | dbSNP RS | HGVSc | HGVSp | HGVSp Short | SWISSPROT | BIOTYPE | SIFT | PolyPhen | Tumor Sample Barcode | Tissue | Histology | Sex | Age | Stage | Therapy Types | Drugs | Outcome |
| PXK | SNV | Missense_Mutation | c.199C>A | p.Gln67Lys | p.Q67K | Q7Z7A4 | protein_coding | tolerated(0.87) | benign(0.005) | TCGA-A2-A0YK-01 | Breast | breast invasive carcinoma | Female | <65 | I/II | Chemotherapy | cytoxan | SD | |
| PXK | SNV | Missense_Mutation | c.1481G>A | p.Ser494Asn | p.S494N | Q7Z7A4 | protein_coding | deleterious(0.04) | probably_damaging(0.954) | TCGA-BH-A0DE-01 | Breast | breast invasive carcinoma | Female | <65 | I/II | Unknown | Unknown | SD | |
| PXK | SNV | Missense_Mutation | c.357N>C | p.Leu119Phe | p.L119F | Q7Z7A4 | protein_coding | deleterious(0) | benign(0.246) | TCGA-E9-A243-01 | Breast | breast invasive carcinoma | Female | <65 | I/II | Chemotherapy | 5-fluorouracil | PD | |
| PXK | SNV | Missense_Mutation | novel | c.1297G>A | p.Glu433Lys | p.E433K | Q7Z7A4 | protein_coding | deleterious(0) | probably_damaging(0.977) | TCGA-2W-A8YY-01 | Cervix | cervical & endocervical cancer | Female | <65 | I/II | Chemotherapy | cisplatin | CR |
| PXK | SNV | Missense_Mutation | c.1294N>C | p.Glu432Gln | p.E432Q | Q7Z7A4 | protein_coding | deleterious(0.01) | probably_damaging(0.985) | TCGA-DR-A0ZM-01 | Cervix | cervical & endocervical cancer | Female | <65 | III/IV | Unspecific | Cisplatin | SD | |
| PXK | deletion | Frame_Shift_Del | novel | c.799delA | p.Thr267HisfsTer7 | p.T267Hfs*7 | Q7Z7A4 | protein_coding | TCGA-2W-A8YY-01 | Cervix | cervical & endocervical cancer | Female | <65 | I/II | Chemotherapy | cisplatin | CR | ||
| PXK | SNV | Missense_Mutation | novel | c.492N>A | p.Phe164Leu | p.F164L | Q7Z7A4 | protein_coding | tolerated(0.05) | possibly_damaging(0.651) | TCGA-A6-6141-01 | Colorectum | colon adenocarcinoma | Male | <65 | I/II | Chemotherapy | 5-fu | SD |
| PXK | SNV | Missense_Mutation | rs763554030 | c.1108N>A | p.Val370Met | p.V370M | Q7Z7A4 | protein_coding | deleterious(0) | probably_damaging(0.943) | TCGA-AA-3710-01 | Colorectum | colon adenocarcinoma | Female | >=65 | I/II | Unknown | Unknown | SD |
| PXK | SNV | Missense_Mutation | novel | c.473N>A | p.Arg158Lys | p.R158K | Q7Z7A4 | protein_coding | deleterious(0.01) | probably_damaging(0.92) | TCGA-AD-6895-01 | Colorectum | colon adenocarcinoma | Male | >=65 | III/IV | Unknown | Unknown | SD |
| PXK | SNV | Missense_Mutation | rs779667790 | c.872N>T | p.Ala291Val | p.A291V | Q7Z7A4 | protein_coding | deleterious(0.02) | possibly_damaging(0.653) | TCGA-AD-6964-01 | Colorectum | colon adenocarcinoma | Male | <65 | III/IV | Chemotherapy | folfox | PD |
| Page: 1 2 3 4 5 6 7 |
Top |
Related drugs of malignant transformation related genes |
| Identification of chemicals and drugs interact with genes involved in malignant transfromation |
| (DGIdb 4.0) |
| Entrez ID | Symbol | Category | Interaction Types | Drug Claim Name | Drug Name | PMIDs |
| Page: 1 |

Copyright 2023-Present -The University of Texas Health Science Center at Houston |