Schematic overview of the cellular and molecular mechanisms involved in the cancer progression, including the proposed cellular and molecular mechanisms in cancer cells trajectory. AT1: alveolar type 1 cells; AT2: alveolar type 2 cells; AAH: atypical adenomatous hyperplasia; AIS: adenocarcinoma in situ; MIA: minimally invasive adenocarcinoma; IA: invasive adenocarcinoma; EMT: epithelial-mesenchymal transition

Home

Download

Statistics

Help

Contact

Center for Computational Systems Medicine
leaf

Gene summary

leaf

Malignant transformation analysis

leaf

Malignant transformation related pathway analysis

leaf

Cell-cell communication analysis

leaf

Single-cell gene regulatory network inference analysis

leaf

Somatic mutation of malignant transformation related genes

leaf

Related drugs of malignant transformation related genes

Gene: PXDN

Gene summary for PXDN

check button Gene summary.

Gene informationSpeciesHuman
Gene symbol

PXDN

Gene ID

7837

Gene nameperoxidasin
Gene AliasASGD7
Cytomap2p25.3
Gene Typeprotein-coding
GO ID

GO:0001959

UniProtAcc

Q92626


Top

Malignant transformation analysis

check button Identification of the aberrant gene expression in precancerous and cancerous lesions by comparing the gene expression of stem-like cells in diseased tissues with normal stem cells
check button Malignant transformation involving gene list.
Entrez IDSymbolReplicatesSpeciesOrganTissueAdj P-valueLog2FCMalignancy
7837PXDNLZE7THumanEsophagusESCC1.72e-125.68e-010.0667
7837PXDNLZE8THumanEsophagusESCC2.47e-028.15e-020.067
7837PXDNP2T-EHumanEsophagusESCC8.46e-396.84e-010.1177
7837PXDNP8T-EHumanEsophagusESCC1.06e-447.73e-010.0889
7837PXDNP10T-EHumanEsophagusESCC9.76e-427.12e-010.116
7837PXDNP11T-EHumanEsophagusESCC5.28e-126.75e-010.1426
7837PXDNP12T-EHumanEsophagusESCC5.08e-295.21e-010.1122
7837PXDNP15T-EHumanEsophagusESCC1.34e-184.20e-010.1149
7837PXDNP16T-EHumanEsophagusESCC2.25e-233.61e-010.1153
7837PXDNP19T-EHumanEsophagusESCC3.67e-116.46e-010.1662
7837PXDNP21T-EHumanEsophagusESCC7.97e-346.82e-010.1617
7837PXDNP22T-EHumanEsophagusESCC1.46e-303.17e-010.1236
7837PXDNP23T-EHumanEsophagusESCC1.56e-031.84e-010.108
7837PXDNP24T-EHumanEsophagusESCC2.24e-072.81e-010.1287
7837PXDNP26T-EHumanEsophagusESCC1.39e-051.61e-010.1276
7837PXDNP30T-EHumanEsophagusESCC6.14e-116.29e-010.137
7837PXDNP31T-EHumanEsophagusESCC3.24e-365.92e-010.1251
7837PXDNP32T-EHumanEsophagusESCC2.27e-205.06e-010.1666
7837PXDNP40T-EHumanEsophagusESCC1.39e-093.72e-010.109
7837PXDNP42T-EHumanEsophagusESCC6.10e-205.92e-010.1175
Page: 1 2 3 

check button Transcriptomic changes along malignancy continuum.
TissueExpression DynamicsAbbreviation
EsophagusThe image shows the transcriptomic changes along malignancy continuum.log2FC in expression of this searched gene in stem-like cells from each diseased tissue sample relative to stem-like cells in normal samples in each tissue plotted against the malignancy continuum. Samples are colored based on if they are from different disease stage.ESCC: Esophageal squamous cell carcinoma
HGIN: High-grade intraepithelial neoplasias
LGIN: Low-grade intraepithelial neoplasias
Oral CavityThe image shows the transcriptomic changes along malignancy continuum.log2FC in expression of this searched gene in stem-like cells from each diseased tissue sample relative to stem-like cells in normal samples in each tissue plotted against the malignancy continuum. Samples are colored based on if they are from different disease stage.
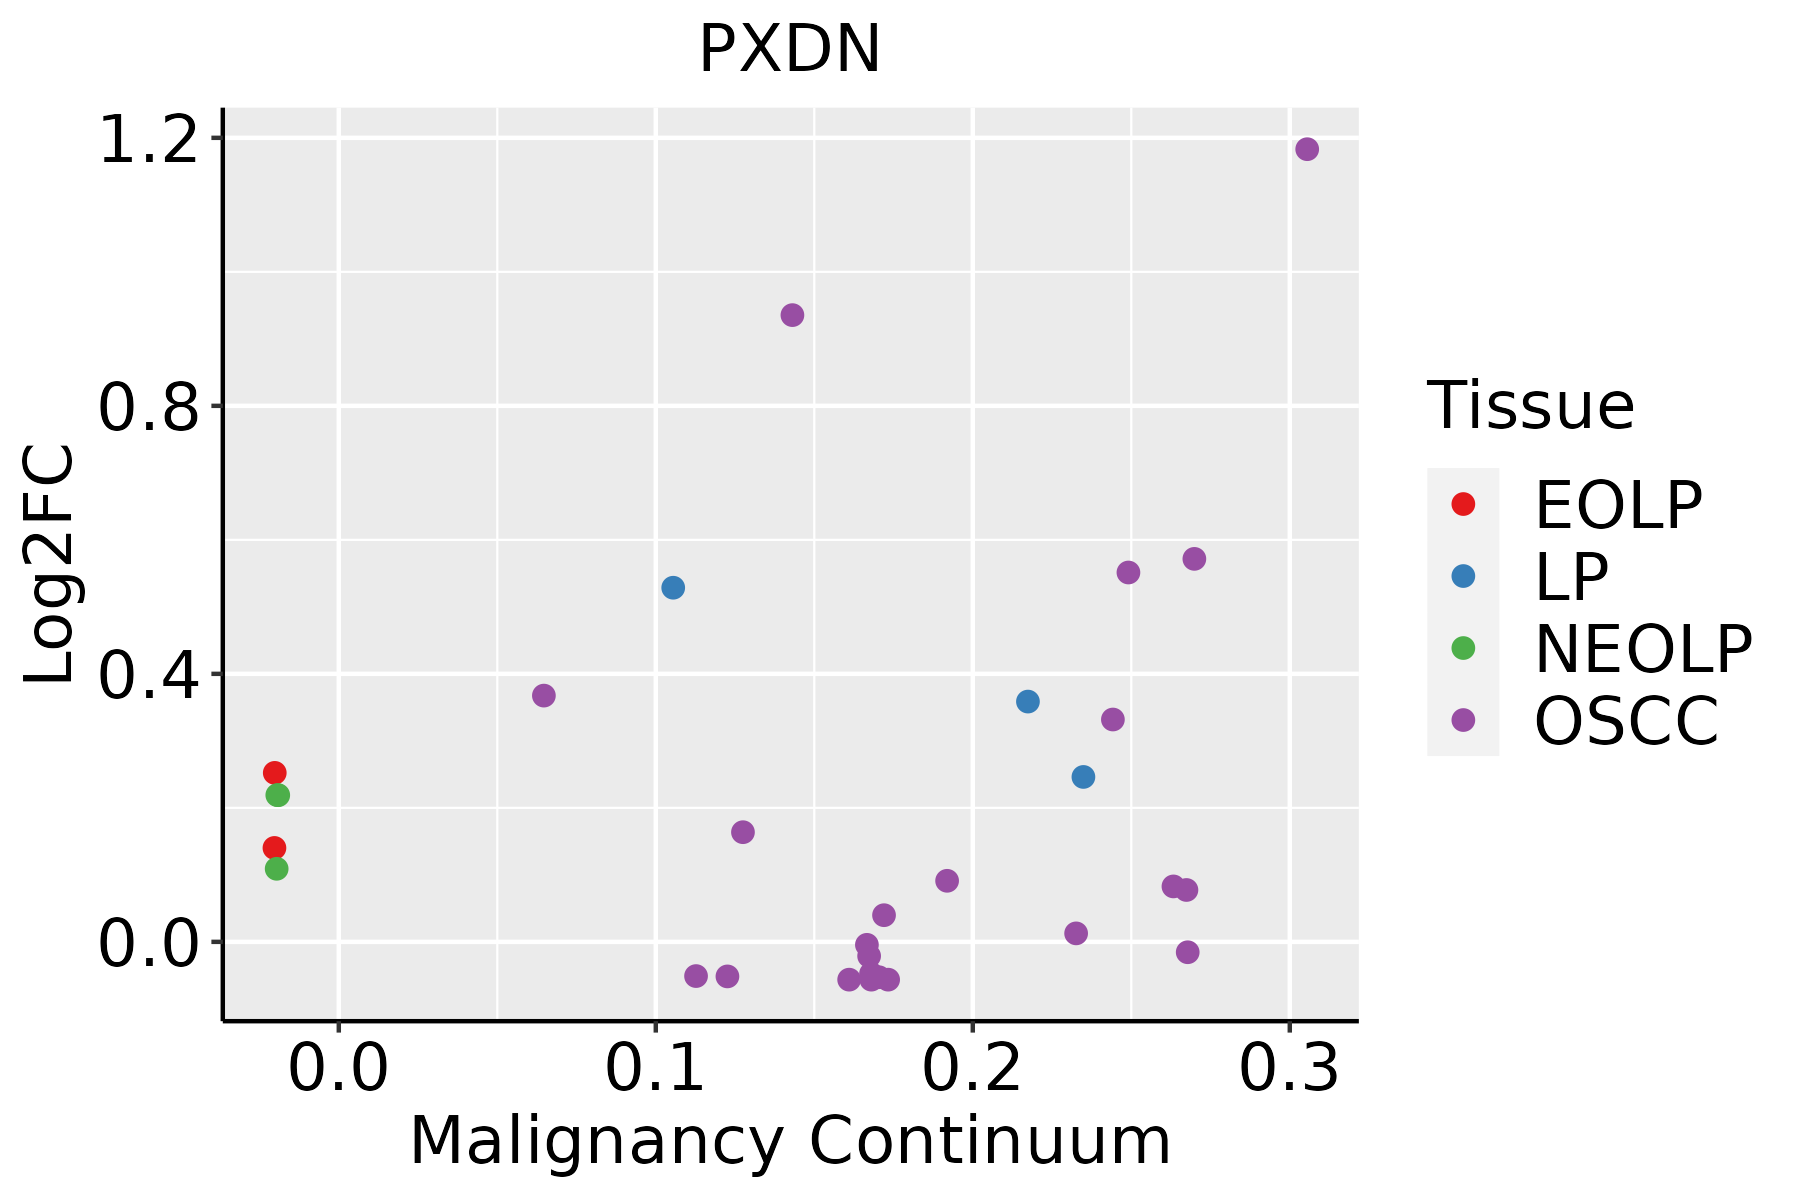
EOLP: Erosive Oral lichen planus
LP: leukoplakia
NEOLP: Non-erosive oral lichen planus
OSCC: Oral squamous cell carcinoma
ThyroidThe image shows the transcriptomic changes along malignancy continuum.log2FC in expression of this searched gene in stem-like cells from each diseased tissue sample relative to stem-like cells in normal samples in each tissue plotted against the malignancy continuum. Samples are colored based on if they are from different disease stage.
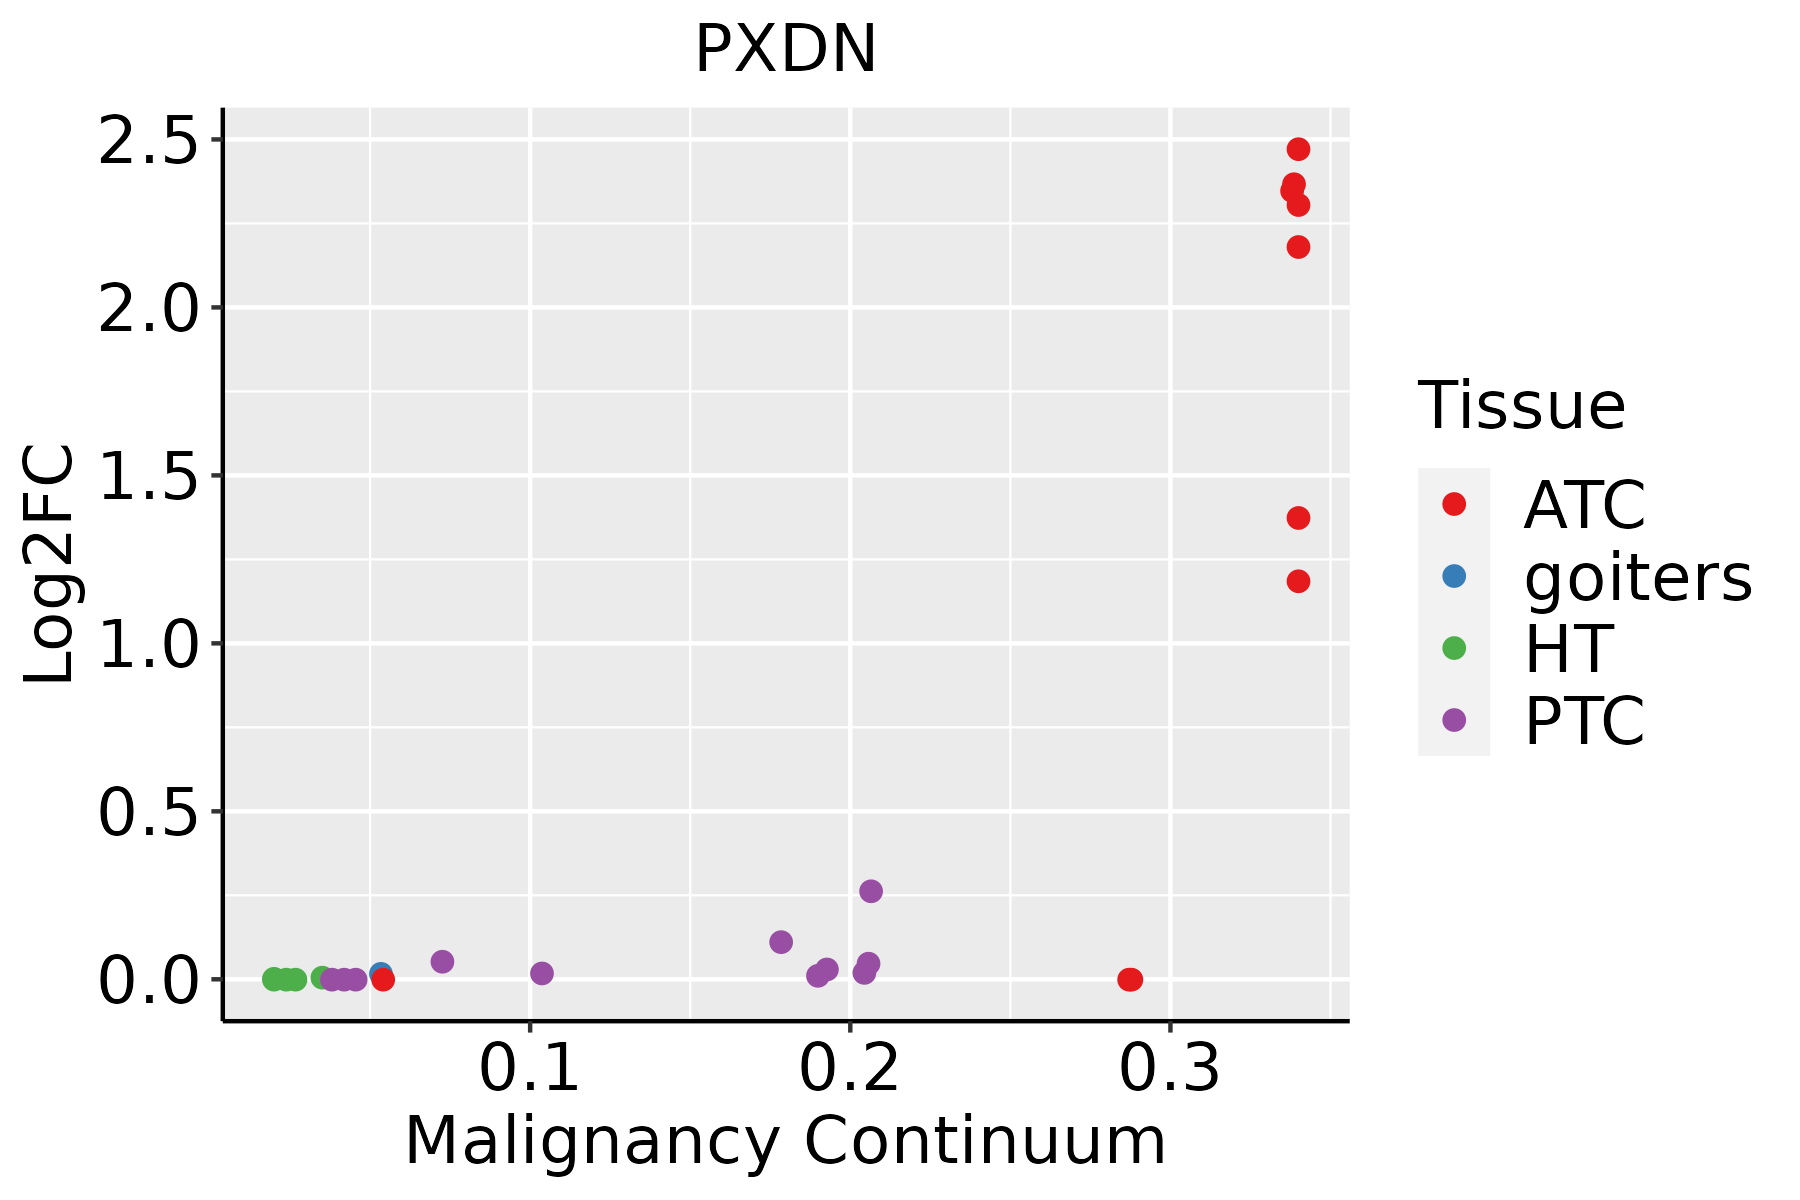
ATC: Anaplastic thyroid cancer
HT: Hashimoto's thyroiditis
PTC: Papillary thyroid cancer
∗log2FC in expression of this searched gene in stem-like cells from each diseased tissue sample relative to stem-like cells in normal samples in each tissue plotted against the malignancy continuum. Samples are colored based on if they are from different disease stage.

Top

Malignant transformation related pathway analysis

check buttonFind out the enriched GO biological processes and KEGG pathways involved in transition from healthy to precancer to cancer
check button Figure of enriched GO biological processes.
TissueDisease StageEnriched GO biological Processes
ColorectumADGO analysis - Figure of enriched GO biological processes: Top 15 enriched GO BP terms are showed in the bar plot of each disease state in each tissue. Each row represents a significant GO biological process which is colored according to the -log10(p.adjust).
ColorectumSERGO analysis - Figure of enriched GO biological processes: Top 15 enriched GO BP terms are showed in the bar plot of each disease state in each tissue. Each row represents a significant GO biological process which is colored according to the -log10(p.adjust).
ColorectumMSSGO analysis - Figure of enriched GO biological processes: Top 15 enriched GO BP terms are showed in the bar plot of each disease state in each tissue. Each row represents a significant GO biological process which is colored according to the -log10(p.adjust).
ColorectumMSI-HGO analysis - Figure of enriched GO biological processes: Top 15 enriched GO BP terms are showed in the bar plot of each disease state in each tissue. Each row represents a significant GO biological process which is colored according to the -log10(p.adjust).
ColorectumFAPGO analysis - Figure of enriched GO biological processes: Top 15 enriched GO BP terms are showed in the bar plot of each disease state in each tissue. Each row represents a significant GO biological process which is colored according to the -log10(p.adjust).
∗Top 15 enriched GO BP terms are showed in the bar plot of each disease state in each tissue. Each row represents a significant GO biological process which is colored according to the -log10(p.adjust).
Page: 1 2 3 4 5 6 7 8 9 

check button Enriched GO biological processes.
GO IDTissueDisease StageDescriptionGene RatioBg Ratiopvaluep.adjustCount
GO:0006979111EsophagusESCCresponse to oxidative stress303/8552446/187237.15e-221.30e-19303
GO:00607595EsophagusESCCregulation of response to cytokine stimulus103/8552162/187233.14e-063.53e-05103
GO:00019595EsophagusESCCregulation of cytokine-mediated signaling pathway95/8552150/187239.48e-069.04e-0595
GO:00301984EsophagusESCCextracellular matrix organization171/8552301/187236.08e-054.67e-04171
GO:00430624EsophagusESCCextracellular structure organization171/8552302/187237.73e-055.76e-04171
GO:00452294EsophagusESCCexternal encapsulating structure organization172/8552304/187237.80e-055.80e-04172
GO:000963620EsophagusESCCresponse to toxic substance150/8552262/187231.00e-047.12e-04150
GO:007259318EsophagusESCCreactive oxygen species metabolic process137/8552239/187231.82e-041.16e-03137
GO:1990748110EsophagusESCCcellular detoxification70/8552116/187231.02e-035.17e-0370
GO:00301993EsophagusESCCcollagen fibril organization40/855261/187231.35e-036.44e-0340
GO:0097237110EsophagusESCCcellular response to toxic substance72/8552124/187233.65e-031.49e-0272
GO:0098869110EsophagusESCCcellular oxidant detoxification60/8552101/187233.76e-031.53e-0260
GO:00717115EsophagusESCCbasement membrane organization22/855231/187233.90e-031.58e-0222
GO:00850292EsophagusESCCextracellular matrix assembly29/855245/187238.63e-033.04e-0229
GO:000697920Oral cavityOSCCresponse to oxidative stress273/7305446/187238.35e-221.65e-19273
GO:00019594Oral cavityOSCCregulation of cytokine-mediated signaling pathway87/7305150/187231.82e-062.35e-0587
GO:00607594Oral cavityOSCCregulation of response to cytokine stimulus92/7305162/187233.25e-063.90e-0592
GO:000963618Oral cavityOSCCresponse to toxic substance137/7305262/187237.94e-068.52e-05137
GO:007259316Oral cavityOSCCreactive oxygen species metabolic process122/7305239/187239.73e-057.34e-04122
GO:00192214Oral cavityOSCCcytokine-mediated signaling pathway222/7305472/187232.02e-041.35e-03222
Page: 1 2 3 4 5 

check button Enriched KEGG pathways.
Pathway IDTissueDisease StageDescriptionGene RatioBg Ratiopvaluep.adjustqvalueCount
Page: 1 

Top

Cell-cell communication analysis

check buttonIdentification of potential cell-cell interactions between two cell types and their ligand-receptor pairs for different disease states
LigandReceptorLRpairPathwayTissueDisease Stage
Page: 1 

Top

Single-cell gene regulatory network inference analysis

check buttonFind out the significant the regulons (TFs) and the target genes of each regulon across cell types for different disease states
TFCell TypeTissueDisease StageTarget GeneRSSRegulon Activity
∗The dot plots of a searched regulon are shown for all cell subpopulations in each disease state of each tissue based on the regulon specific score inferred using pySCENIC and by calculating the average expression.
Page: 1 

Top

Somatic mutation of malignant transformation related genes

check buttonAnnotation of somatic variants for genes involved in malignant transformation
Hugo SymbolVariant ClassVariant ClassificationdbSNP RSHGVScHGVSpHGVSp ShortSWISSPROTBIOTYPESIFTPolyPhenTumor Sample BarcodeTissueHistologySexAgeStageTherapy TypesDrugsOutcome
PXDNSNVMissense_Mutationnovelc.1537N>Tp.Val513Phep.V513FQ92626protein_codingdeleterious(0.03)possibly_damaging(0.616)TCGA-BH-A0BW-01Breastbreast invasive carcinomaFemale>=65I/IIChemotherapyadriamycinCR
PXDNSNVMissense_Mutationrs536136666c.3542N>Tp.Ala1181Valp.A1181VQ92626protein_codingtolerated(0.65)benign(0.108)TCGA-BH-A0H7-01Breastbreast invasive carcinomaFemale>=65III/IVChemotherapydoxorubicinSD
PXDNSNVMissense_Mutationc.2951N>Cp.Leu984Prop.L984PQ92626protein_codingdeleterious(0)probably_damaging(1)TCGA-D8-A1XK-01Breastbreast invasive carcinomaFemale<65I/IIChemotherapydoxorubicine+cyclophosphamideSD
PXDNSNVMissense_Mutationnovelc.3496N>Ap.Gly1166Argp.G1166RQ92626protein_codingdeleterious(0.02)probably_damaging(0.999)TCGA-JL-A3YX-01Breastbreast invasive carcinomaFemale<65I/IIUnknownUnknownSD
PXDNinsertionFrame_Shift_Insnovelc.672_673insATp.Pro225IlefsTer18p.P225Ifs*18Q92626protein_codingTCGA-A2-A04Y-01Breastbreast invasive carcinomaFemale<65I/IIChemotherapycytoxanSD
PXDNinsertionNonsense_Mutationnovelc.3700_3701insAAGCTGACACAGCTTAGAGAp.Cys1234Terp.C1234*Q92626protein_codingTCGA-A8-A081-01Breastbreast invasive carcinomaFemale>=65I/IIUnknownUnknownSD
PXDNinsertionNonsense_Mutationnovelc.2003_2004insAATAATTTp.Tyr668Terp.Y668*Q92626protein_codingTCGA-AC-A3QQ-01Breastbreast invasive carcinomaFemale<65I/IIUnknownUnknownSD
PXDNinsertionFrame_Shift_Insnovelc.3901_3902insTATTTAATTTAGTAAGCGTTGAAATCTGCACTGATAATAGp.Cys1301LeufsTer15p.C1301Lfs*15Q92626protein_codingTCGA-AO-A0JD-01Breastbreast invasive carcinomaFemale<65III/IVChemotherapycyclophosphamideSD
PXDNSNVMissense_Mutationnovelc.1841C>Ap.Pro614Hisp.P614HQ92626protein_codingtolerated(0.06)possibly_damaging(0.76)TCGA-2W-A8YY-01Cervixcervical & endocervical cancerFemale<65I/IIChemotherapycisplatinCR
PXDNSNVMissense_Mutationnovelc.1435C>Tp.His479Tyrp.H479YQ92626protein_codingtolerated(0.3)probably_damaging(0.943)TCGA-2W-A8YY-01Cervixcervical & endocervical cancerFemale<65I/IIChemotherapycisplatinCR
Page: 1 2 3 4 5 6 7 8 9 10 11 12 13 14 15 16 17 18 19 20 21 22 23 24 25 26 27 28 29 30 31 

Top

Related drugs of malignant transformation related genes

check buttonIdentification of chemicals and drugs interact with genes involved in malignant transfromation
(DGIdb 4.0)
Entrez IDSymbolCategoryInteraction TypesDrug Claim NameDrug NamePMIDs
Page: 1