
|
|||||
|
 | |
| |
| |
| |
| |
| |
|
Gene: PXDC1 |
Gene summary for PXDC1 |
| Gene information | Species | Human | Gene symbol | PXDC1 | Gene ID | 221749 |
| Gene name | PX domain containing 1 | |
| Gene Alias | C6orf145 | |
| Cytomap | 6p25.2 | |
| Gene Type | protein-coding | GO ID | GO:0003674 | UniProtAcc | Q5TGL8 |
Top |
Malignant transformation analysis |
| Identification of the aberrant gene expression in precancerous and cancerous lesions by comparing the gene expression of stem-like cells in diseased tissues with normal stem cells |
| Entrez ID | Symbol | Replicates | Species | Organ | Tissue | Adj P-value | Log2FC | Malignancy |
| 221749 | PXDC1 | GSM5276934 | Human | Endometrium | EEC | 2.98e-07 | 2.37e-01 | -0.0913 |
| 221749 | PXDC1 | GSM5276937 | Human | Endometrium | EEC | 4.93e-22 | 5.52e-01 | -0.0897 |
| 221749 | PXDC1 | GSM6177620_NYU_UCEC1_lib1_lib1 | Human | Endometrium | EEC | 1.40e-04 | -1.10e-02 | -0.1869 |
| 221749 | PXDC1 | GSM6177620_NYU_UCEC1_lib2_lib2 | Human | Endometrium | EEC | 3.20e-04 | -2.30e-02 | -0.1875 |
| 221749 | PXDC1 | GSM6177620_NYU_UCEC1_lib3_lib3 | Human | Endometrium | EEC | 2.50e-02 | -2.04e-02 | -0.1883 |
| 221749 | PXDC1 | GSM6177621_NYU_UCEC2_lib1_lib1 | Human | Endometrium | EEC | 6.26e-04 | -2.84e-02 | -0.1934 |
| 221749 | PXDC1 | GSM6177622_NYU_UCEC3_lib1_lib1 | Human | Endometrium | EEC | 5.18e-04 | -2.92e-02 | -0.1917 |
| 221749 | PXDC1 | GSM6177622_NYU_UCEC3_lib2_lib2 | Human | Endometrium | EEC | 8.54e-03 | -6.12e-02 | -0.1916 |
| 221749 | PXDC1 | LZE4T | Human | Esophagus | ESCC | 1.14e-02 | -1.70e-01 | 0.0811 |
| 221749 | PXDC1 | LZE5T | Human | Esophagus | ESCC | 3.40e-02 | -3.60e-02 | 0.0514 |
| 221749 | PXDC1 | LZE20T | Human | Esophagus | ESCC | 2.96e-04 | -6.10e-02 | 0.0662 |
| 221749 | PXDC1 | LZE24T | Human | Esophagus | ESCC | 3.61e-07 | -1.37e-01 | 0.0596 |
| 221749 | PXDC1 | P2T-E | Human | Esophagus | ESCC | 2.17e-15 | -4.23e-02 | 0.1177 |
| 221749 | PXDC1 | P4T-E | Human | Esophagus | ESCC | 1.48e-08 | 3.32e-02 | 0.1323 |
| 221749 | PXDC1 | P5T-E | Human | Esophagus | ESCC | 1.37e-09 | -4.57e-02 | 0.1327 |
| 221749 | PXDC1 | P8T-E | Human | Esophagus | ESCC | 1.21e-07 | -1.19e-01 | 0.0889 |
| 221749 | PXDC1 | P9T-E | Human | Esophagus | ESCC | 2.59e-08 | 7.99e-02 | 0.1131 |
| 221749 | PXDC1 | P10T-E | Human | Esophagus | ESCC | 2.83e-10 | -1.41e-02 | 0.116 |
| 221749 | PXDC1 | P11T-E | Human | Esophagus | ESCC | 7.62e-09 | 5.39e-01 | 0.1426 |
| 221749 | PXDC1 | P12T-E | Human | Esophagus | ESCC | 2.15e-18 | 1.16e-01 | 0.1122 |
| Page: 1 2 3 4 5 |
| Tissue | Expression Dynamics | Abbreviation |
| Endometrium | 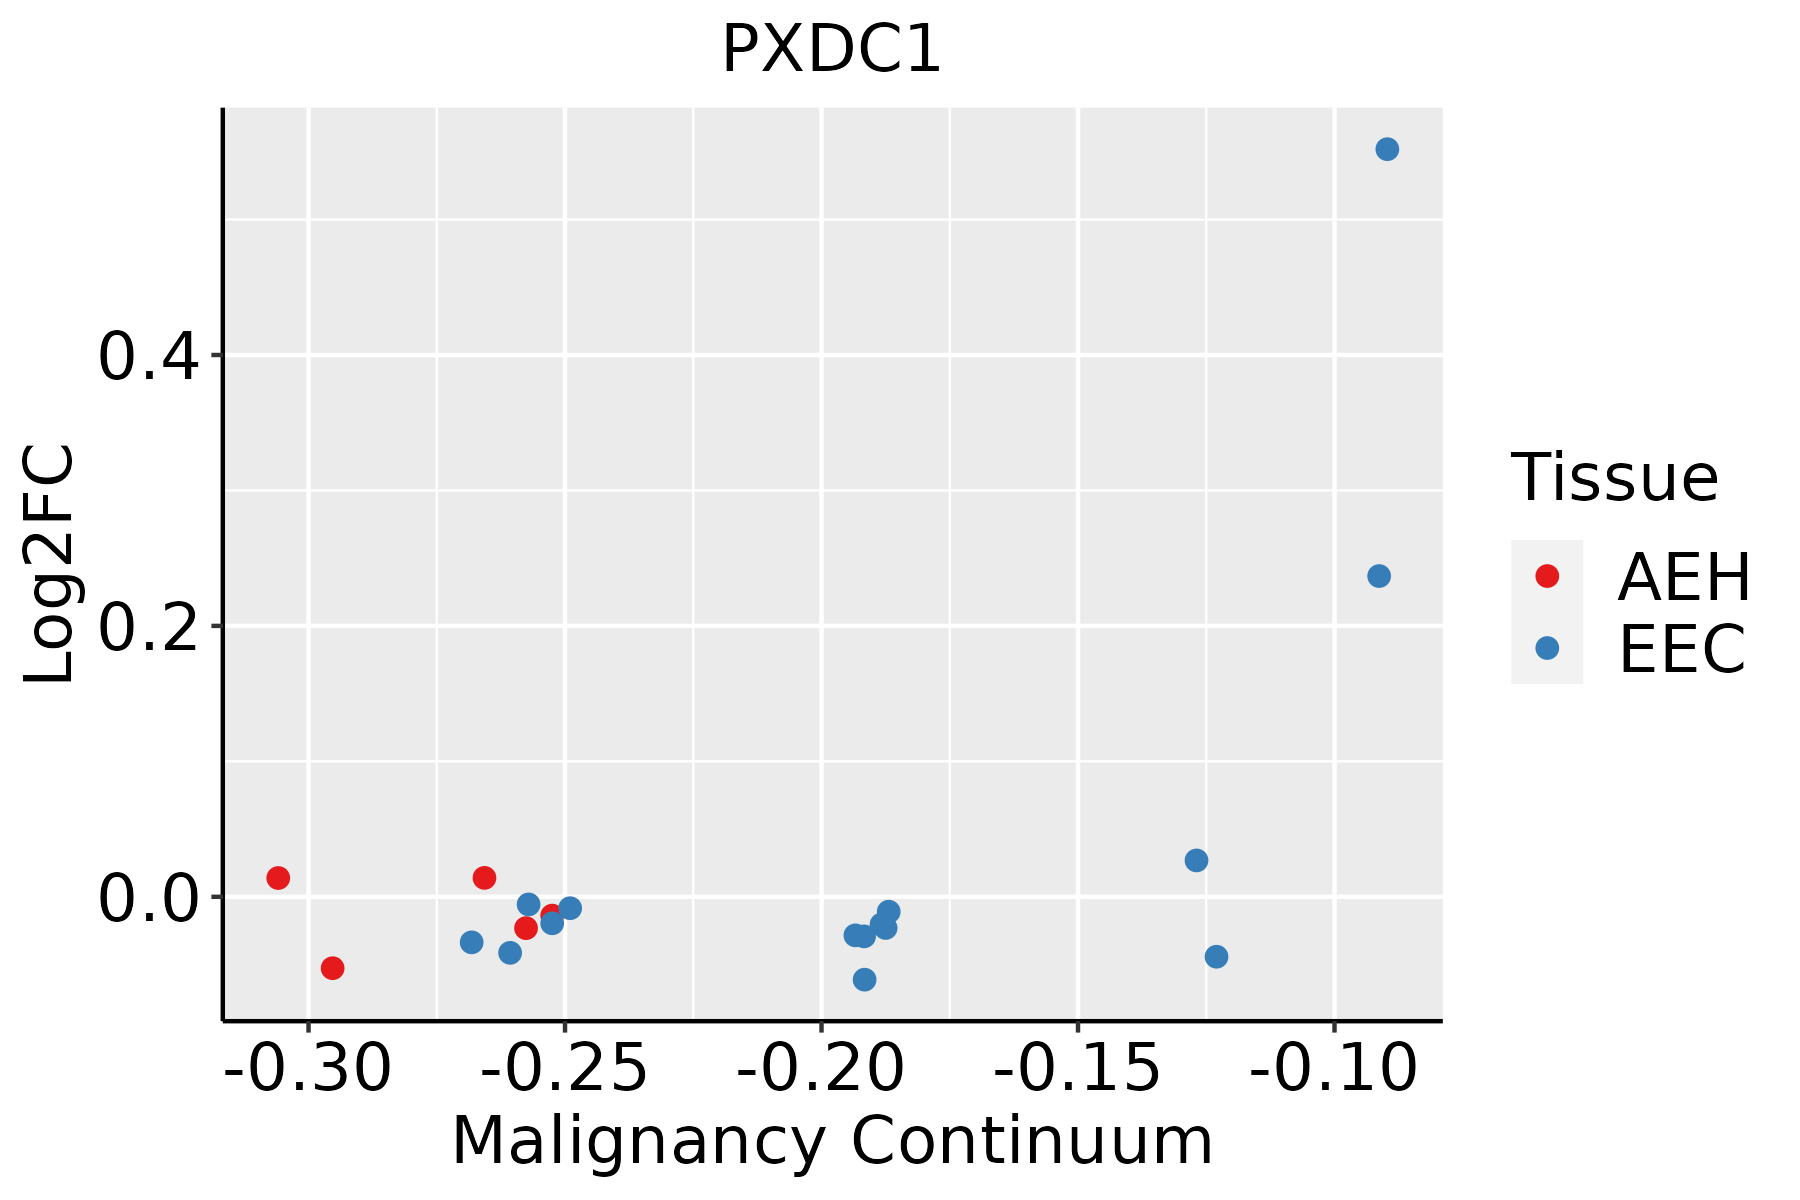 | AEH: Atypical endometrial hyperplasia |
| EEC: Endometrioid Cancer | ||
| Esophagus | 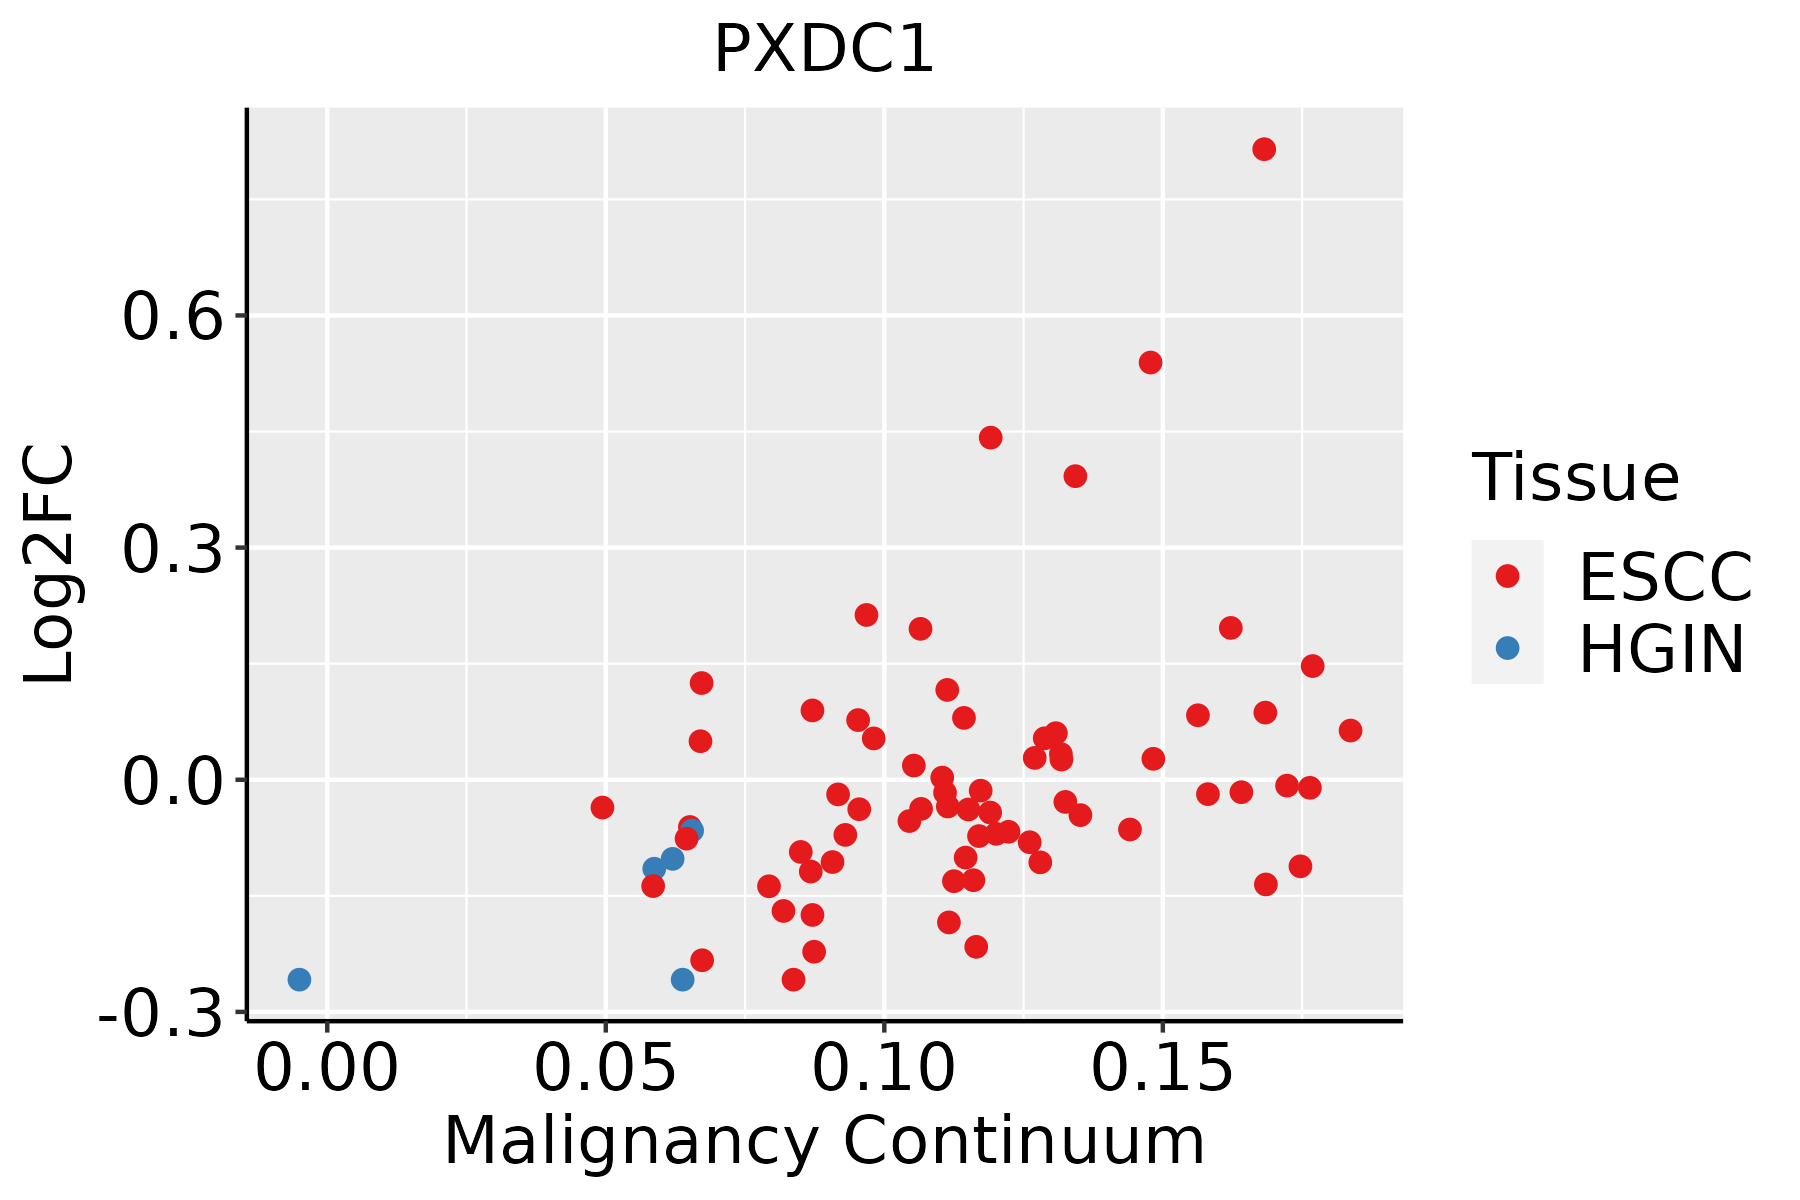 | ESCC: Esophageal squamous cell carcinoma |
| HGIN: High-grade intraepithelial neoplasias | ||
| LGIN: Low-grade intraepithelial neoplasias | ||
| Liver | 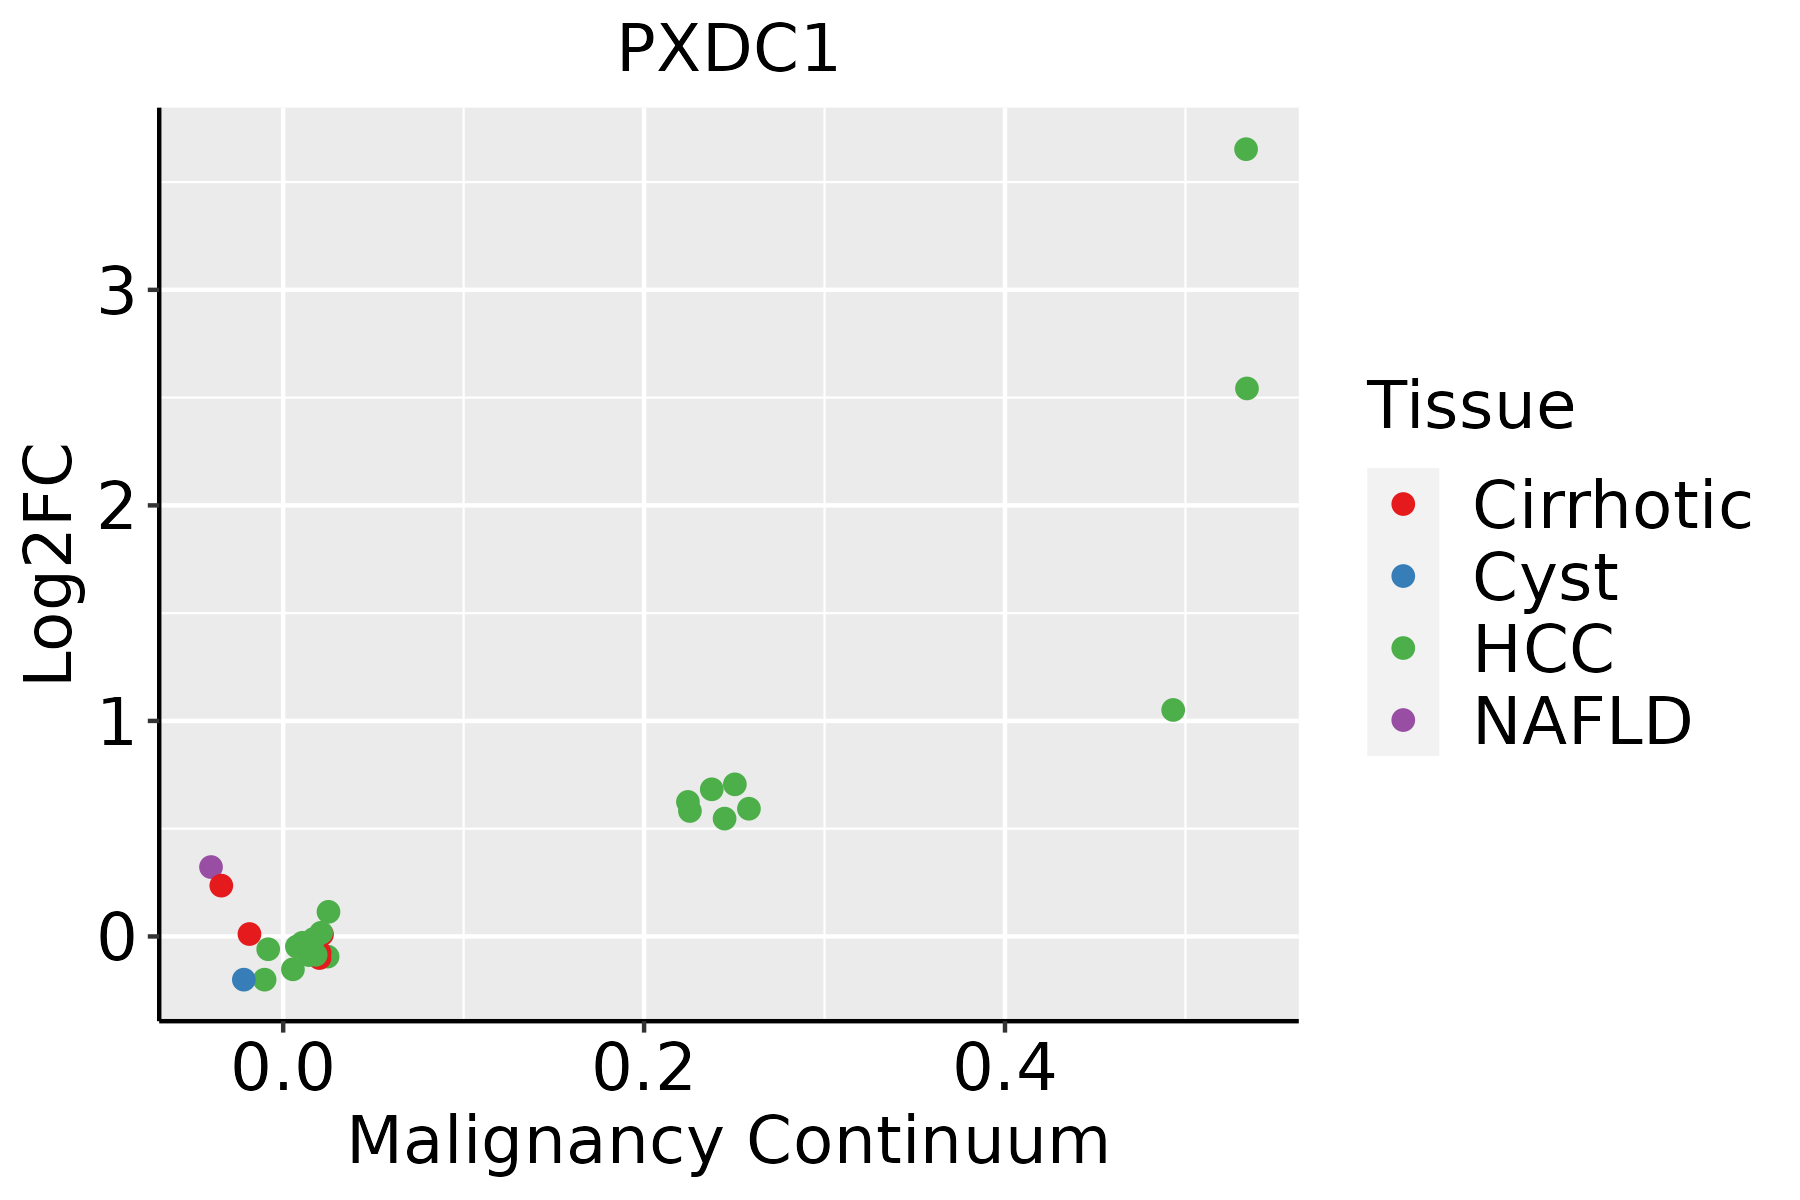 | HCC: Hepatocellular carcinoma |
| NAFLD: Non-alcoholic fatty liver disease | ||
| Oral Cavity |  | EOLP: Erosive Oral lichen planus |
| LP: leukoplakia | ||
| NEOLP: Non-erosive oral lichen planus | ||
| OSCC: Oral squamous cell carcinoma | ||
| Thyroid | 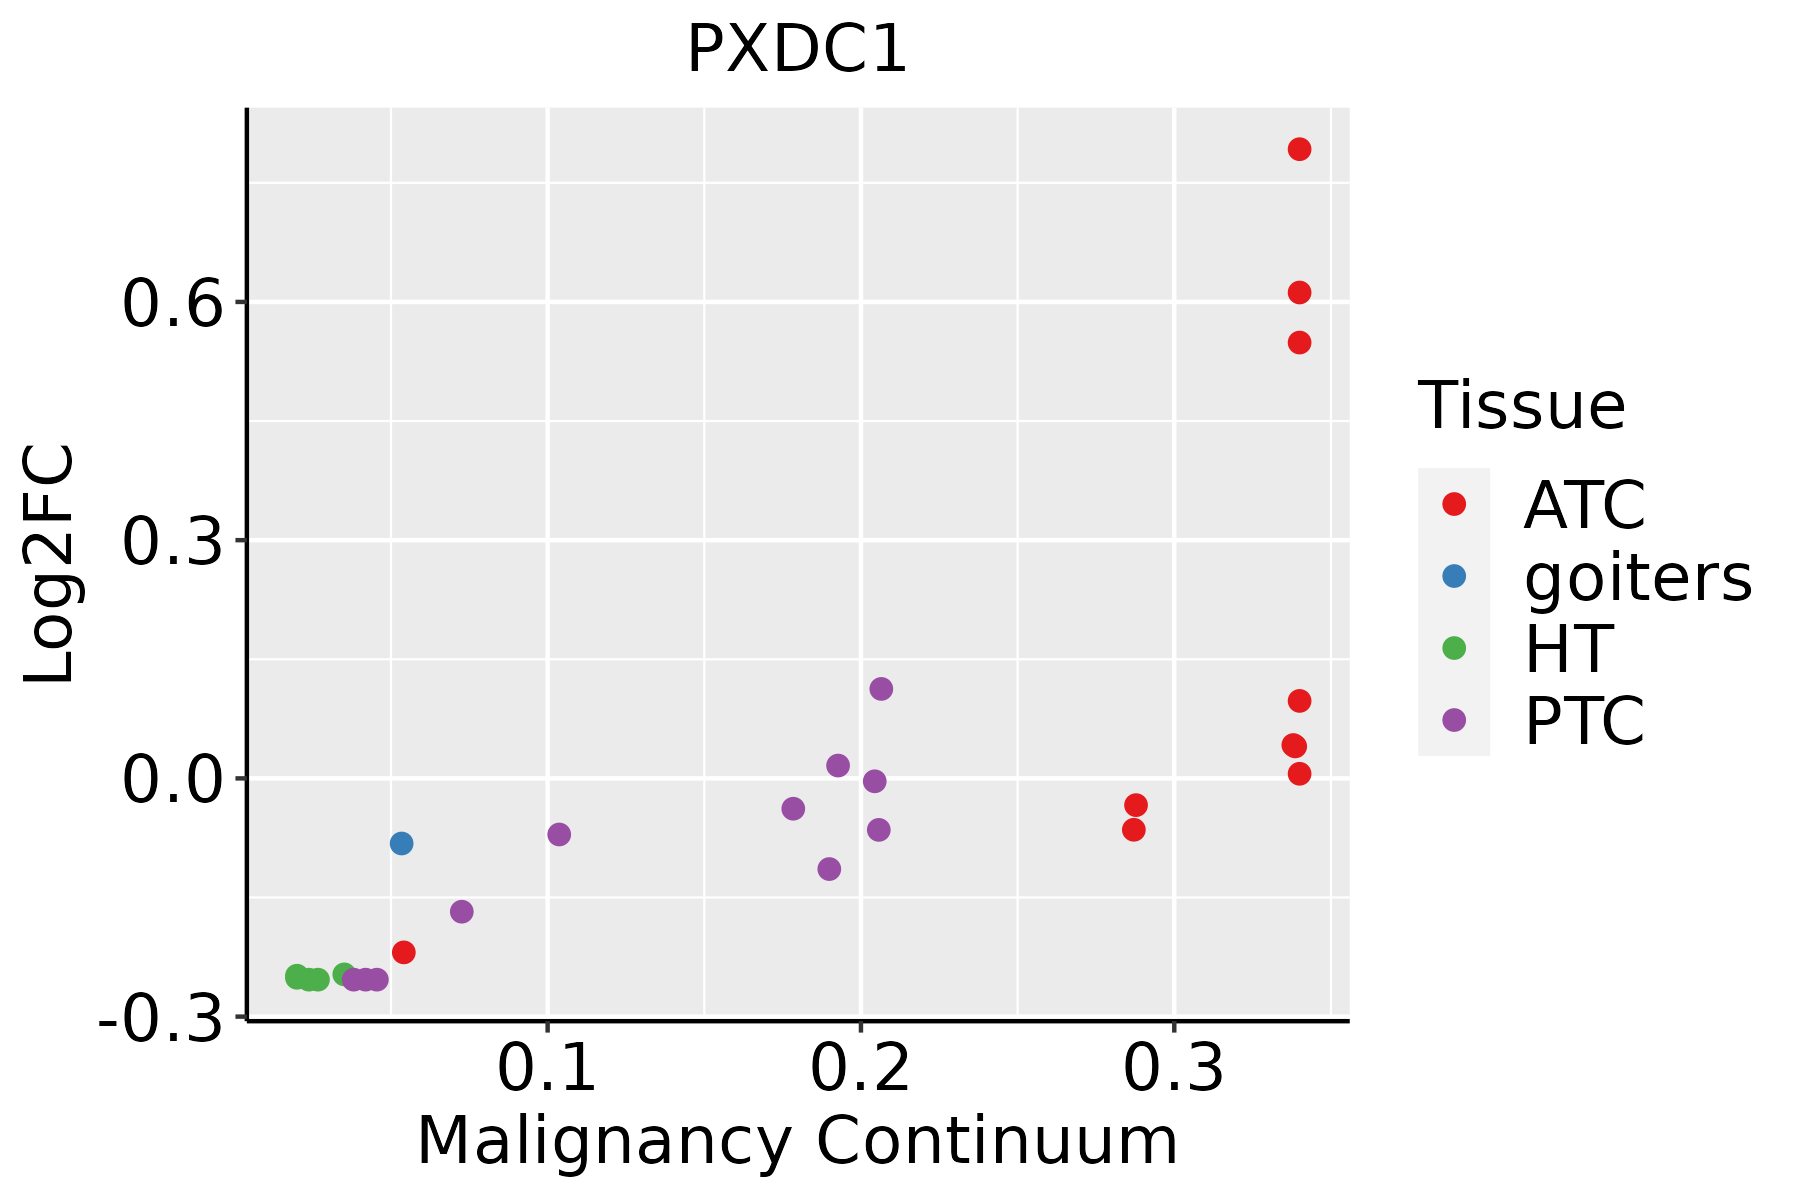 | ATC: Anaplastic thyroid cancer |
| HT: Hashimoto's thyroiditis | ||
| PTC: Papillary thyroid cancer |
| ∗log2FC in expression of this searched gene in stem-like cells from each diseased tissue sample relative to stem-like cells in normal samples in each tissue plotted against the malignancy continuum. Samples are colored based on if they are from different disease stage. |
Top |
Malignant transformation related pathway analysis |
| Find out the enriched GO biological processes and KEGG pathways involved in transition from healthy to precancer to cancer |
| Tissue | Disease Stage | Enriched GO biological Processes |
| Colorectum | AD |  |
| Colorectum | SER |  |
| Colorectum | MSS |  |
| Colorectum | MSI-H |  |
| Colorectum | FAP |  |
| ∗Top 15 enriched GO BP terms are showed in the bar plot of each disease state in each tissue. Each row represents a significant GO biological process which is colored according to the -log10(p.adjust). |
| Page: 1 2 3 4 5 6 7 8 9 |
| GO ID | Tissue | Disease Stage | Description | Gene Ratio | Bg Ratio | pvalue | p.adjust | Count |
| Page: 1 |
| Pathway ID | Tissue | Disease Stage | Description | Gene Ratio | Bg Ratio | pvalue | p.adjust | qvalue | Count |
| Page: 1 |
Top |
Cell-cell communication analysis |
| Identification of potential cell-cell interactions between two cell types and their ligand-receptor pairs for different disease states |
| Ligand | Receptor | LRpair | Pathway | Tissue | Disease Stage |
| Page: 1 |
Top |
Single-cell gene regulatory network inference analysis |
| Find out the significant the regulons (TFs) and the target genes of each regulon across cell types for different disease states |
| TF | Cell Type | Tissue | Disease Stage | Target Gene | RSS | Regulon Activity |
| ∗The dot plots of a searched regulon are shown for all cell subpopulations in each disease state of each tissue based on the regulon specific score inferred using pySCENIC and by calculating the average expression. |
| Page: 1 |
Top |
Somatic mutation of malignant transformation related genes |
| Annotation of somatic variants for genes involved in malignant transformation |
| Hugo Symbol | Variant Class | Variant Classification | dbSNP RS | HGVSc | HGVSp | HGVSp Short | SWISSPROT | BIOTYPE | SIFT | PolyPhen | Tumor Sample Barcode | Tissue | Histology | Sex | Age | Stage | Therapy Types | Drugs | Outcome |
| PXDC1 | SNV | Missense_Mutation | c.304N>A | p.Glu102Lys | p.E102K | Q5TGL8 | protein_coding | deleterious_low_confidence(0.01) | probably_damaging(0.995) | TCGA-C5-A7UH-01 | Cervix | cervical & endocervical cancer | Female | <65 | III/IV | Chemotherapy | cisplatin | SD | |
| PXDC1 | insertion | In_Frame_Ins | novel | c.691_692insCACCAAGCAGGG | p.Trp230_Asp231insAlaProSerArg | p.W230_D231insAPSR | Q5TGL8 | protein_coding | TCGA-DS-A1OB-01 | Cervix | cervical & endocervical cancer | Female | <65 | I/II | Chemotherapy | carboplatin | PD | ||
| PXDC1 | SNV | Missense_Mutation | rs774517433 | c.559N>A | p.Val187Met | p.V187M | Q5TGL8 | protein_coding | tolerated_low_confidence(0.07) | benign(0.003) | TCGA-EI-6507-01 | Colorectum | rectum adenocarcinoma | Male | <65 | I/II | Unknown | Unknown | SD |
| PXDC1 | deletion | Frame_Shift_Del | c.413delA | p.Asn138MetfsTer21 | p.N138Mfs*21 | Q5TGL8 | protein_coding | TCGA-5M-AAT6-01 | Colorectum | colon adenocarcinoma | Female | <65 | III/IV | Unknown | Unknown | PD | |||
| PXDC1 | SNV | Missense_Mutation | novel | c.291N>T | p.Glu97Asp | p.E97D | Q5TGL8 | protein_coding | deleterious_low_confidence(0) | probably_damaging(0.992) | TCGA-A5-A0G2-01 | Endometrium | uterine corpus endometrioid carcinoma | Female | <65 | III/IV | Unknown | Unknown | SD |
| PXDC1 | SNV | Missense_Mutation | novel | c.297N>T | p.Arg99Ser | p.R99S | Q5TGL8 | protein_coding | deleterious_low_confidence(0) | benign(0.433) | TCGA-A5-A1OF-01 | Endometrium | uterine corpus endometrioid carcinoma | Female | <65 | I/II | Unknown | Unknown | SD |
| PXDC1 | SNV | Missense_Mutation | novel | c.350N>G | p.Tyr117Cys | p.Y117C | Q5TGL8 | protein_coding | deleterious_low_confidence(0) | probably_damaging(0.979) | TCGA-AJ-A3BH-01 | Endometrium | uterine corpus endometrioid carcinoma | Female | Unknown | I/II | Unknown | Unknown | SD |
| PXDC1 | SNV | Missense_Mutation | c.625N>A | p.Asp209Asn | p.D209N | Q5TGL8 | protein_coding | deleterious_low_confidence(0.01) | benign(0.005) | TCGA-AX-A06F-01 | Endometrium | uterine corpus endometrioid carcinoma | Female | <65 | III/IV | Chemotherapy | carboplatin | SD | |
| PXDC1 | SNV | Missense_Mutation | c.382N>A | p.Glu128Lys | p.E128K | Q5TGL8 | protein_coding | tolerated_low_confidence(0.12) | probably_damaging(0.995) | TCGA-B5-A0JY-01 | Endometrium | uterine corpus endometrioid carcinoma | Female | <65 | III/IV | Chemotherapy | doxorubicin | SD | |
| PXDC1 | SNV | Missense_Mutation | c.310G>A | p.Glu104Lys | p.E104K | Q5TGL8 | protein_coding | deleterious_low_confidence(0.01) | probably_damaging(0.995) | TCGA-B5-A11E-01 | Endometrium | uterine corpus endometrioid carcinoma | Female | <65 | I/II | Unknown | Unknown | SD |
| Page: 1 2 3 |
Top |
Related drugs of malignant transformation related genes |
| Identification of chemicals and drugs interact with genes involved in malignant transfromation |
| (DGIdb 4.0) |
| Entrez ID | Symbol | Category | Interaction Types | Drug Claim Name | Drug Name | PMIDs |
| Page: 1 |

Copyright 2023-Present -The University of Texas Health Science Center at Houston |