
|
|||||
|
 | |
| |
| |
| |
| |
| |
|
Gene: PWWP2A |
Gene summary for PWWP2A |
| Gene information | Species | Human | Gene symbol | PWWP2A | Gene ID | 114825 |
| Gene name | PWWP domain containing 2A | |
| Gene Alias | MST101 | |
| Cytomap | 5q33.3 | |
| Gene Type | protein-coding | GO ID | GO:0005575 | UniProtAcc | Q96N64 |
Top |
Malignant transformation analysis |
| Identification of the aberrant gene expression in precancerous and cancerous lesions by comparing the gene expression of stem-like cells in diseased tissues with normal stem cells |
| Entrez ID | Symbol | Replicates | Species | Organ | Tissue | Adj P-value | Log2FC | Malignancy |
| 114825 | PWWP2A | LZE20T | Human | Esophagus | ESCC | 1.59e-02 | 1.38e-01 | 0.0662 |
| 114825 | PWWP2A | LZE24T | Human | Esophagus | ESCC | 3.42e-06 | 1.95e-01 | 0.0596 |
| 114825 | PWWP2A | P1T-E | Human | Esophagus | ESCC | 9.95e-13 | 4.58e-01 | 0.0875 |
| 114825 | PWWP2A | P2T-E | Human | Esophagus | ESCC | 7.23e-34 | 6.18e-01 | 0.1177 |
| 114825 | PWWP2A | P4T-E | Human | Esophagus | ESCC | 1.71e-20 | 4.06e-01 | 0.1323 |
| 114825 | PWWP2A | P5T-E | Human | Esophagus | ESCC | 1.76e-17 | 2.88e-01 | 0.1327 |
| 114825 | PWWP2A | P8T-E | Human | Esophagus | ESCC | 6.95e-08 | 1.51e-01 | 0.0889 |
| 114825 | PWWP2A | P9T-E | Human | Esophagus | ESCC | 4.54e-08 | 1.71e-01 | 0.1131 |
| 114825 | PWWP2A | P10T-E | Human | Esophagus | ESCC | 1.27e-13 | 1.91e-01 | 0.116 |
| 114825 | PWWP2A | P11T-E | Human | Esophagus | ESCC | 7.34e-12 | 6.26e-01 | 0.1426 |
| 114825 | PWWP2A | P12T-E | Human | Esophagus | ESCC | 9.59e-25 | 4.09e-01 | 0.1122 |
| 114825 | PWWP2A | P15T-E | Human | Esophagus | ESCC | 2.47e-17 | 3.39e-01 | 0.1149 |
| 114825 | PWWP2A | P16T-E | Human | Esophagus | ESCC | 1.25e-20 | 2.72e-01 | 0.1153 |
| 114825 | PWWP2A | P17T-E | Human | Esophagus | ESCC | 2.13e-05 | 2.92e-01 | 0.1278 |
| 114825 | PWWP2A | P19T-E | Human | Esophagus | ESCC | 8.91e-05 | 3.68e-01 | 0.1662 |
| 114825 | PWWP2A | P20T-E | Human | Esophagus | ESCC | 2.06e-16 | 2.82e-01 | 0.1124 |
| 114825 | PWWP2A | P21T-E | Human | Esophagus | ESCC | 1.84e-13 | 2.17e-01 | 0.1617 |
| 114825 | PWWP2A | P22T-E | Human | Esophagus | ESCC | 4.85e-12 | 1.96e-01 | 0.1236 |
| 114825 | PWWP2A | P23T-E | Human | Esophagus | ESCC | 1.57e-18 | 3.94e-01 | 0.108 |
| 114825 | PWWP2A | P24T-E | Human | Esophagus | ESCC | 1.16e-07 | 1.61e-01 | 0.1287 |
| Page: 1 2 3 4 |
| Tissue | Expression Dynamics | Abbreviation |
| Esophagus | 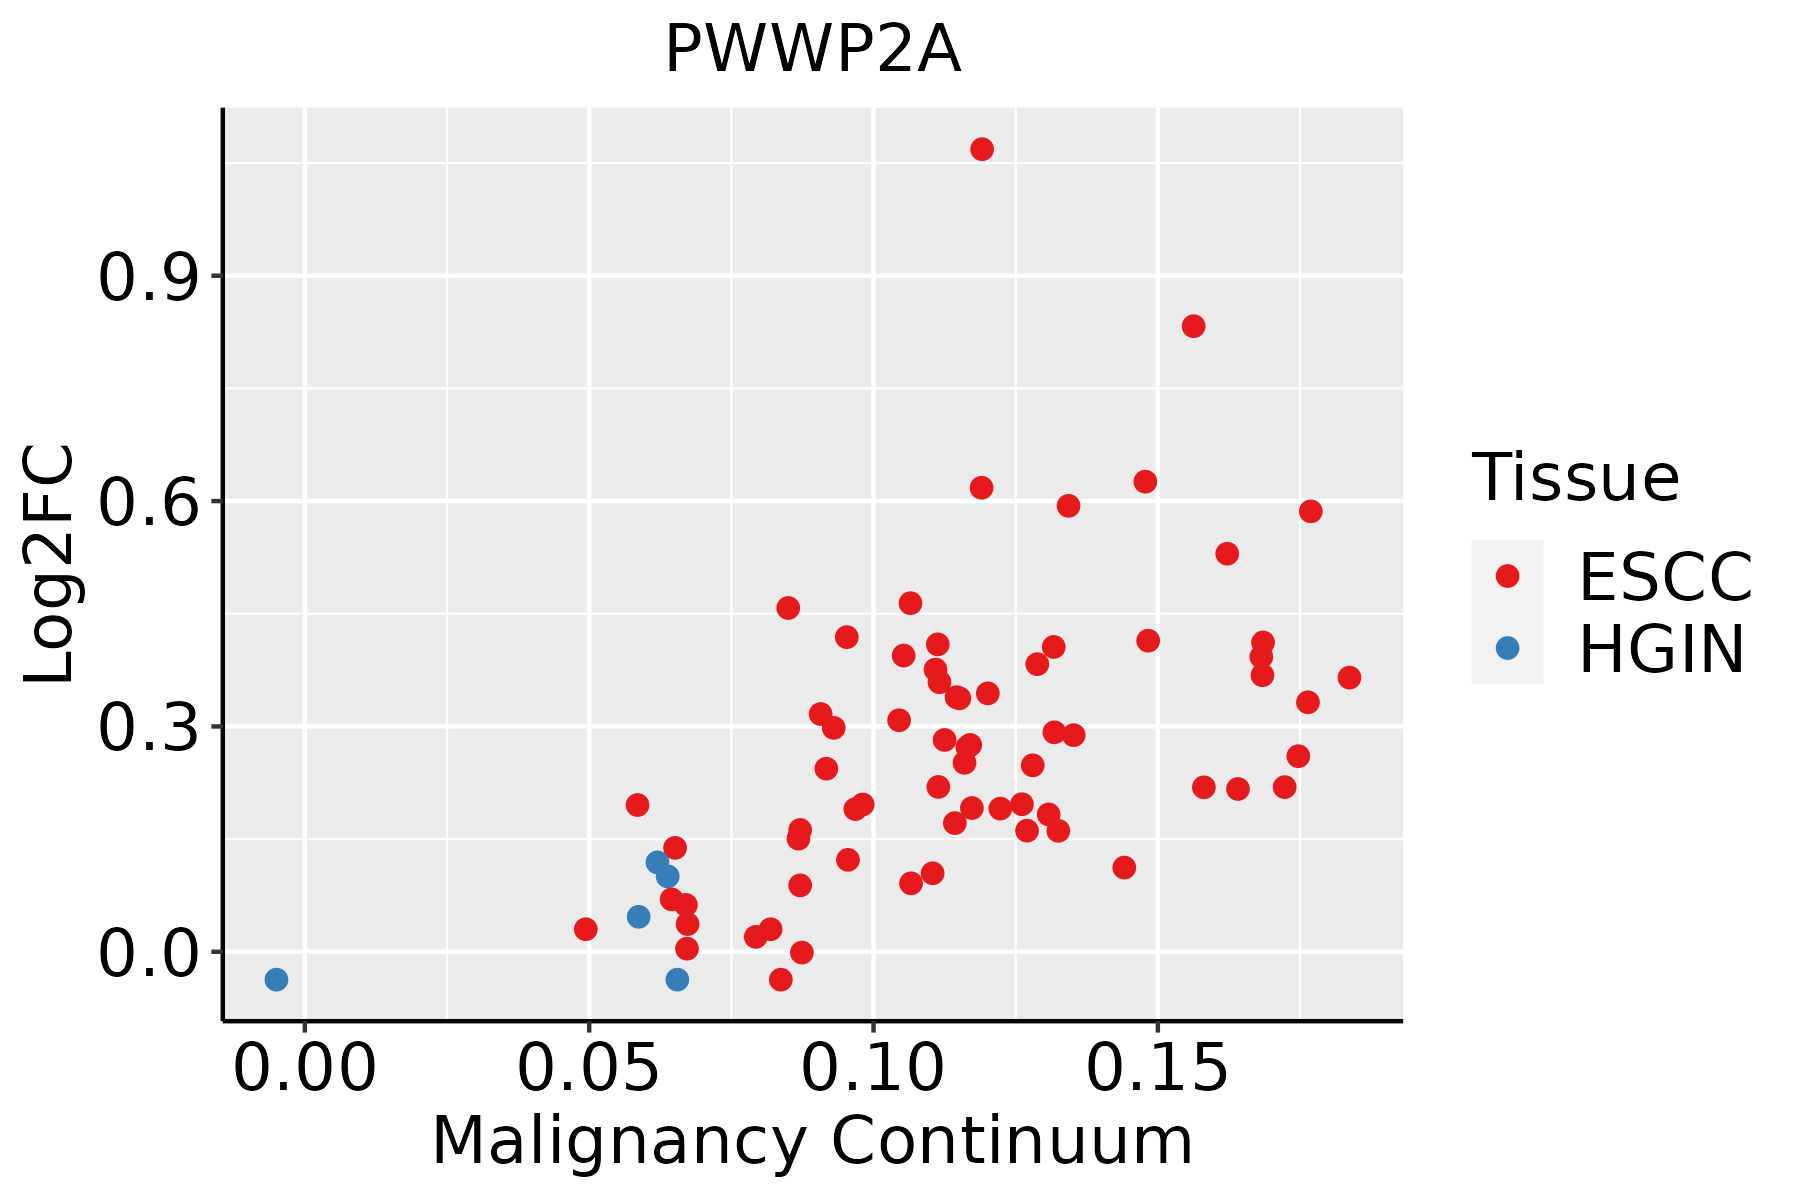 | ESCC: Esophageal squamous cell carcinoma |
| HGIN: High-grade intraepithelial neoplasias | ||
| LGIN: Low-grade intraepithelial neoplasias | ||
| Thyroid |  | ATC: Anaplastic thyroid cancer |
| HT: Hashimoto's thyroiditis | ||
| PTC: Papillary thyroid cancer |
| ∗log2FC in expression of this searched gene in stem-like cells from each diseased tissue sample relative to stem-like cells in normal samples in each tissue plotted against the malignancy continuum. Samples are colored based on if they are from different disease stage. |
Top |
Malignant transformation related pathway analysis |
| Find out the enriched GO biological processes and KEGG pathways involved in transition from healthy to precancer to cancer |
| Tissue | Disease Stage | Enriched GO biological Processes |
| Colorectum | AD |  |
| Colorectum | SER |  |
| Colorectum | MSS |  |
| Colorectum | MSI-H |  |
| Colorectum | FAP |  |
| ∗Top 15 enriched GO BP terms are showed in the bar plot of each disease state in each tissue. Each row represents a significant GO biological process which is colored according to the -log10(p.adjust). |
| Page: 1 2 3 4 5 6 7 8 9 |
| GO ID | Tissue | Disease Stage | Description | Gene Ratio | Bg Ratio | pvalue | p.adjust | Count |
| Page: 1 |
| Pathway ID | Tissue | Disease Stage | Description | Gene Ratio | Bg Ratio | pvalue | p.adjust | qvalue | Count |
| Page: 1 |
Top |
Cell-cell communication analysis |
| Identification of potential cell-cell interactions between two cell types and their ligand-receptor pairs for different disease states |
| Ligand | Receptor | LRpair | Pathway | Tissue | Disease Stage |
| Page: 1 |
Top |
Single-cell gene regulatory network inference analysis |
| Find out the significant the regulons (TFs) and the target genes of each regulon across cell types for different disease states |
| TF | Cell Type | Tissue | Disease Stage | Target Gene | RSS | Regulon Activity |
| ∗The dot plots of a searched regulon are shown for all cell subpopulations in each disease state of each tissue based on the regulon specific score inferred using pySCENIC and by calculating the average expression. |
| Page: 1 |
Top |
Somatic mutation of malignant transformation related genes |
| Annotation of somatic variants for genes involved in malignant transformation |
| Hugo Symbol | Variant Class | Variant Classification | dbSNP RS | HGVSc | HGVSp | HGVSp Short | SWISSPROT | BIOTYPE | SIFT | PolyPhen | Tumor Sample Barcode | Tissue | Histology | Sex | Age | Stage | Therapy Types | Drugs | Outcome |
| PWWP2A | SNV | Missense_Mutation | novel | c.619C>T | p.Pro207Ser | p.P207S | Q96N64 | protein_coding | deleterious(0) | probably_damaging(0.997) | TCGA-5L-AAT0-01 | Breast | breast invasive carcinoma | Female | <65 | I/II | Hormone Therapy | tamoxiphen | SD |
| PWWP2A | SNV | Missense_Mutation | novel | c.967G>C | p.Asp323His | p.D323H | Q96N64 | protein_coding | deleterious(0) | probably_damaging(0.936) | TCGA-A7-A4SF-01 | Breast | breast invasive carcinoma | Female | <65 | I/II | Chemotherapy | carboplatin | CR |
| PWWP2A | SNV | Missense_Mutation | c.1423N>T | p.Arg475Cys | p.R475C | Q96N64 | protein_coding | deleterious(0.01) | probably_damaging(0.926) | TCGA-EW-A1J5-01 | Breast | breast invasive carcinoma | Female | <65 | I/II | Chemotherapy | adriamycin | SD | |
| PWWP2A | SNV | Missense_Mutation | rs758270619 | c.1526G>A | p.Arg509His | p.R509H | Q96N64 | protein_coding | deleterious(0.02) | benign(0.018) | TCGA-2W-A8YY-01 | Cervix | cervical & endocervical cancer | Female | <65 | I/II | Chemotherapy | cisplatin | CR |
| PWWP2A | SNV | Missense_Mutation | novel | c.2093C>G | p.Ser698Cys | p.S698C | Q96N64 | protein_coding | deleterious(0) | probably_damaging(1) | TCGA-C5-A8YR-01 | Cervix | cervical & endocervical cancer | Female | <65 | I/II | Unknown | Unknown | PD |
| PWWP2A | SNV | Missense_Mutation | rs758270619 | c.1526G>A | p.Arg509His | p.R509H | Q96N64 | protein_coding | deleterious(0.02) | benign(0.018) | TCGA-DG-A2KH-01 | Cervix | cervical & endocervical cancer | Female | <65 | I/II | Unknown | Unknown | SD |
| PWWP2A | SNV | Missense_Mutation | novel | c.752N>C | p.Leu251Pro | p.L251P | Q96N64 | protein_coding | tolerated(0.34) | benign(0) | TCGA-EA-A3HS-01 | Cervix | cervical & endocervical cancer | Female | <65 | I/II | Unknown | Unknown | SD |
| PWWP2A | SNV | Missense_Mutation | c.862N>G | p.Gln288Glu | p.Q288E | Q96N64 | protein_coding | deleterious(0.01) | probably_damaging(0.985) | TCGA-IR-A3LH-01 | Cervix | cervical & endocervical cancer | Female | <65 | I/II | Chemotherapy | cisplatin | CR | |
| PWWP2A | SNV | Missense_Mutation | novel | c.64G>A | p.Glu22Lys | p.E22K | Q96N64 | protein_coding | deleterious_low_confidence(0) | benign(0.177) | TCGA-VS-A953-01 | Cervix | cervical & endocervical cancer | Female | <65 | I/II | Unknown | Unknown | PD |
| PWWP2A | SNV | Missense_Mutation | c.896N>A | p.Arg299Gln | p.R299Q | Q96N64 | protein_coding | deleterious(0) | possibly_damaging(0.829) | TCGA-AA-3510-01 | Colorectum | colon adenocarcinoma | Male | >=65 | I/II | Unknown | Unknown | SD |
| Page: 1 2 3 4 5 6 7 |
Top |
Related drugs of malignant transformation related genes |
| Identification of chemicals and drugs interact with genes involved in malignant transfromation |
| (DGIdb 4.0) |
| Entrez ID | Symbol | Category | Interaction Types | Drug Claim Name | Drug Name | PMIDs |
| Page: 1 |

Copyright 2023-Present -The University of Texas Health Science Center at Houston |