
|
|||||
|
 | |
| |
| |
| |
| |
| |
|
Gene: PWP1 |
Gene summary for PWP1 |
| Gene information | Species | Human | Gene symbol | PWP1 | Gene ID | 11137 |
| Gene name | PWP1 homolog, endonuclein | |
| Gene Alias | IEF-SSP-9502 | |
| Cytomap | 12q23.3 | |
| Gene Type | protein-coding | GO ID | GO:0001932 | UniProtAcc | B4DJV5 |
Top |
Malignant transformation analysis |
| Identification of the aberrant gene expression in precancerous and cancerous lesions by comparing the gene expression of stem-like cells in diseased tissues with normal stem cells |
| Entrez ID | Symbol | Replicates | Species | Organ | Tissue | Adj P-value | Log2FC | Malignancy |
| 11137 | PWP1 | LZE2T | Human | Esophagus | ESCC | 1.01e-04 | 8.22e-01 | 0.082 |
| 11137 | PWP1 | LZE4T | Human | Esophagus | ESCC | 5.10e-15 | 3.78e-01 | 0.0811 |
| 11137 | PWP1 | LZE5T | Human | Esophagus | ESCC | 2.04e-02 | 1.96e-01 | 0.0514 |
| 11137 | PWP1 | LZE7T | Human | Esophagus | ESCC | 5.42e-10 | 7.24e-01 | 0.0667 |
| 11137 | PWP1 | LZE8T | Human | Esophagus | ESCC | 2.17e-11 | 1.42e-01 | 0.067 |
| 11137 | PWP1 | LZE20T | Human | Esophagus | ESCC | 3.33e-07 | 2.19e-01 | 0.0662 |
| 11137 | PWP1 | LZE22T | Human | Esophagus | ESCC | 4.21e-02 | 3.17e-01 | 0.068 |
| 11137 | PWP1 | LZE24T | Human | Esophagus | ESCC | 7.40e-16 | 5.52e-01 | 0.0596 |
| 11137 | PWP1 | LZE6T | Human | Esophagus | ESCC | 1.24e-04 | 5.39e-01 | 0.0845 |
| 11137 | PWP1 | P1T-E | Human | Esophagus | ESCC | 3.15e-07 | 7.44e-01 | 0.0875 |
| 11137 | PWP1 | P2T-E | Human | Esophagus | ESCC | 2.08e-69 | 1.44e+00 | 0.1177 |
| 11137 | PWP1 | P4T-E | Human | Esophagus | ESCC | 8.88e-44 | 1.23e+00 | 0.1323 |
| 11137 | PWP1 | P5T-E | Human | Esophagus | ESCC | 6.07e-31 | 7.66e-01 | 0.1327 |
| 11137 | PWP1 | P8T-E | Human | Esophagus | ESCC | 1.02e-33 | 6.61e-01 | 0.0889 |
| 11137 | PWP1 | P9T-E | Human | Esophagus | ESCC | 7.27e-17 | 4.11e-01 | 0.1131 |
| 11137 | PWP1 | P10T-E | Human | Esophagus | ESCC | 3.26e-34 | 7.30e-01 | 0.116 |
| 11137 | PWP1 | P11T-E | Human | Esophagus | ESCC | 7.61e-20 | 9.70e-01 | 0.1426 |
| 11137 | PWP1 | P12T-E | Human | Esophagus | ESCC | 1.53e-28 | 6.33e-01 | 0.1122 |
| 11137 | PWP1 | P15T-E | Human | Esophagus | ESCC | 3.13e-30 | 6.93e-01 | 0.1149 |
| 11137 | PWP1 | P16T-E | Human | Esophagus | ESCC | 3.89e-45 | 8.41e-01 | 0.1153 |
| Page: 1 2 3 4 5 6 7 |
| Tissue | Expression Dynamics | Abbreviation |
| Esophagus | 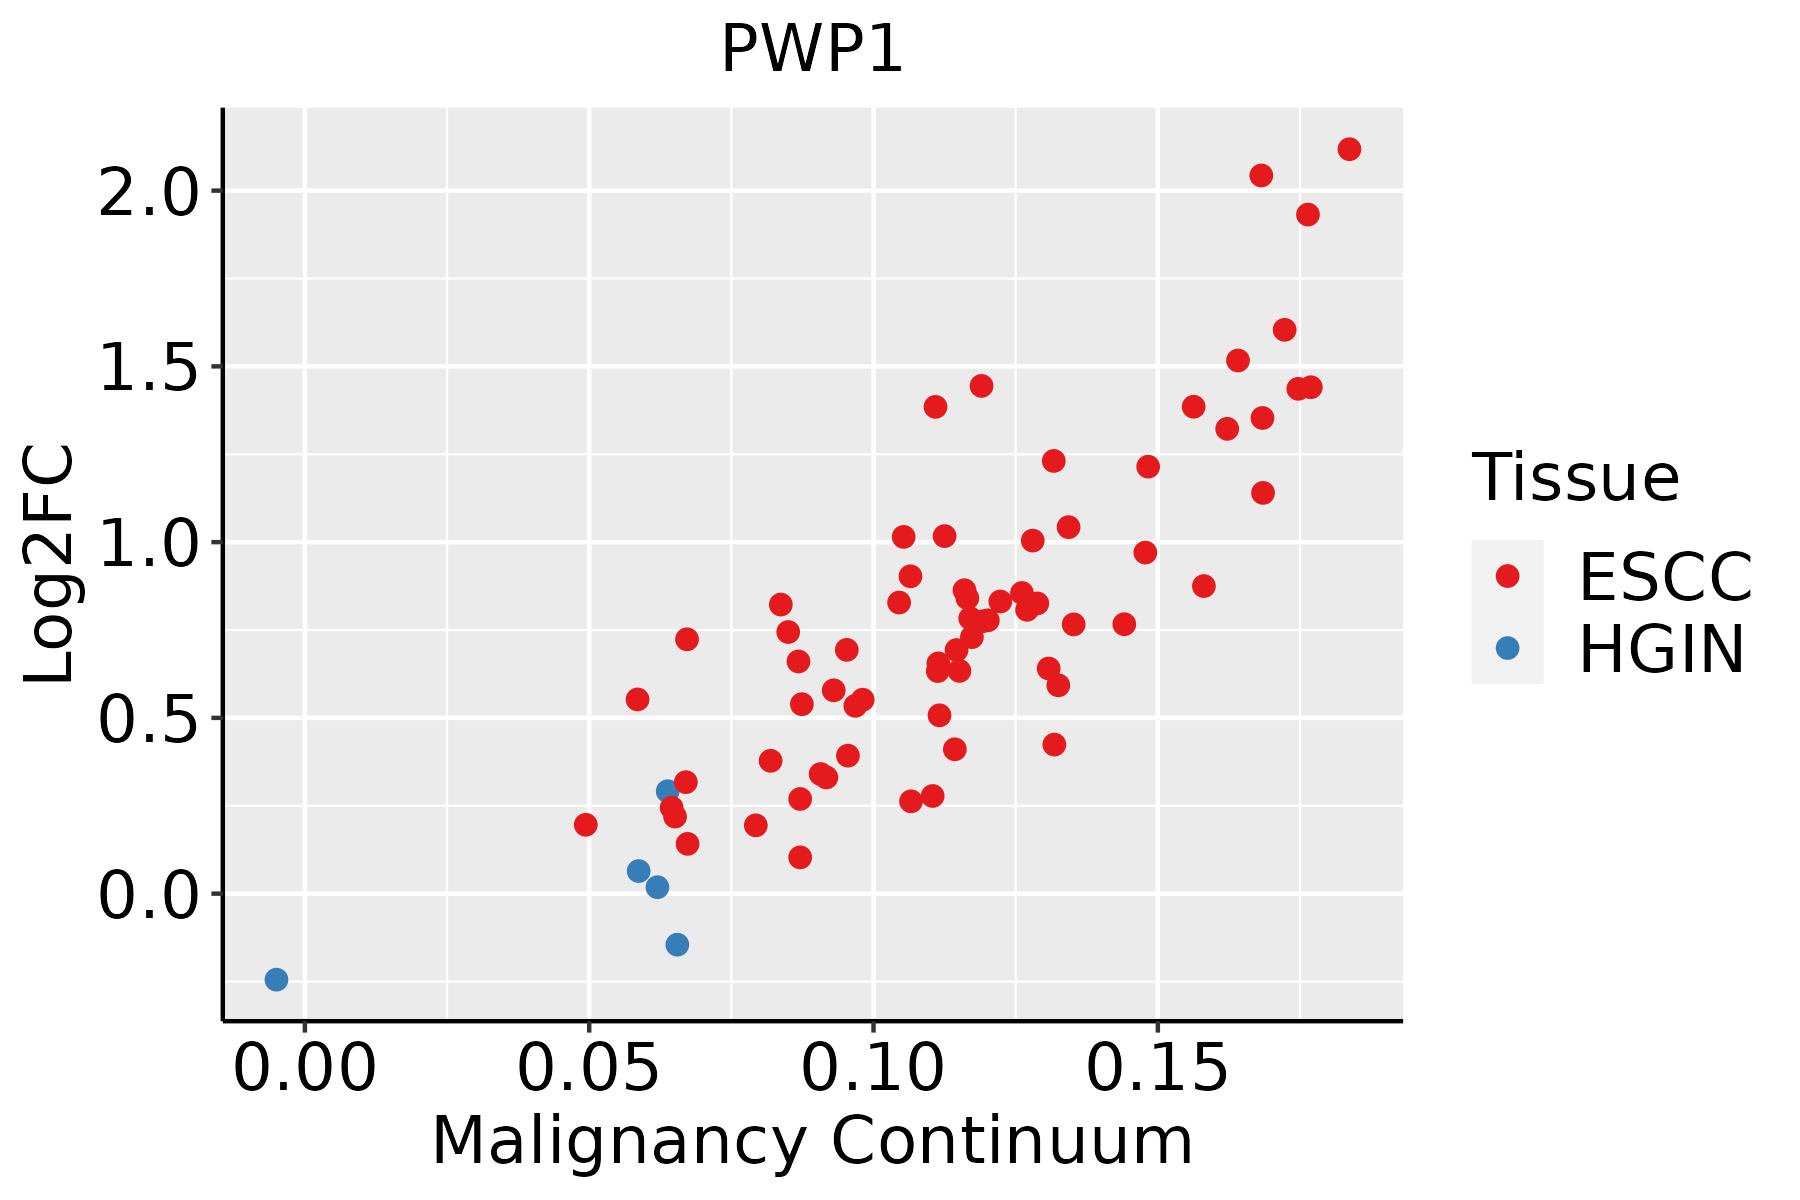 | ESCC: Esophageal squamous cell carcinoma |
| HGIN: High-grade intraepithelial neoplasias | ||
| LGIN: Low-grade intraepithelial neoplasias | ||
| Liver | 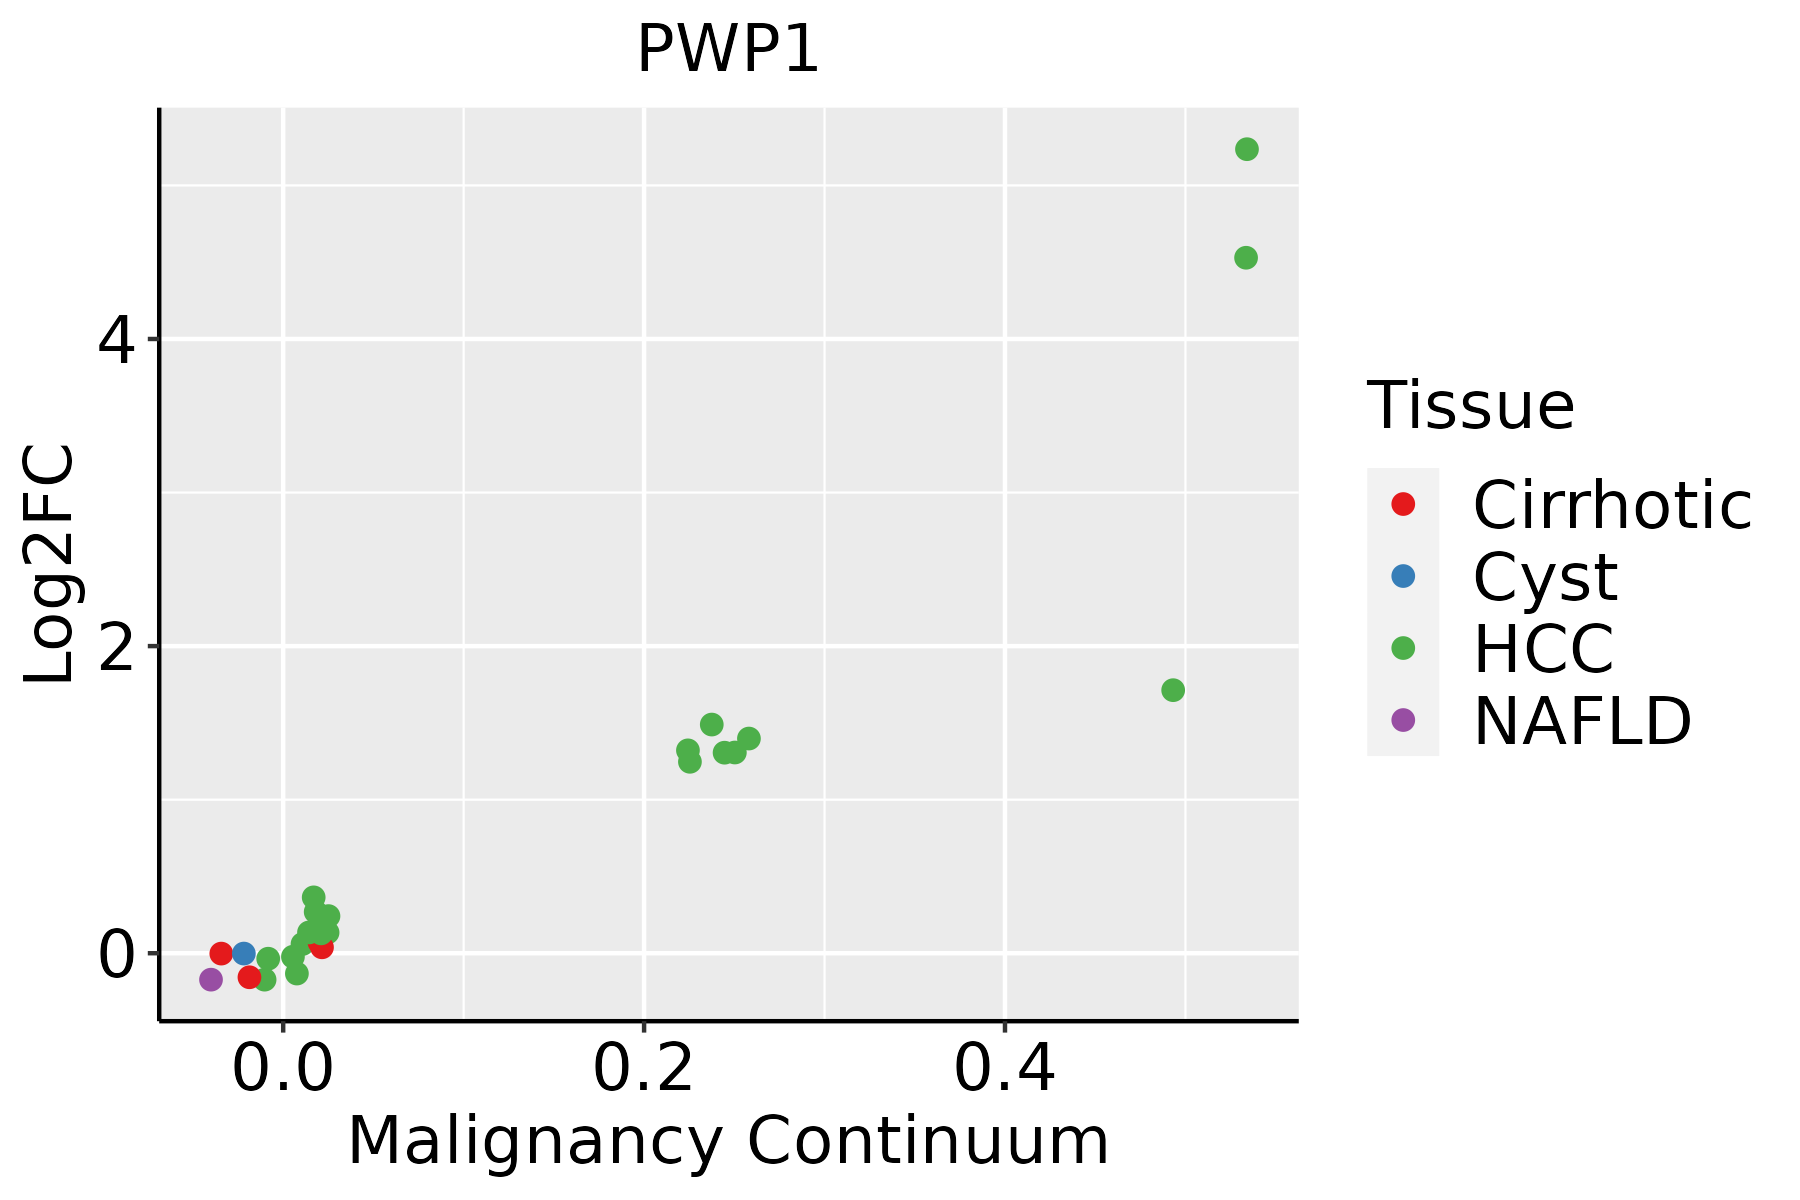 | HCC: Hepatocellular carcinoma |
| NAFLD: Non-alcoholic fatty liver disease | ||
| Oral Cavity |  | EOLP: Erosive Oral lichen planus |
| LP: leukoplakia | ||
| NEOLP: Non-erosive oral lichen planus | ||
| OSCC: Oral squamous cell carcinoma | ||
| Skin | 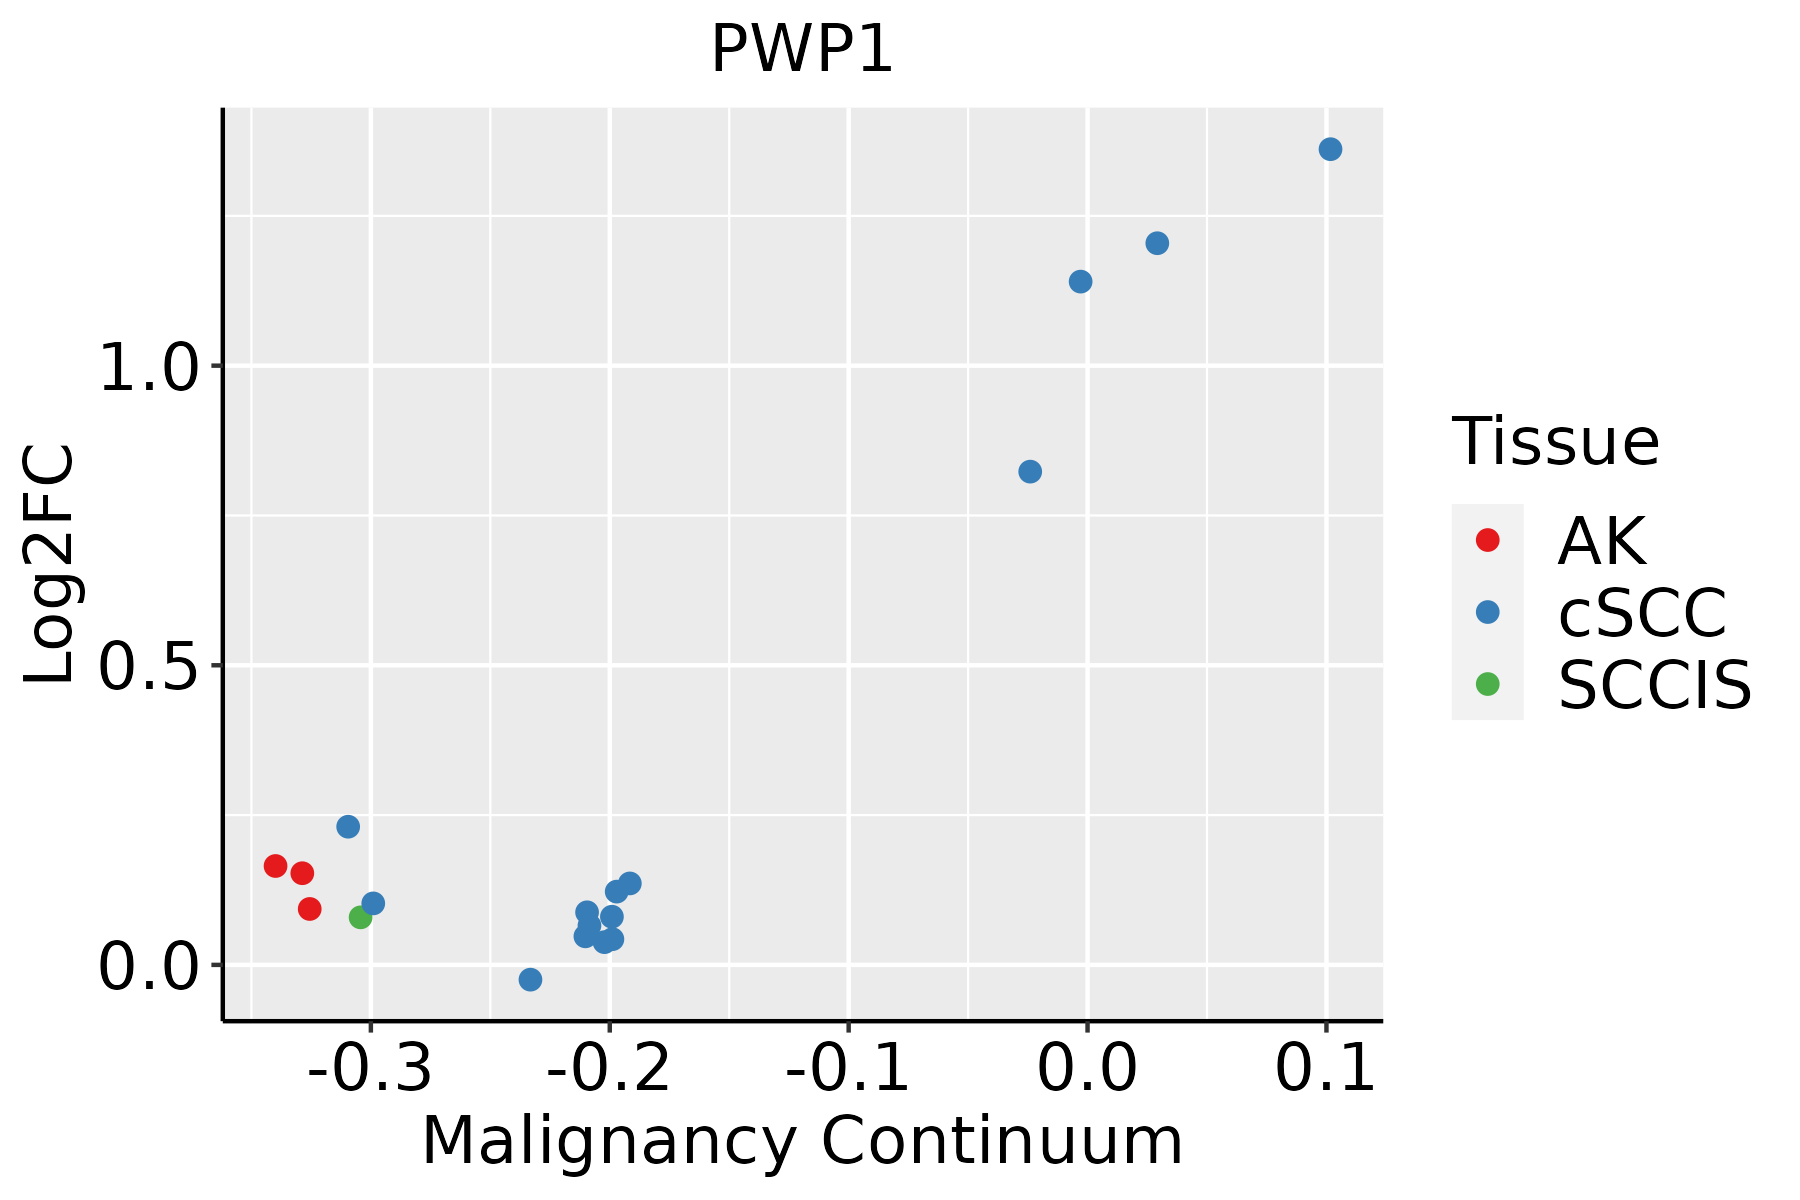 | AK: Actinic keratosis |
| cSCC: Cutaneous squamous cell carcinoma | ||
| SCCIS:squamous cell carcinoma in situ | ||
| Thyroid | 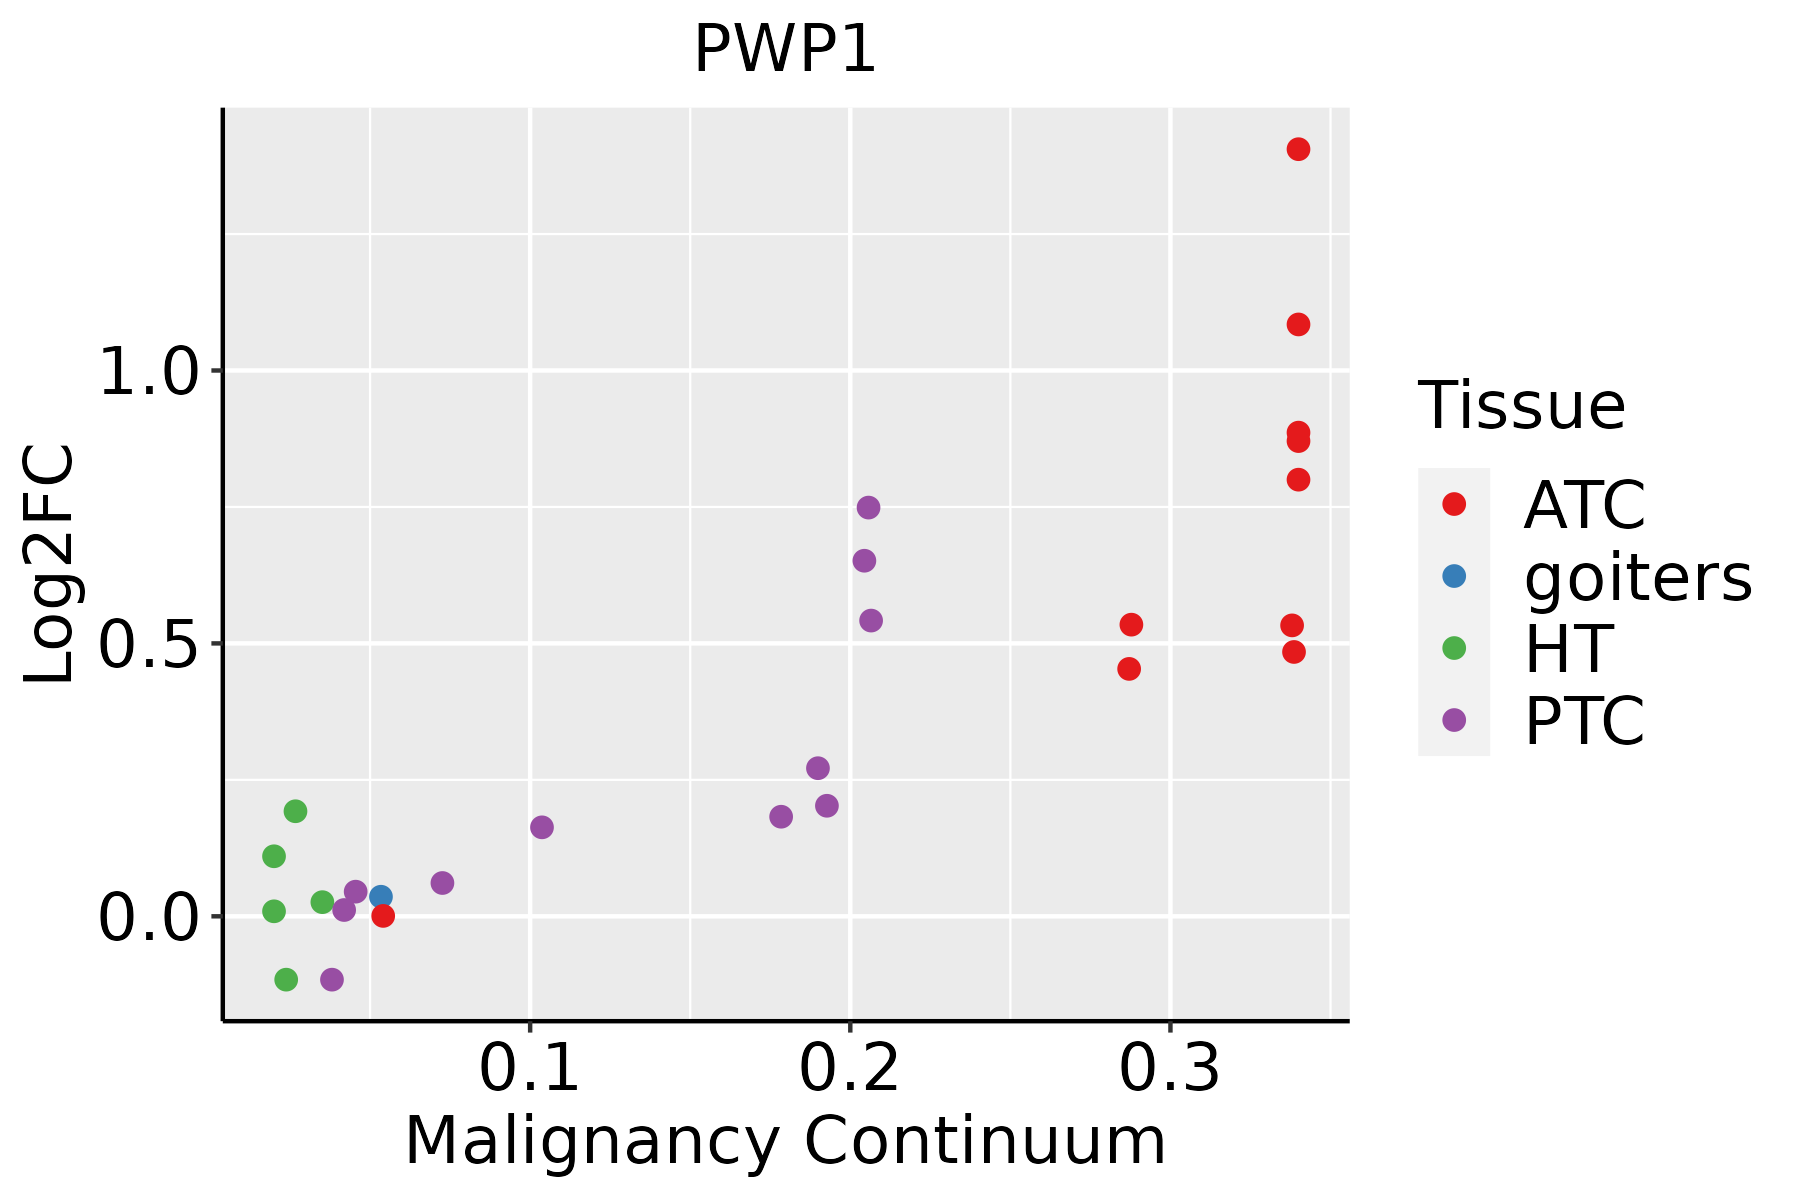 | ATC: Anaplastic thyroid cancer |
| HT: Hashimoto's thyroiditis | ||
| PTC: Papillary thyroid cancer |
| ∗log2FC in expression of this searched gene in stem-like cells from each diseased tissue sample relative to stem-like cells in normal samples in each tissue plotted against the malignancy continuum. Samples are colored based on if they are from different disease stage. |
Top |
Malignant transformation related pathway analysis |
| Find out the enriched GO biological processes and KEGG pathways involved in transition from healthy to precancer to cancer |
| Tissue | Disease Stage | Enriched GO biological Processes |
| Colorectum | AD |  |
| Colorectum | SER |  |
| Colorectum | MSS |  |
| Colorectum | MSI-H |  |
| Colorectum | FAP |  |
| ∗Top 15 enriched GO BP terms are showed in the bar plot of each disease state in each tissue. Each row represents a significant GO biological process which is colored according to the -log10(p.adjust). |
| Page: 1 2 3 4 5 6 7 8 9 |
| GO ID | Tissue | Disease Stage | Description | Gene Ratio | Bg Ratio | pvalue | p.adjust | Count |
| GO:0022613111 | Esophagus | ESCC | ribonucleoprotein complex biogenesis | 365/8552 | 463/18723 | 1.74e-49 | 1.11e-45 | 365 |
| GO:0042254111 | Esophagus | ESCC | ribosome biogenesis | 252/8552 | 299/18723 | 3.27e-44 | 1.04e-40 | 252 |
| GO:003447015 | Esophagus | ESCC | ncRNA processing | 300/8552 | 395/18723 | 3.09e-35 | 3.26e-32 | 300 |
| GO:0016072110 | Esophagus | ESCC | rRNA metabolic process | 197/8552 | 236/18723 | 1.31e-33 | 1.18e-30 | 197 |
| GO:0006364110 | Esophagus | ESCC | rRNA processing | 189/8552 | 225/18723 | 4.88e-33 | 3.87e-30 | 189 |
| GO:003466012 | Esophagus | ESCC | ncRNA metabolic process | 346/8552 | 485/18723 | 4.35e-31 | 2.51e-28 | 346 |
| GO:001657015 | Esophagus | ESCC | histone modification | 323/8552 | 463/18723 | 2.61e-26 | 7.88e-24 | 323 |
| GO:001820514 | Esophagus | ESCC | peptidyl-lysine modification | 259/8552 | 376/18723 | 3.90e-20 | 5.26e-18 | 259 |
| GO:0010563111 | Esophagus | ESCC | negative regulation of phosphorus metabolic process | 274/8552 | 442/18723 | 2.32e-12 | 9.41e-11 | 274 |
| GO:0045936111 | Esophagus | ESCC | negative regulation of phosphate metabolic process | 273/8552 | 441/18723 | 3.18e-12 | 1.25e-10 | 273 |
| GO:0042326111 | Esophagus | ESCC | negative regulation of phosphorylation | 237/8552 | 385/18723 | 1.86e-10 | 5.33e-09 | 237 |
| GO:00434143 | Esophagus | ESCC | macromolecule methylation | 199/8552 | 316/18723 | 3.44e-10 | 9.57e-09 | 199 |
| GO:0001933111 | Esophagus | ESCC | negative regulation of protein phosphorylation | 213/8552 | 342/18723 | 3.54e-10 | 9.76e-09 | 213 |
| GO:00322592 | Esophagus | ESCC | methylation | 222/8552 | 364/18723 | 2.26e-09 | 5.09e-08 | 222 |
| GO:00987812 | Esophagus | ESCC | ncRNA transcription | 45/8552 | 56/18723 | 1.05e-07 | 1.72e-06 | 45 |
| GO:000647914 | Esophagus | ESCC | protein methylation | 115/8552 | 181/18723 | 9.07e-07 | 1.16e-05 | 115 |
| GO:000821314 | Esophagus | ESCC | protein alkylation | 115/8552 | 181/18723 | 9.07e-07 | 1.16e-05 | 115 |
| GO:00182099 | Esophagus | ESCC | peptidyl-serine modification | 196/8552 | 338/18723 | 3.07e-06 | 3.47e-05 | 196 |
| GO:001810515 | Esophagus | ESCC | peptidyl-serine phosphorylation | 184/8552 | 315/18723 | 3.22e-06 | 3.61e-05 | 184 |
| GO:00063602 | Esophagus | ESCC | transcription by RNA polymerase I | 42/8552 | 55/18723 | 3.41e-06 | 3.78e-05 | 42 |
| Page: 1 2 3 4 5 6 7 8 9 10 11 |
| Pathway ID | Tissue | Disease Stage | Description | Gene Ratio | Bg Ratio | pvalue | p.adjust | qvalue | Count |
| Page: 1 |
Top |
Cell-cell communication analysis |
| Identification of potential cell-cell interactions between two cell types and their ligand-receptor pairs for different disease states |
| Ligand | Receptor | LRpair | Pathway | Tissue | Disease Stage |
| Page: 1 |
Top |
Single-cell gene regulatory network inference analysis |
| Find out the significant the regulons (TFs) and the target genes of each regulon across cell types for different disease states |
| TF | Cell Type | Tissue | Disease Stage | Target Gene | RSS | Regulon Activity |
| ∗The dot plots of a searched regulon are shown for all cell subpopulations in each disease state of each tissue based on the regulon specific score inferred using pySCENIC and by calculating the average expression. |
| Page: 1 |
Top |
Somatic mutation of malignant transformation related genes |
| Annotation of somatic variants for genes involved in malignant transformation |
| Hugo Symbol | Variant Class | Variant Classification | dbSNP RS | HGVSc | HGVSp | HGVSp Short | SWISSPROT | BIOTYPE | SIFT | PolyPhen | Tumor Sample Barcode | Tissue | Histology | Sex | Age | Stage | Therapy Types | Drugs | Outcome |
| PWP1 | SNV | Missense_Mutation | rs771006966 | c.1366N>T | p.Arg456Trp | p.R456W | Q13610 | protein_coding | deleterious(0) | probably_damaging(0.965) | TCGA-AC-A3EH-01 | Breast | breast invasive carcinoma | Female | >=65 | III/IV | Unknown | Unknown | SD |
| PWP1 | SNV | Missense_Mutation | novel | c.974C>A | p.Ala325Asp | p.A325D | Q13610 | protein_coding | tolerated(0.06) | benign(0.281) | TCGA-BH-A18V-01 | Breast | breast invasive carcinoma | Female | <65 | I/II | Unknown | Unknown | SD |
| PWP1 | SNV | Missense_Mutation | rs377490385 | c.560N>G | p.Tyr187Cys | p.Y187C | Q13610 | protein_coding | deleterious(0) | probably_damaging(0.94) | TCGA-BH-A1FU-01 | Breast | breast invasive carcinoma | Female | <65 | I/II | Unknown | Unknown | PD |
| PWP1 | SNV | Missense_Mutation | c.611C>T | p.Thr204Ile | p.T204I | Q13610 | protein_coding | tolerated(0.07) | benign(0.007) | TCGA-EW-A1IZ-01 | Breast | breast invasive carcinoma | Female | <65 | III/IV | Chemotherapy | taxotere | SD | |
| PWP1 | SNV | Missense_Mutation | novel | c.542N>G | p.Asp181Gly | p.D181G | Q13610 | protein_coding | deleterious(0.01) | probably_damaging(0.994) | TCGA-2W-A8YY-01 | Cervix | cervical & endocervical cancer | Female | <65 | I/II | Chemotherapy | cisplatin | CR |
| PWP1 | SNV | Missense_Mutation | c.229G>A | p.Glu77Lys | p.E77K | Q13610 | protein_coding | tolerated(0.25) | benign(0.038) | TCGA-C5-A3HE-01 | Cervix | cervical & endocervical cancer | Female | <65 | I/II | Unknown | Unknown | PD | |
| PWP1 | SNV | Missense_Mutation | c.200G>A | p.Arg67His | p.R67H | Q13610 | protein_coding | tolerated(0.14) | benign(0) | TCGA-VS-A94Z-01 | Cervix | cervical & endocervical cancer | Female | <65 | I/II | Chemotherapy | cisplatin | CR | |
| PWP1 | SNV | Missense_Mutation | novel | c.704N>A | p.Gly235Glu | p.G235E | Q13610 | protein_coding | deleterious(0) | probably_damaging(0.997) | TCGA-A6-6780-01 | Colorectum | colon adenocarcinoma | Male | >=65 | I/II | Unknown | Unknown | SD |
| PWP1 | SNV | Missense_Mutation | novel | c.1458N>G | p.Ile486Met | p.I486M | Q13610 | protein_coding | tolerated_low_confidence(0.19) | benign(0.043) | TCGA-AA-3930-01 | Colorectum | colon adenocarcinoma | Male | >=65 | III/IV | Chemotherapy | capecitabine | PD |
| PWP1 | SNV | Missense_Mutation | novel | c.1217N>T | p.Ala406Val | p.A406V | Q13610 | protein_coding | tolerated(0.05) | possibly_damaging(0.735) | TCGA-AA-3950-01 | Colorectum | colon adenocarcinoma | Female | >=65 | I/II | Unknown | Unknown | SD |
| Page: 1 2 3 4 5 6 |
Top |
Related drugs of malignant transformation related genes |
| Identification of chemicals and drugs interact with genes involved in malignant transfromation |
| (DGIdb 4.0) |
| Entrez ID | Symbol | Category | Interaction Types | Drug Claim Name | Drug Name | PMIDs |
| Page: 1 |

Copyright 2023-Present -The University of Texas Health Science Center at Houston |