
|
|||||
|
 | |
| |
| |
| |
| |
| |
|
Gene: PVR |
Gene summary for PVR |
| Gene information | Species | Human | Gene symbol | PVR | Gene ID | 5817 |
| Gene name | PVR cell adhesion molecule | |
| Gene Alias | CD155 | |
| Cytomap | 19q13.31 | |
| Gene Type | protein-coding | GO ID | GO:0001906 | UniProtAcc | P15151 |
Top |
Malignant transformation analysis |
| Identification of the aberrant gene expression in precancerous and cancerous lesions by comparing the gene expression of stem-like cells in diseased tissues with normal stem cells |
| Entrez ID | Symbol | Replicates | Species | Organ | Tissue | Adj P-value | Log2FC | Malignancy |
| 5817 | PVR | LZE7T | Human | Esophagus | ESCC | 2.44e-04 | 2.75e-01 | 0.0667 |
| 5817 | PVR | LZE24T | Human | Esophagus | ESCC | 3.98e-03 | 1.48e-01 | 0.0596 |
| 5817 | PVR | P2T-E | Human | Esophagus | ESCC | 3.33e-14 | 1.33e-01 | 0.1177 |
| 5817 | PVR | P4T-E | Human | Esophagus | ESCC | 3.57e-09 | 1.66e-01 | 0.1323 |
| 5817 | PVR | P5T-E | Human | Esophagus | ESCC | 5.65e-07 | 1.19e-01 | 0.1327 |
| 5817 | PVR | P8T-E | Human | Esophagus | ESCC | 3.75e-21 | 2.87e-01 | 0.0889 |
| 5817 | PVR | P10T-E | Human | Esophagus | ESCC | 2.58e-61 | 1.12e+00 | 0.116 |
| 5817 | PVR | P11T-E | Human | Esophagus | ESCC | 1.63e-07 | 4.22e-01 | 0.1426 |
| 5817 | PVR | P12T-E | Human | Esophagus | ESCC | 5.37e-14 | 1.94e-01 | 0.1122 |
| 5817 | PVR | P15T-E | Human | Esophagus | ESCC | 3.95e-05 | 1.98e-01 | 0.1149 |
| 5817 | PVR | P16T-E | Human | Esophagus | ESCC | 3.99e-09 | 1.24e-01 | 0.1153 |
| 5817 | PVR | P17T-E | Human | Esophagus | ESCC | 2.68e-05 | 2.11e-01 | 0.1278 |
| 5817 | PVR | P19T-E | Human | Esophagus | ESCC | 2.92e-02 | 2.07e-01 | 0.1662 |
| 5817 | PVR | P20T-E | Human | Esophagus | ESCC | 2.99e-08 | 1.65e-01 | 0.1124 |
| 5817 | PVR | P21T-E | Human | Esophagus | ESCC | 4.90e-11 | 1.57e-01 | 0.1617 |
| 5817 | PVR | P22T-E | Human | Esophagus | ESCC | 8.70e-10 | 1.22e-01 | 0.1236 |
| 5817 | PVR | P23T-E | Human | Esophagus | ESCC | 3.77e-11 | 2.47e-01 | 0.108 |
| 5817 | PVR | P24T-E | Human | Esophagus | ESCC | 1.13e-06 | 1.58e-01 | 0.1287 |
| 5817 | PVR | P26T-E | Human | Esophagus | ESCC | 2.87e-15 | 2.67e-01 | 0.1276 |
| 5817 | PVR | P27T-E | Human | Esophagus | ESCC | 4.81e-11 | 1.87e-01 | 0.1055 |
| Page: 1 2 3 4 |
| Tissue | Expression Dynamics | Abbreviation |
| Esophagus | 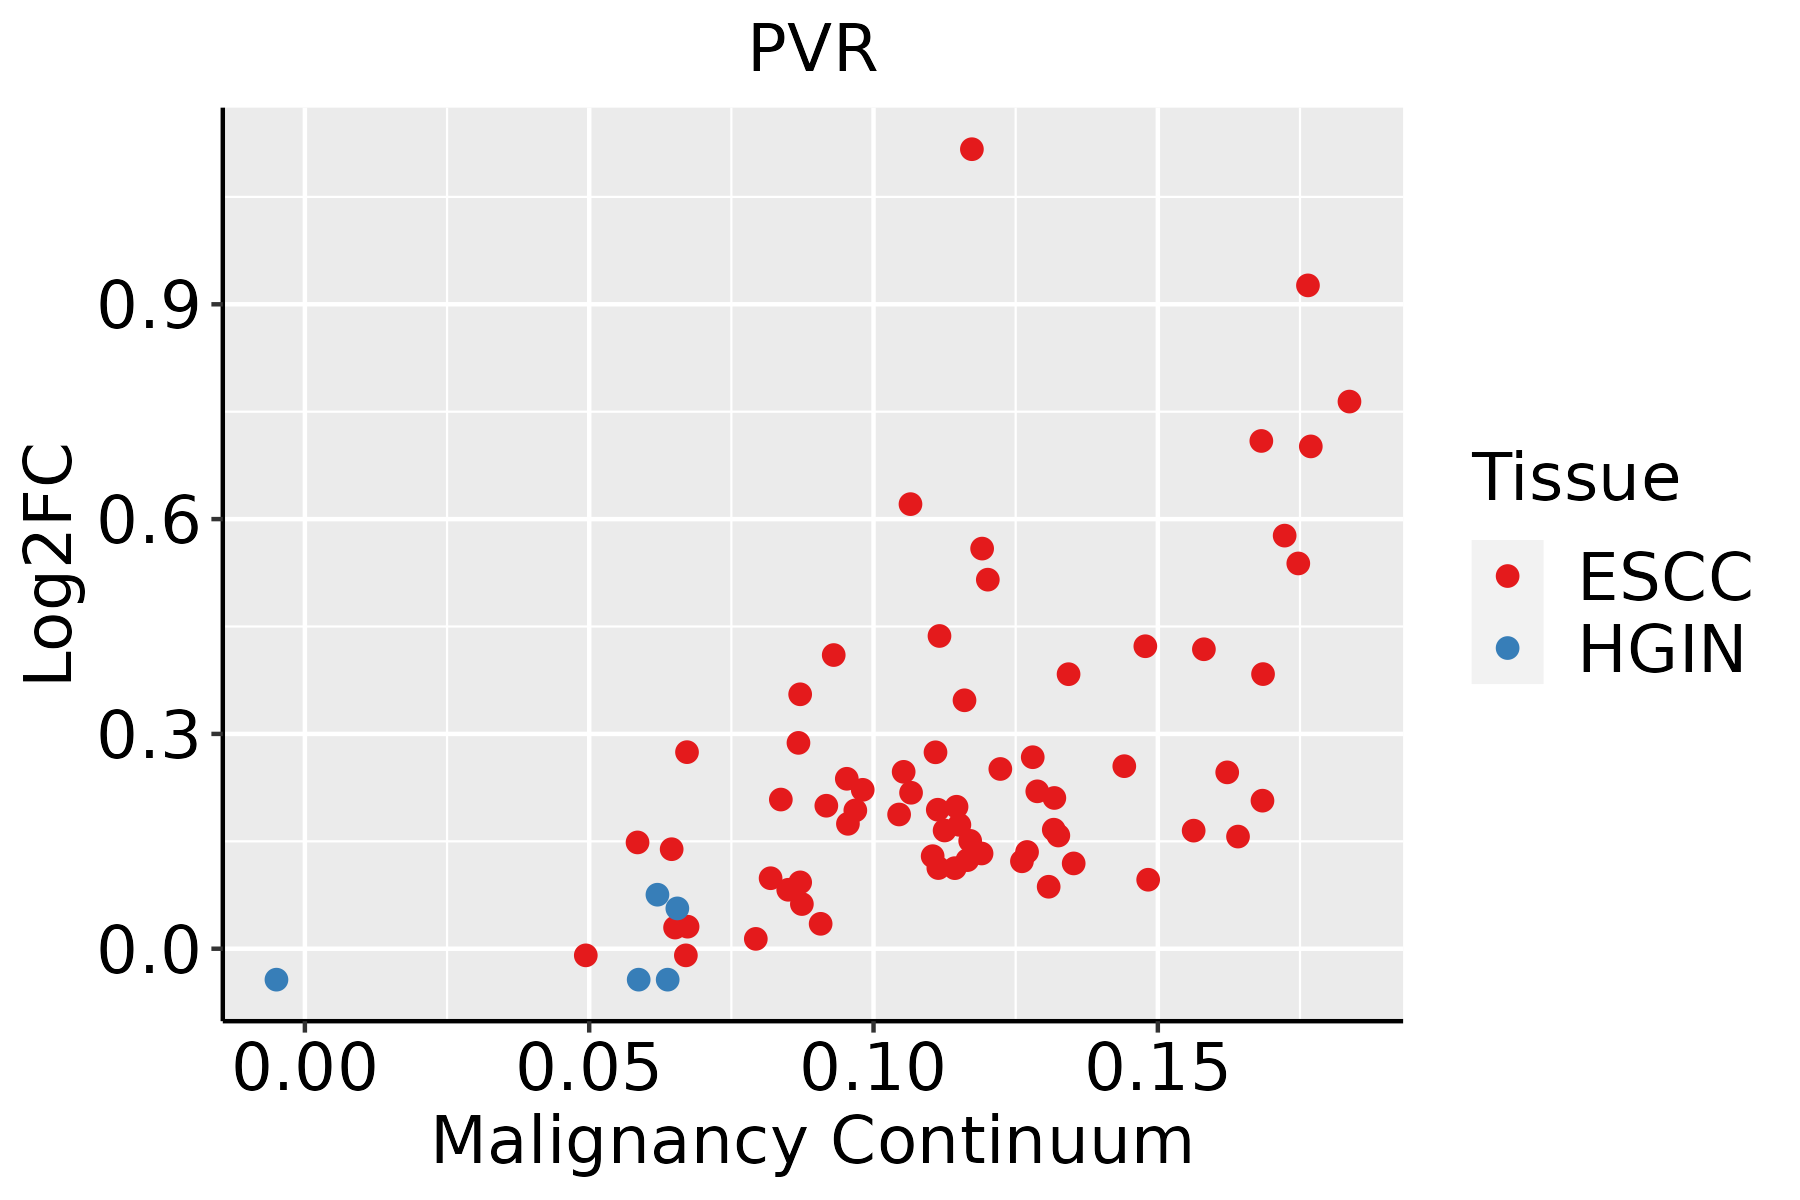 | ESCC: Esophageal squamous cell carcinoma |
| HGIN: High-grade intraepithelial neoplasias | ||
| LGIN: Low-grade intraepithelial neoplasias | ||
| Liver | 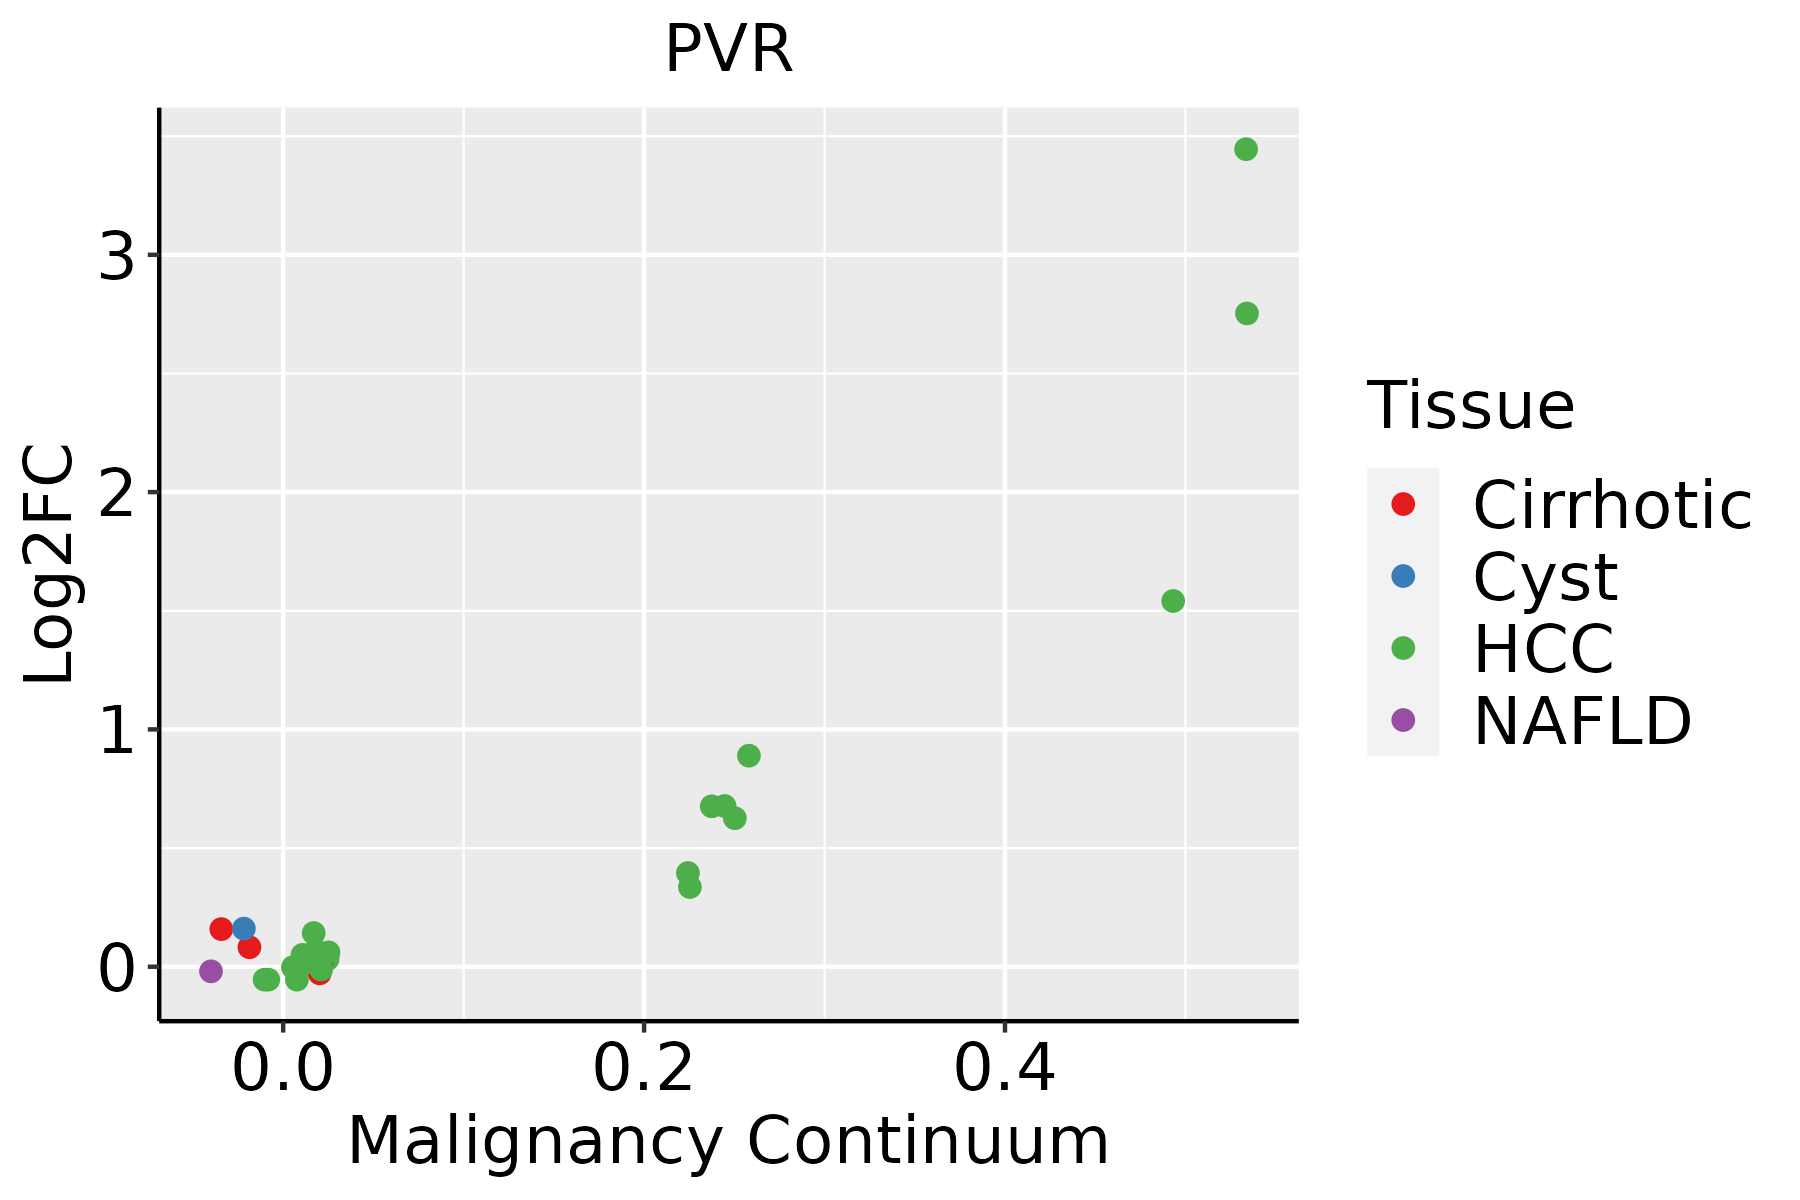 | HCC: Hepatocellular carcinoma |
| NAFLD: Non-alcoholic fatty liver disease | ||
| Oral Cavity |  | EOLP: Erosive Oral lichen planus |
| LP: leukoplakia | ||
| NEOLP: Non-erosive oral lichen planus | ||
| OSCC: Oral squamous cell carcinoma |
| ∗log2FC in expression of this searched gene in stem-like cells from each diseased tissue sample relative to stem-like cells in normal samples in each tissue plotted against the malignancy continuum. Samples are colored based on if they are from different disease stage. |
Top |
Malignant transformation related pathway analysis |
| Find out the enriched GO biological processes and KEGG pathways involved in transition from healthy to precancer to cancer |
| Tissue | Disease Stage | Enriched GO biological Processes |
| Colorectum | AD |  |
| Colorectum | SER |  |
| Colorectum | MSS |  |
| Colorectum | MSI-H |  |
| Colorectum | FAP |  |
| ∗Top 15 enriched GO BP terms are showed in the bar plot of each disease state in each tissue. Each row represents a significant GO biological process which is colored according to the -log10(p.adjust). |
| Page: 1 2 3 4 5 6 7 8 9 |
| GO ID | Tissue | Disease Stage | Description | Gene Ratio | Bg Ratio | pvalue | p.adjust | Count |
| GO:0016032111 | Esophagus | ESCC | viral process | 301/8552 | 415/18723 | 3.34e-29 | 1.32e-26 | 301 |
| GO:0019058111 | Esophagus | ESCC | viral life cycle | 226/8552 | 317/18723 | 1.17e-20 | 1.76e-18 | 226 |
| GO:0044403111 | Esophagus | ESCC | biological process involved in symbiotic interaction | 186/8552 | 290/18723 | 1.43e-10 | 4.16e-09 | 186 |
| GO:0051701111 | Esophagus | ESCC | biological process involved in interaction with host | 135/8552 | 203/18723 | 1.49e-09 | 3.49e-08 | 135 |
| GO:0052126111 | Esophagus | ESCC | movement in host environment | 117/8552 | 175/18723 | 1.14e-08 | 2.26e-07 | 117 |
| GO:00028318 | Esophagus | ESCC | regulation of response to biotic stimulus | 191/8552 | 327/18723 | 2.12e-06 | 2.45e-05 | 191 |
| GO:0044409111 | Esophagus | ESCC | entry into host | 96/8552 | 151/18723 | 6.73e-06 | 6.84e-05 | 96 |
| GO:004671827 | Esophagus | ESCC | viral entry into host cell | 89/8552 | 144/18723 | 6.84e-05 | 5.18e-04 | 89 |
| GO:00450885 | Esophagus | ESCC | regulation of innate immune response | 125/8552 | 218/18723 | 3.34e-04 | 1.96e-03 | 125 |
| GO:001603222 | Liver | HCC | viral process | 286/7958 | 415/18723 | 4.41e-28 | 1.86e-25 | 286 |
| GO:001905822 | Liver | HCC | viral life cycle | 209/7958 | 317/18723 | 2.05e-17 | 2.09e-15 | 209 |
| GO:004440322 | Liver | HCC | biological process involved in symbiotic interaction | 183/7958 | 290/18723 | 9.13e-13 | 4.59e-11 | 183 |
| GO:005170122 | Liver | HCC | biological process involved in interaction with host | 128/7958 | 203/18723 | 2.51e-09 | 6.91e-08 | 128 |
| GO:005212612 | Liver | HCC | movement in host environment | 109/7958 | 175/18723 | 9.58e-08 | 1.89e-06 | 109 |
| GO:004440912 | Liver | HCC | entry into host | 88/7958 | 151/18723 | 6.47e-05 | 5.91e-04 | 88 |
| GO:00028312 | Liver | HCC | regulation of response to biotic stimulus | 173/7958 | 327/18723 | 8.55e-05 | 7.48e-04 | 173 |
| GO:004671812 | Liver | HCC | viral entry into host cell | 83/7958 | 144/18723 | 1.73e-04 | 1.36e-03 | 83 |
| GO:00450881 | Liver | HCC | regulation of innate immune response | 113/7958 | 218/18723 | 3.27e-03 | 1.50e-02 | 113 |
| GO:001603220 | Oral cavity | OSCC | viral process | 274/7305 | 415/18723 | 2.42e-29 | 1.70e-26 | 274 |
| GO:001905820 | Oral cavity | OSCC | viral life cycle | 208/7305 | 317/18723 | 4.59e-22 | 1.00e-19 | 208 |
| Page: 1 2 |
| Pathway ID | Tissue | Disease Stage | Description | Gene Ratio | Bg Ratio | pvalue | p.adjust | qvalue | Count |
| Page: 1 |
Top |
Cell-cell communication analysis |
| Identification of potential cell-cell interactions between two cell types and their ligand-receptor pairs for different disease states |
| Ligand | Receptor | LRpair | Pathway | Tissue | Disease Stage |
| TIGIT | PVR | TIGIT_PVR | TIGIT | Breast | ADJ |
| CD226 | PVR | CD226_PVR | CD226 | Breast | ADJ |
| CD96 | PVR | CD96_PVR | CD96 | Breast | ADJ |
| PVR | CD226 | PVR_CD226 | PVR | Breast | ADJ |
| PVR | TIGIT | PVR_TIGIT | PVR | Breast | ADJ |
| TIGIT | PVR | TIGIT_PVR | TIGIT | Breast | Healthy |
| CD96 | PVR | CD96_PVR | CD96 | Breast | Healthy |
| PVR | TIGIT | PVR_TIGIT | PVR | Breast | Healthy |
| NECTIN3 | PVR | NECTIN3_PVR | NECTIN | CRC | MSI-H |
| CD96 | PVR | CD96_PVR | CD96 | CRC | MSI-H |
| TIGIT | PVR | TIGIT_PVR | TIGIT | CRC | MSI-H |
| CD226 | PVR | CD226_PVR | CD226 | CRC | MSI-H |
| PVR | CD226 | PVR_CD226 | PVR | CRC | MSI-H |
| PVR | TIGIT | PVR_TIGIT | PVR | CRC | MSI-H |
| PVR | TIGIT | PVR_TIGIT | PVR | HNSCC | OSCC |
| TIGIT | PVR | TIGIT_PVR | TIGIT | HNSCC | OSCC |
| CD96 | PVR | CD96_PVR | CD96 | HNSCC | OSCC |
| TIGIT | PVR | TIGIT_PVR | TIGIT | HNSCC | Precancer |
| CD96 | PVR | CD96_PVR | CD96 | HNSCC | Precancer |
| PVR | CD226 | PVR_CD226 | PVR | HNSCC | Precancer |
| Page: 1 |
Top |
Single-cell gene regulatory network inference analysis |
| Find out the significant the regulons (TFs) and the target genes of each regulon across cell types for different disease states |
| TF | Cell Type | Tissue | Disease Stage | Target Gene | RSS | Regulon Activity |
| ∗The dot plots of a searched regulon are shown for all cell subpopulations in each disease state of each tissue based on the regulon specific score inferred using pySCENIC and by calculating the average expression. |
| Page: 1 |
Top |
Somatic mutation of malignant transformation related genes |
| Annotation of somatic variants for genes involved in malignant transformation |
| Hugo Symbol | Variant Class | Variant Classification | dbSNP RS | HGVSc | HGVSp | HGVSp Short | SWISSPROT | BIOTYPE | SIFT | PolyPhen | Tumor Sample Barcode | Tissue | Histology | Sex | Age | Stage | Therapy Types | Drugs | Outcome |
| PVR | SNV | Missense_Mutation | novel | c.970N>A | p.Glu324Lys | p.E324K | protein_coding | deleterious(0.03) | possibly_damaging(0.716) | TCGA-A8-A09X-01 | Breast | breast invasive carcinoma | Female | <65 | III/IV | Unknown | Unknown | SD | |
| PVR | SNV | Missense_Mutation | c.1095N>A | p.Phe365Leu | p.F365L | protein_coding | tolerated(0.35) | benign(0.214) | TCGA-AN-A046-01 | Breast | breast invasive carcinoma | Female | >=65 | I/II | Unknown | Unknown | SD | ||
| PVR | SNV | Missense_Mutation | c.1095C>G | p.Phe365Leu | p.F365L | protein_coding | tolerated(0.35) | benign(0.214) | TCGA-C5-A7X5-01 | Cervix | cervical & endocervical cancer | Female | >=65 | I/II | Chemotherapy | carboplatin | PD | ||
| PVR | SNV | Missense_Mutation | c.1144N>T | p.Pro382Ser | p.P382S | protein_coding | tolerated(0.91) | benign(0.013) | TCGA-DG-A2KK-01 | Cervix | cervical & endocervical cancer | Female | <65 | III/IV | Chemotherapy | cisplatin | SD | ||
| PVR | SNV | Missense_Mutation | c.1243G>T | p.Gly415Cys | p.G415C | protein_coding | deleterious(0.01) | probably_damaging(0.979) | TCGA-AA-3811-01 | Colorectum | colon adenocarcinoma | Female | >=65 | III/IV | Unknown | Unknown | PD | ||
| PVR | SNV | Missense_Mutation | rs777036330 | c.1025N>A | p.Arg342His | p.R342H | protein_coding | tolerated(0.54) | benign(0.346) | TCGA-DY-A1DG-01 | Colorectum | rectum adenocarcinoma | Male | >=65 | I/II | Unknown | Unknown | PD | |
| PVR | SNV | Missense_Mutation | novel | c.281N>C | p.Phe94Ser | p.F94S | protein_coding | deleterious(0) | probably_damaging(0.998) | TCGA-A5-A1OF-01 | Endometrium | uterine corpus endometrioid carcinoma | Female | <65 | I/II | Unknown | Unknown | SD | |
| PVR | SNV | Missense_Mutation | rs556820109 | c.302C>T | p.Ala101Val | p.A101V | protein_coding | tolerated(0.24) | benign(0.242) | TCGA-AP-A0LM-01 | Endometrium | uterine corpus endometrioid carcinoma | Female | <65 | III/IV | Chemotherapy | cisplatin | SD | |
| PVR | SNV | Missense_Mutation | novel | c.940G>A | p.Val314Ile | p.V314I | protein_coding | deleterious(0.01) | possibly_damaging(0.769) | TCGA-AP-A1DK-01 | Endometrium | uterine corpus endometrioid carcinoma | Female | <65 | I/II | Unknown | Unknown | SD | |
| PVR | SNV | Missense_Mutation | rs777413448 | c.962G>A | p.Arg321His | p.R321H | protein_coding | deleterious(0.03) | probably_damaging(0.949) | TCGA-B5-A11E-01 | Endometrium | uterine corpus endometrioid carcinoma | Female | <65 | I/II | Unknown | Unknown | SD |
| Page: 1 2 |
Top |
Related drugs of malignant transformation related genes |
| Identification of chemicals and drugs interact with genes involved in malignant transfromation |
| (DGIdb 4.0) |
| Entrez ID | Symbol | Category | Interaction Types | Drug Claim Name | Drug Name | PMIDs |
| Page: 1 |

Copyright 2023-Present -The University of Texas Health Science Center at Houston |