
|
|||||
|
 | |
| |
| |
| |
| |
| |
|
Gene: PUS7L |
Gene summary for PUS7L |
| Gene information | Species | Human | Gene symbol | PUS7L | Gene ID | 83448 |
| Gene name | pseudouridine synthase 7 like | |
| Gene Alias | PUS7L | |
| Cytomap | 12q12 | |
| Gene Type | protein-coding | GO ID | GO:0001522 | UniProtAcc | Q9H0K6 |
Top |
Malignant transformation analysis |
| Identification of the aberrant gene expression in precancerous and cancerous lesions by comparing the gene expression of stem-like cells in diseased tissues with normal stem cells |
| Entrez ID | Symbol | Replicates | Species | Organ | Tissue | Adj P-value | Log2FC | Malignancy |
| 83448 | PUS7L | LZE4T | Human | Esophagus | ESCC | 1.53e-05 | 1.72e-01 | 0.0811 |
| 83448 | PUS7L | LZE7T | Human | Esophagus | ESCC | 4.53e-09 | 4.50e-01 | 0.0667 |
| 83448 | PUS7L | LZE22D1 | Human | Esophagus | HGIN | 4.64e-05 | 2.33e-01 | 0.0595 |
| 83448 | PUS7L | LZE24T | Human | Esophagus | ESCC | 3.18e-15 | 2.51e-01 | 0.0596 |
| 83448 | PUS7L | P1T-E | Human | Esophagus | ESCC | 1.81e-06 | 3.90e-01 | 0.0875 |
| 83448 | PUS7L | P2T-E | Human | Esophagus | ESCC | 4.22e-36 | 7.30e-01 | 0.1177 |
| 83448 | PUS7L | P4T-E | Human | Esophagus | ESCC | 2.45e-40 | 9.21e-01 | 0.1323 |
| 83448 | PUS7L | P5T-E | Human | Esophagus | ESCC | 1.85e-15 | 2.87e-01 | 0.1327 |
| 83448 | PUS7L | P8T-E | Human | Esophagus | ESCC | 1.75e-23 | 2.52e-01 | 0.0889 |
| 83448 | PUS7L | P9T-E | Human | Esophagus | ESCC | 3.56e-05 | 1.15e-01 | 0.1131 |
| 83448 | PUS7L | P10T-E | Human | Esophagus | ESCC | 3.09e-17 | 3.30e-01 | 0.116 |
| 83448 | PUS7L | P11T-E | Human | Esophagus | ESCC | 5.37e-04 | 1.67e-01 | 0.1426 |
| 83448 | PUS7L | P12T-E | Human | Esophagus | ESCC | 5.59e-15 | 2.09e-01 | 0.1122 |
| 83448 | PUS7L | P15T-E | Human | Esophagus | ESCC | 1.43e-03 | 1.62e-01 | 0.1149 |
| 83448 | PUS7L | P16T-E | Human | Esophagus | ESCC | 6.39e-18 | 3.16e-01 | 0.1153 |
| 83448 | PUS7L | P17T-E | Human | Esophagus | ESCC | 2.73e-10 | 3.18e-01 | 0.1278 |
| 83448 | PUS7L | P20T-E | Human | Esophagus | ESCC | 1.12e-18 | 3.81e-01 | 0.1124 |
| 83448 | PUS7L | P21T-E | Human | Esophagus | ESCC | 3.85e-19 | 3.84e-01 | 0.1617 |
| 83448 | PUS7L | P22T-E | Human | Esophagus | ESCC | 3.86e-11 | 1.69e-01 | 0.1236 |
| 83448 | PUS7L | P23T-E | Human | Esophagus | ESCC | 5.46e-09 | 1.87e-01 | 0.108 |
| Page: 1 2 3 4 5 |
| Tissue | Expression Dynamics | Abbreviation |
| Esophagus |  | ESCC: Esophageal squamous cell carcinoma |
| HGIN: High-grade intraepithelial neoplasias | ||
| LGIN: Low-grade intraepithelial neoplasias | ||
| Oral Cavity | 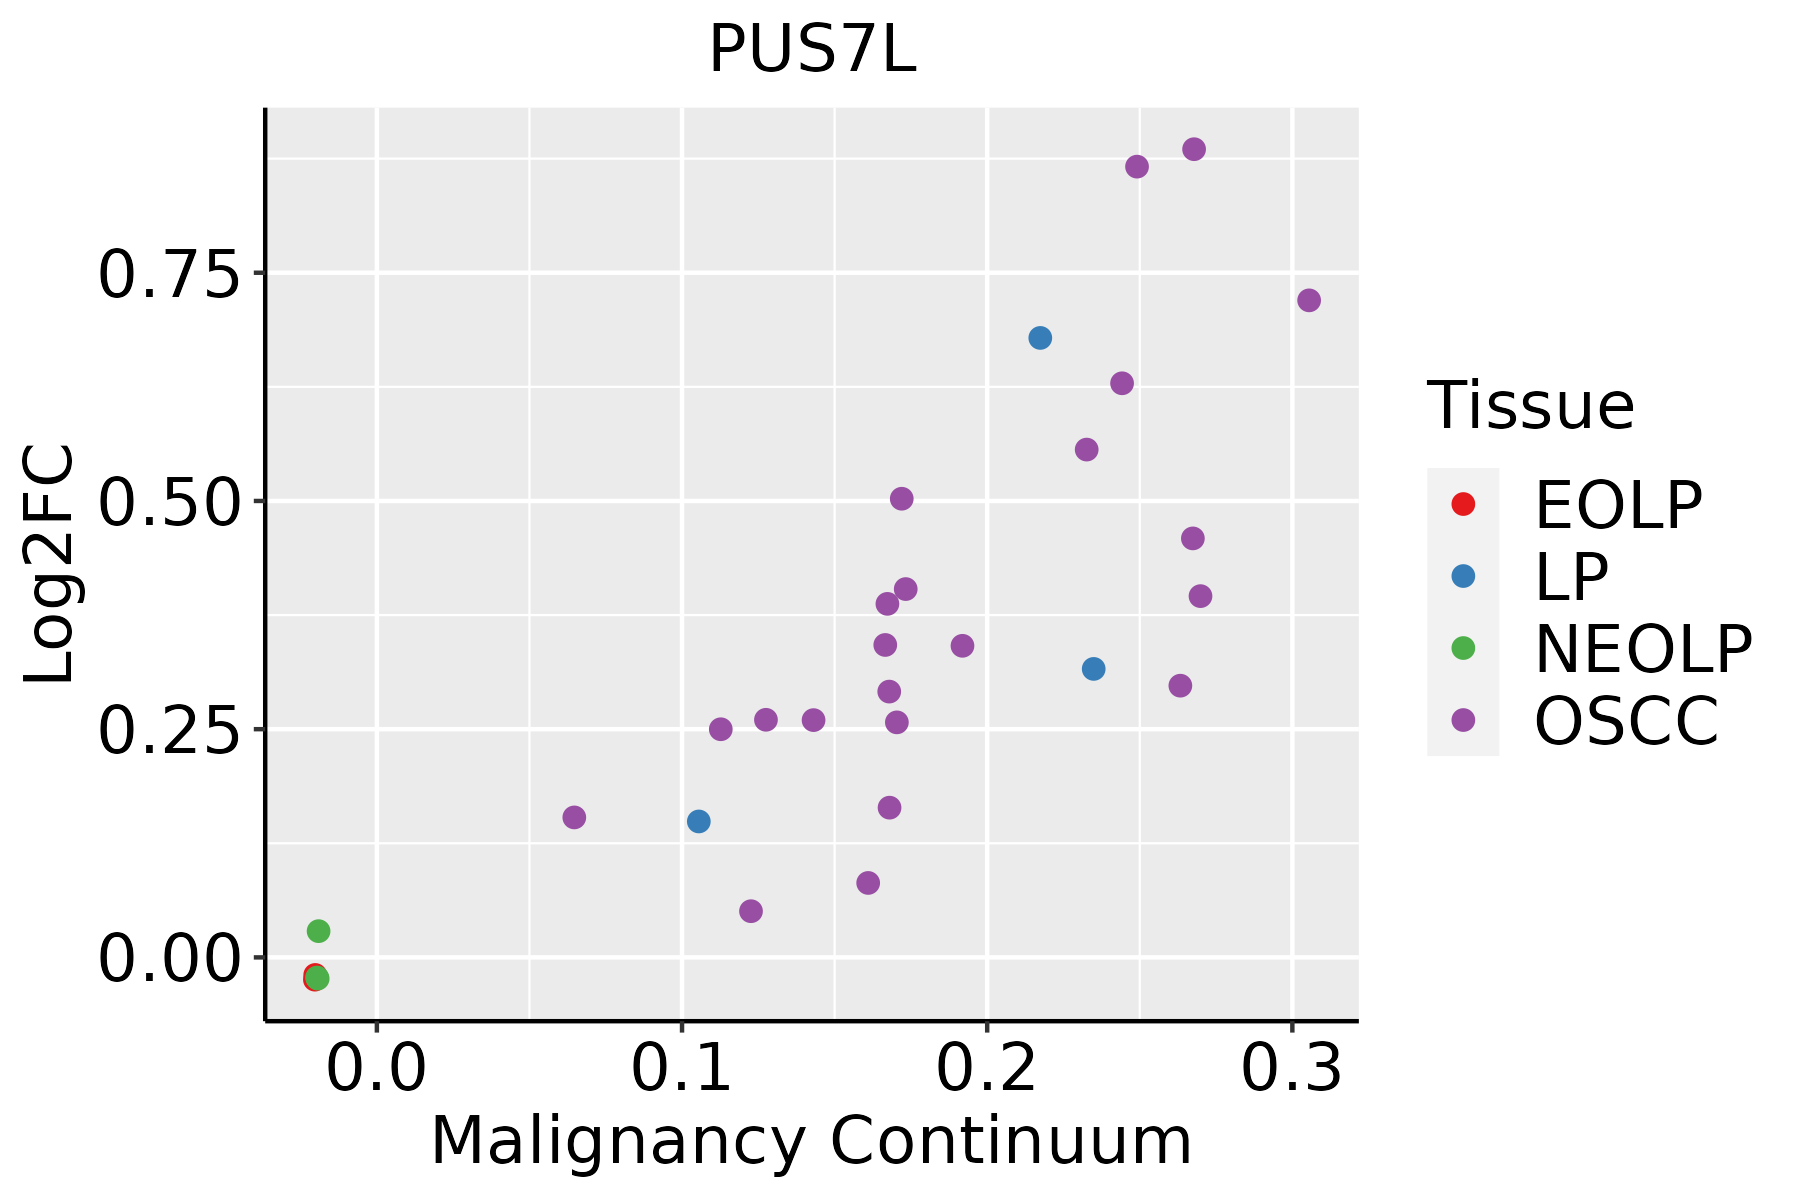 | EOLP: Erosive Oral lichen planus |
| LP: leukoplakia | ||
| NEOLP: Non-erosive oral lichen planus | ||
| OSCC: Oral squamous cell carcinoma | ||
| Skin |  | AK: Actinic keratosis |
| cSCC: Cutaneous squamous cell carcinoma | ||
| SCCIS:squamous cell carcinoma in situ | ||
| Thyroid | 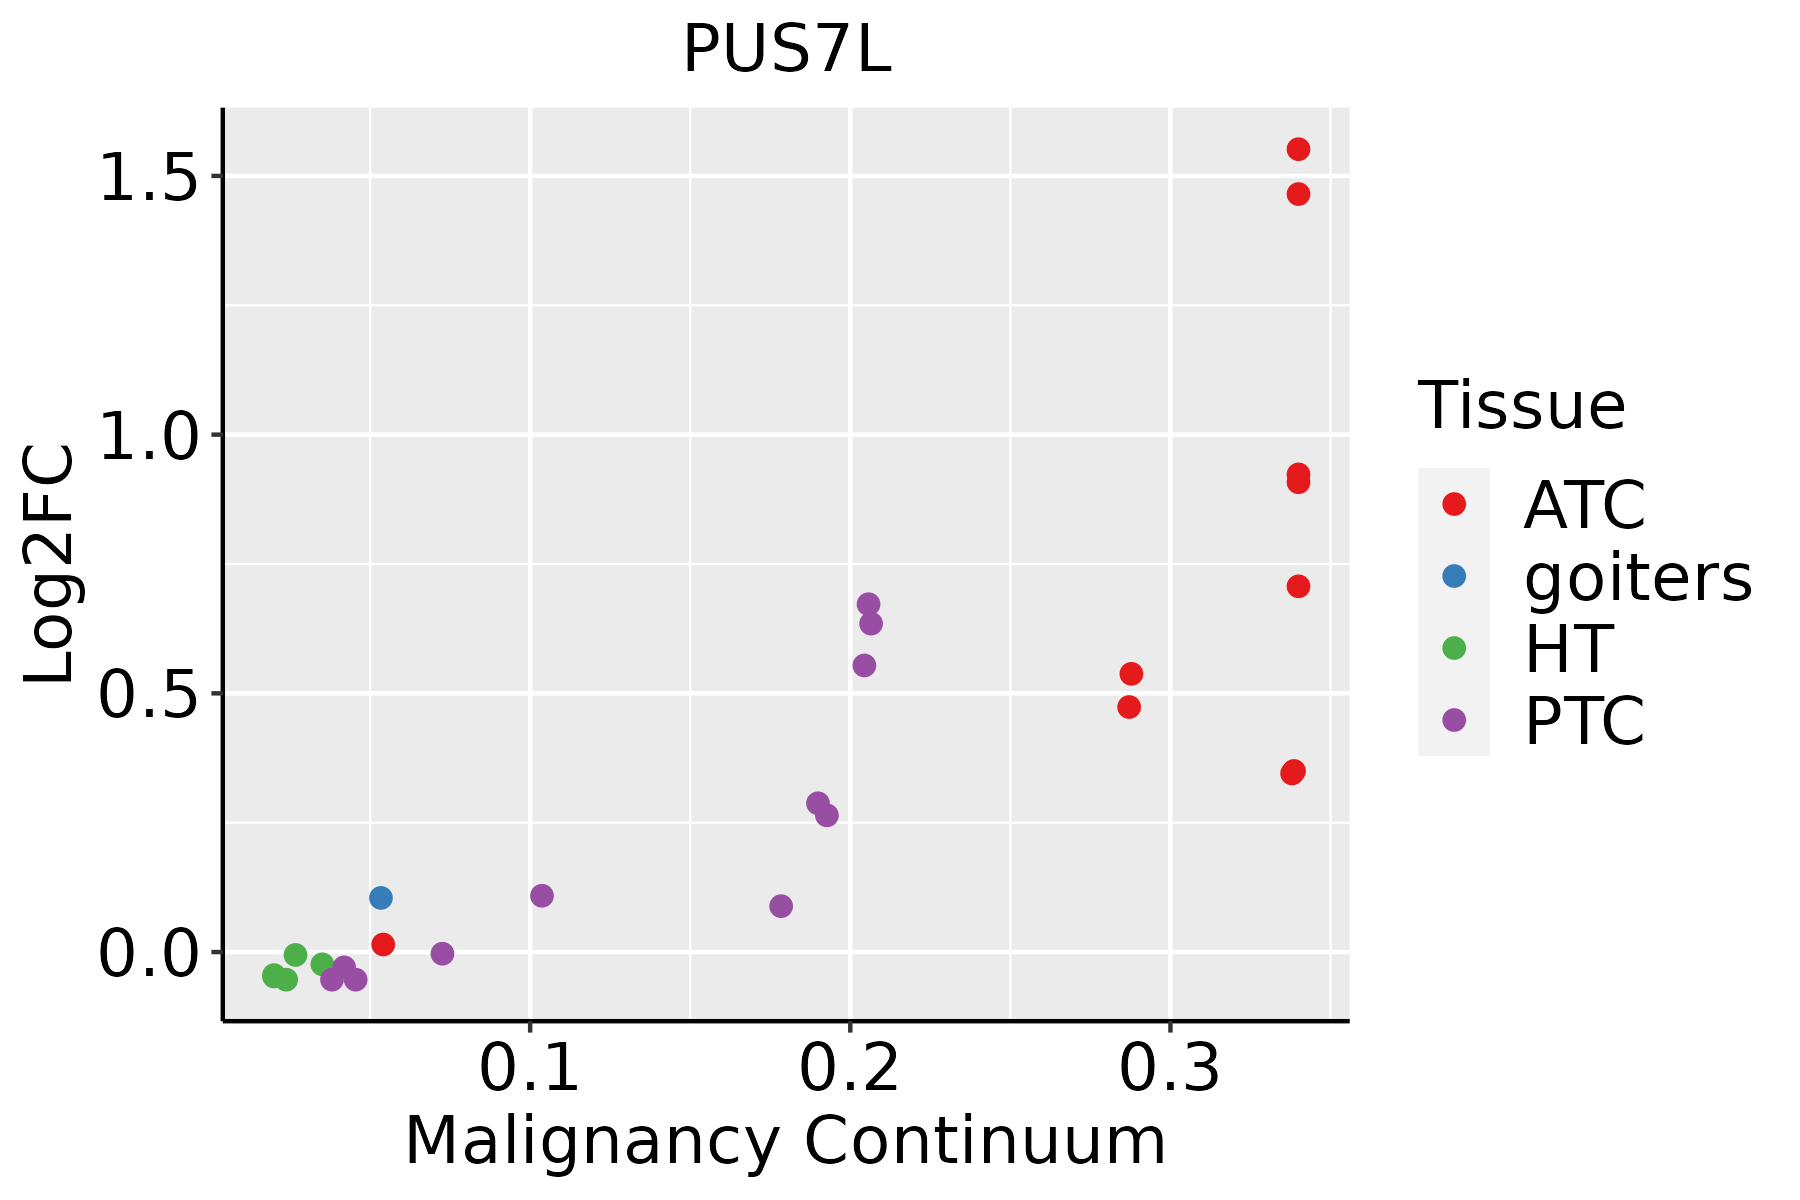 | ATC: Anaplastic thyroid cancer |
| HT: Hashimoto's thyroiditis | ||
| PTC: Papillary thyroid cancer |
| ∗log2FC in expression of this searched gene in stem-like cells from each diseased tissue sample relative to stem-like cells in normal samples in each tissue plotted against the malignancy continuum. Samples are colored based on if they are from different disease stage. |
Top |
Malignant transformation related pathway analysis |
| Find out the enriched GO biological processes and KEGG pathways involved in transition from healthy to precancer to cancer |
| Tissue | Disease Stage | Enriched GO biological Processes |
| Colorectum | AD |  |
| Colorectum | SER |  |
| Colorectum | MSS |  |
| Colorectum | MSI-H |  |
| Colorectum | FAP |  |
| ∗Top 15 enriched GO BP terms are showed in the bar plot of each disease state in each tissue. Each row represents a significant GO biological process which is colored according to the -log10(p.adjust). |
| Page: 1 2 3 4 5 6 7 8 9 |
| GO ID | Tissue | Disease Stage | Description | Gene Ratio | Bg Ratio | pvalue | p.adjust | Count |
| GO:00094512 | Esophagus | ESCC | RNA modification | 114/8552 | 167/18723 | 2.76e-09 | 6.04e-08 | 114 |
| GO:00015221 | Esophagus | ESCC | pseudouridine synthesis | 16/8552 | 18/18723 | 1.78e-04 | 1.15e-03 | 16 |
| GO:00094511 | Oral cavity | OSCC | RNA modification | 95/7305 | 167/18723 | 2.05e-06 | 2.62e-05 | 95 |
| GO:0001522 | Oral cavity | OSCC | pseudouridine synthesis | 13/7305 | 18/18723 | 4.45e-03 | 1.79e-02 | 13 |
| GO:00015222 | Skin | cSCC | pseudouridine synthesis | 11/4864 | 18/18723 | 1.74e-03 | 1.06e-02 | 11 |
| GO:00094513 | Skin | cSCC | RNA modification | 58/4864 | 167/18723 | 7.33e-03 | 3.47e-02 | 58 |
| Page: 1 |
| Pathway ID | Tissue | Disease Stage | Description | Gene Ratio | Bg Ratio | pvalue | p.adjust | qvalue | Count |
| Page: 1 |
Top |
Cell-cell communication analysis |
| Identification of potential cell-cell interactions between two cell types and their ligand-receptor pairs for different disease states |
| Ligand | Receptor | LRpair | Pathway | Tissue | Disease Stage |
| Page: 1 |
Top |
Single-cell gene regulatory network inference analysis |
| Find out the significant the regulons (TFs) and the target genes of each regulon across cell types for different disease states |
| TF | Cell Type | Tissue | Disease Stage | Target Gene | RSS | Regulon Activity |
| ∗The dot plots of a searched regulon are shown for all cell subpopulations in each disease state of each tissue based on the regulon specific score inferred using pySCENIC and by calculating the average expression. |
| Page: 1 |
Top |
Somatic mutation of malignant transformation related genes |
| Annotation of somatic variants for genes involved in malignant transformation |
| Hugo Symbol | Variant Class | Variant Classification | dbSNP RS | HGVSc | HGVSp | HGVSp Short | SWISSPROT | BIOTYPE | SIFT | PolyPhen | Tumor Sample Barcode | Tissue | Histology | Sex | Age | Stage | Therapy Types | Drugs | Outcome |
| PUS7L | SNV | Missense_Mutation | c.475N>G | p.Pro159Ala | p.P159A | Q9H0K6 | protein_coding | tolerated(0.21) | benign(0.006) | TCGA-AC-A23H-01 | Breast | breast invasive carcinoma | Female | >=65 | I/II | Unknown | Unknown | PD | |
| PUS7L | SNV | Missense_Mutation | c.1570C>T | p.His524Tyr | p.H524Y | Q9H0K6 | protein_coding | deleterious(0.02) | possibly_damaging(0.687) | TCGA-AR-A1AT-01 | Breast | breast invasive carcinoma | Female | <65 | I/II | Hormone Therapy | anastrozole | SD | |
| PUS7L | SNV | Missense_Mutation | c.919N>A | p.Leu307Ile | p.L307I | Q9H0K6 | protein_coding | deleterious(0) | probably_damaging(0.999) | TCGA-A6-5661-01 | Colorectum | colon adenocarcinoma | Female | >=65 | I/II | Unknown | Unknown | SD | |
| PUS7L | SNV | Missense_Mutation | c.727N>C | p.Lys243Gln | p.K243Q | Q9H0K6 | protein_coding | deleterious(0.03) | benign(0.03) | TCGA-AA-3510-01 | Colorectum | colon adenocarcinoma | Male | >=65 | I/II | Unknown | Unknown | SD | |
| PUS7L | SNV | Missense_Mutation | c.1235N>T | p.Arg412Ile | p.R412I | Q9H0K6 | protein_coding | deleterious(0.04) | benign(0.397) | TCGA-AA-A010-01 | Colorectum | colon adenocarcinoma | Female | <65 | I/II | Chemotherapy | folinic | CR | |
| PUS7L | SNV | Missense_Mutation | rs764033502 | c.970N>G | p.Lys324Glu | p.K324E | Q9H0K6 | protein_coding | tolerated(1) | benign(0.007) | TCGA-AA-A010-01 | Colorectum | colon adenocarcinoma | Female | <65 | I/II | Chemotherapy | folinic | CR |
| PUS7L | SNV | Missense_Mutation | c.211C>G | p.Pro71Ala | p.P71A | Q9H0K6 | protein_coding | tolerated(0.32) | benign(0) | TCGA-AA-A02Y-01 | Colorectum | colon adenocarcinoma | Male | >=65 | I/II | Unknown | Unknown | SD | |
| PUS7L | SNV | Missense_Mutation | c.919N>A | p.Leu307Ile | p.L307I | Q9H0K6 | protein_coding | deleterious(0) | probably_damaging(0.999) | TCGA-AZ-4615-01 | Colorectum | colon adenocarcinoma | Male | >=65 | III/IV | Chemotherapy | xeloda | PD | |
| PUS7L | SNV | Missense_Mutation | novel | c.1110N>T | p.Met370Ile | p.M370I | Q9H0K6 | protein_coding | tolerated(0.1) | benign(0.145) | TCGA-CA-6717-01 | Colorectum | colon adenocarcinoma | Male | <65 | I/II | Chemotherapy | oxaliplatin | CR |
| PUS7L | SNV | Missense_Mutation | novel | c.780N>C | p.Lys260Asn | p.K260N | Q9H0K6 | protein_coding | deleterious(0) | possibly_damaging(0.902) | TCGA-CA-6717-01 | Colorectum | colon adenocarcinoma | Male | <65 | I/II | Chemotherapy | oxaliplatin | CR |
| Page: 1 2 3 4 5 6 7 8 |
Top |
Related drugs of malignant transformation related genes |
| Identification of chemicals and drugs interact with genes involved in malignant transfromation |
| (DGIdb 4.0) |
| Entrez ID | Symbol | Category | Interaction Types | Drug Claim Name | Drug Name | PMIDs |
| Page: 1 |

Copyright 2023-Present -The University of Texas Health Science Center at Houston |