Schematic overview of the cellular and molecular mechanisms involved in the cancer progression, including the proposed cellular and molecular mechanisms in cancer cells trajectory. AT1: alveolar type 1 cells; AT2: alveolar type 2 cells; AAH: atypical adenomatous hyperplasia; AIS: adenocarcinoma in situ; MIA: minimally invasive adenocarcinoma; IA: invasive adenocarcinoma; EMT: epithelial-mesenchymal transition

Home

Download

Statistics

Help

Contact

Center for Computational Systems Medicine
leaf

Gene summary

leaf

Malignant transformation analysis

leaf

Malignant transformation related pathway analysis

leaf

Cell-cell communication analysis

leaf

Single-cell gene regulatory network inference analysis

leaf

Somatic mutation of malignant transformation related genes

leaf

Related drugs of malignant transformation related genes

Gene: PUS7

Gene summary for PUS7

check button Gene summary.

Gene informationSpeciesHuman
Gene symbol

PUS7

Gene ID

54517

Gene namepseudouridine synthase 7
Gene AliasIDDABS
Cytomap7q22.3
Gene Typeprotein-coding
GO ID

GO:0001522

UniProtAcc

B3KY42


Top

Malignant transformation analysis

check button Identification of the aberrant gene expression in precancerous and cancerous lesions by comparing the gene expression of stem-like cells in diseased tissues with normal stem cells
check button Malignant transformation involving gene list.
Entrez IDSymbolReplicatesSpeciesOrganTissueAdj P-valueLog2FCMalignancy
54517PUS7CCI_2HumanCervixCC1.17e-086.56e-010.5249
54517PUS7CCI_3HumanCervixCC1.82e-125.89e-010.516
54517PUS7LZE4THumanEsophagusESCC8.42e-081.75e-010.0811
54517PUS7LZE7THumanEsophagusESCC3.45e-063.36e-010.0667
54517PUS7LZE24THumanEsophagusESCC5.77e-041.51e-010.0596
54517PUS7P2T-EHumanEsophagusESCC1.57e-111.72e-010.1177
54517PUS7P4T-EHumanEsophagusESCC4.37e-103.62e-010.1323
54517PUS7P5T-EHumanEsophagusESCC2.77e-172.86e-010.1327
54517PUS7P9T-EHumanEsophagusESCC3.37e-093.31e-010.1131
54517PUS7P10T-EHumanEsophagusESCC1.62e-132.26e-010.116
54517PUS7P11T-EHumanEsophagusESCC2.33e-084.79e-010.1426
54517PUS7P12T-EHumanEsophagusESCC1.87e-285.02e-010.1122
54517PUS7P15T-EHumanEsophagusESCC6.89e-205.86e-010.1149
54517PUS7P16T-EHumanEsophagusESCC5.13e-316.06e-010.1153
54517PUS7P17T-EHumanEsophagusESCC2.28e-105.12e-010.1278
54517PUS7P19T-EHumanEsophagusESCC1.85e-034.43e-010.1662
54517PUS7P20T-EHumanEsophagusESCC1.06e-349.31e-010.1124
54517PUS7P21T-EHumanEsophagusESCC7.32e-386.83e-010.1617
54517PUS7P22T-EHumanEsophagusESCC1.92e-163.17e-010.1236
54517PUS7P23T-EHumanEsophagusESCC3.52e-389.85e-010.108
Page: 1 2 3 4 5 

check button Transcriptomic changes along malignancy continuum.
TissueExpression DynamicsAbbreviation
CervixThe image shows the transcriptomic changes along malignancy continuum.log2FC in expression of this searched gene in stem-like cells from each diseased tissue sample relative to stem-like cells in normal samples in each tissue plotted against the malignancy continuum. Samples are colored based on if they are from different disease stage.CC: Cervix cancer
HSIL_HPV: HPV-infected high-grade squamous intraepithelial lesions
N_HPV: HPV-infected normal cervix
EsophagusThe image shows the transcriptomic changes along malignancy continuum.log2FC in expression of this searched gene in stem-like cells from each diseased tissue sample relative to stem-like cells in normal samples in each tissue plotted against the malignancy continuum. Samples are colored based on if they are from different disease stage.
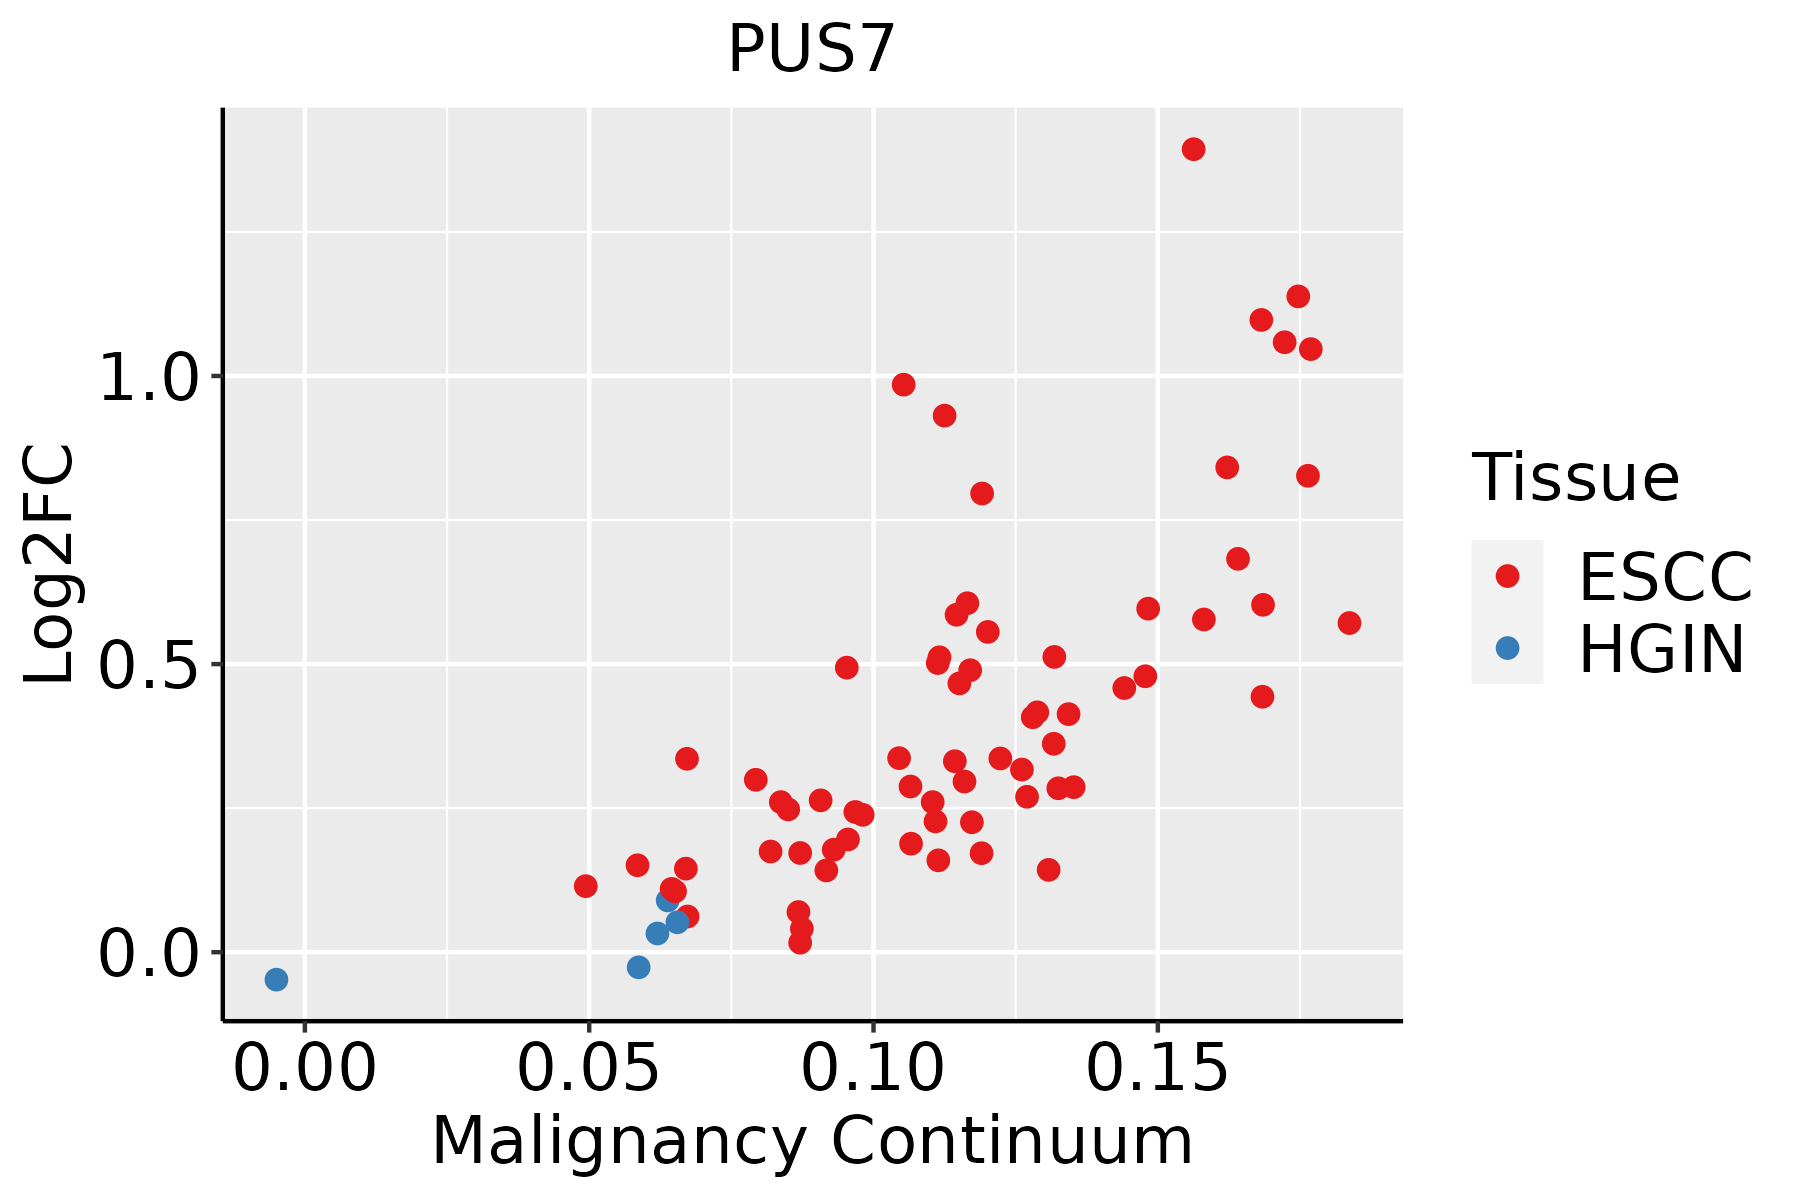
ESCC: Esophageal squamous cell carcinoma
HGIN: High-grade intraepithelial neoplasias
LGIN: Low-grade intraepithelial neoplasias
LiverThe image shows the transcriptomic changes along malignancy continuum.log2FC in expression of this searched gene in stem-like cells from each diseased tissue sample relative to stem-like cells in normal samples in each tissue plotted against the malignancy continuum. Samples are colored based on if they are from different disease stage.
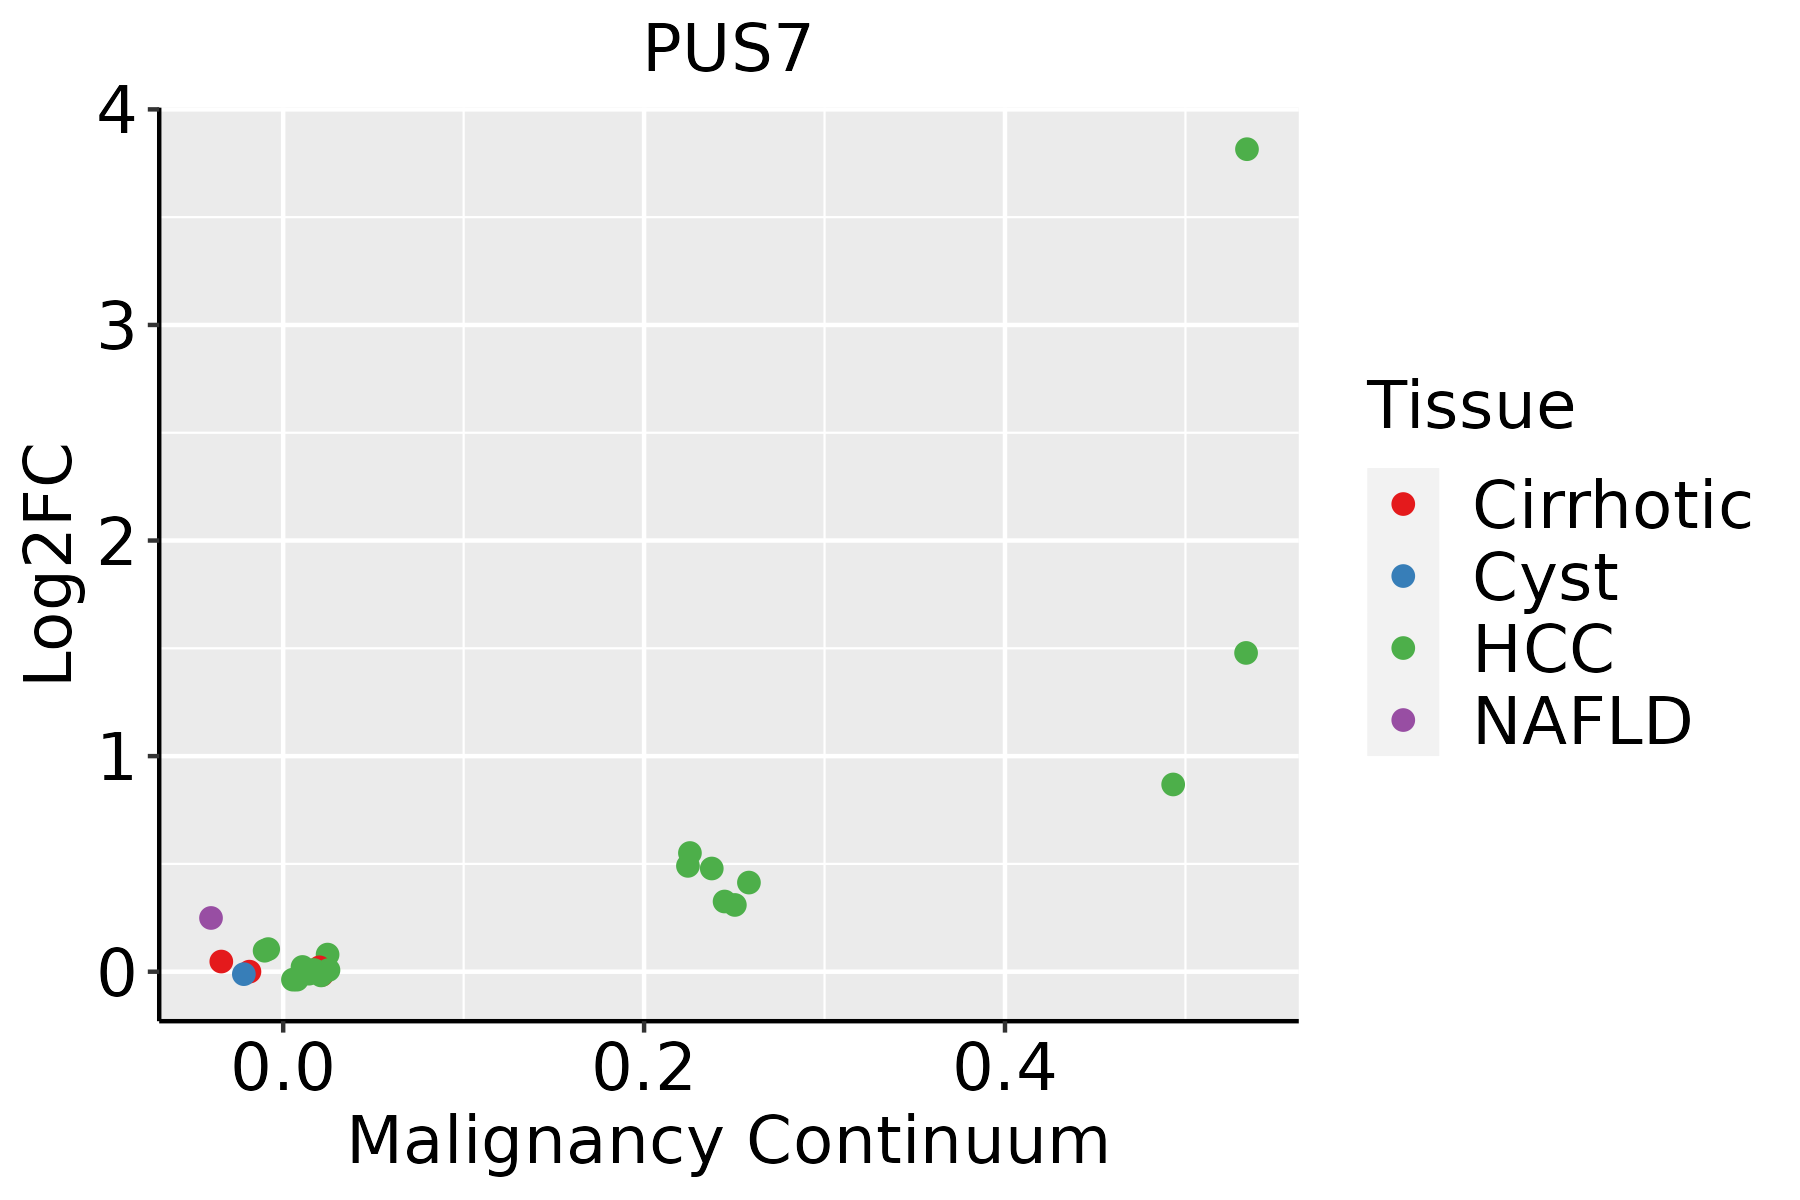
HCC: Hepatocellular carcinoma
NAFLD: Non-alcoholic fatty liver disease
Oral CavityThe image shows the transcriptomic changes along malignancy continuum.log2FC in expression of this searched gene in stem-like cells from each diseased tissue sample relative to stem-like cells in normal samples in each tissue plotted against the malignancy continuum. Samples are colored based on if they are from different disease stage.
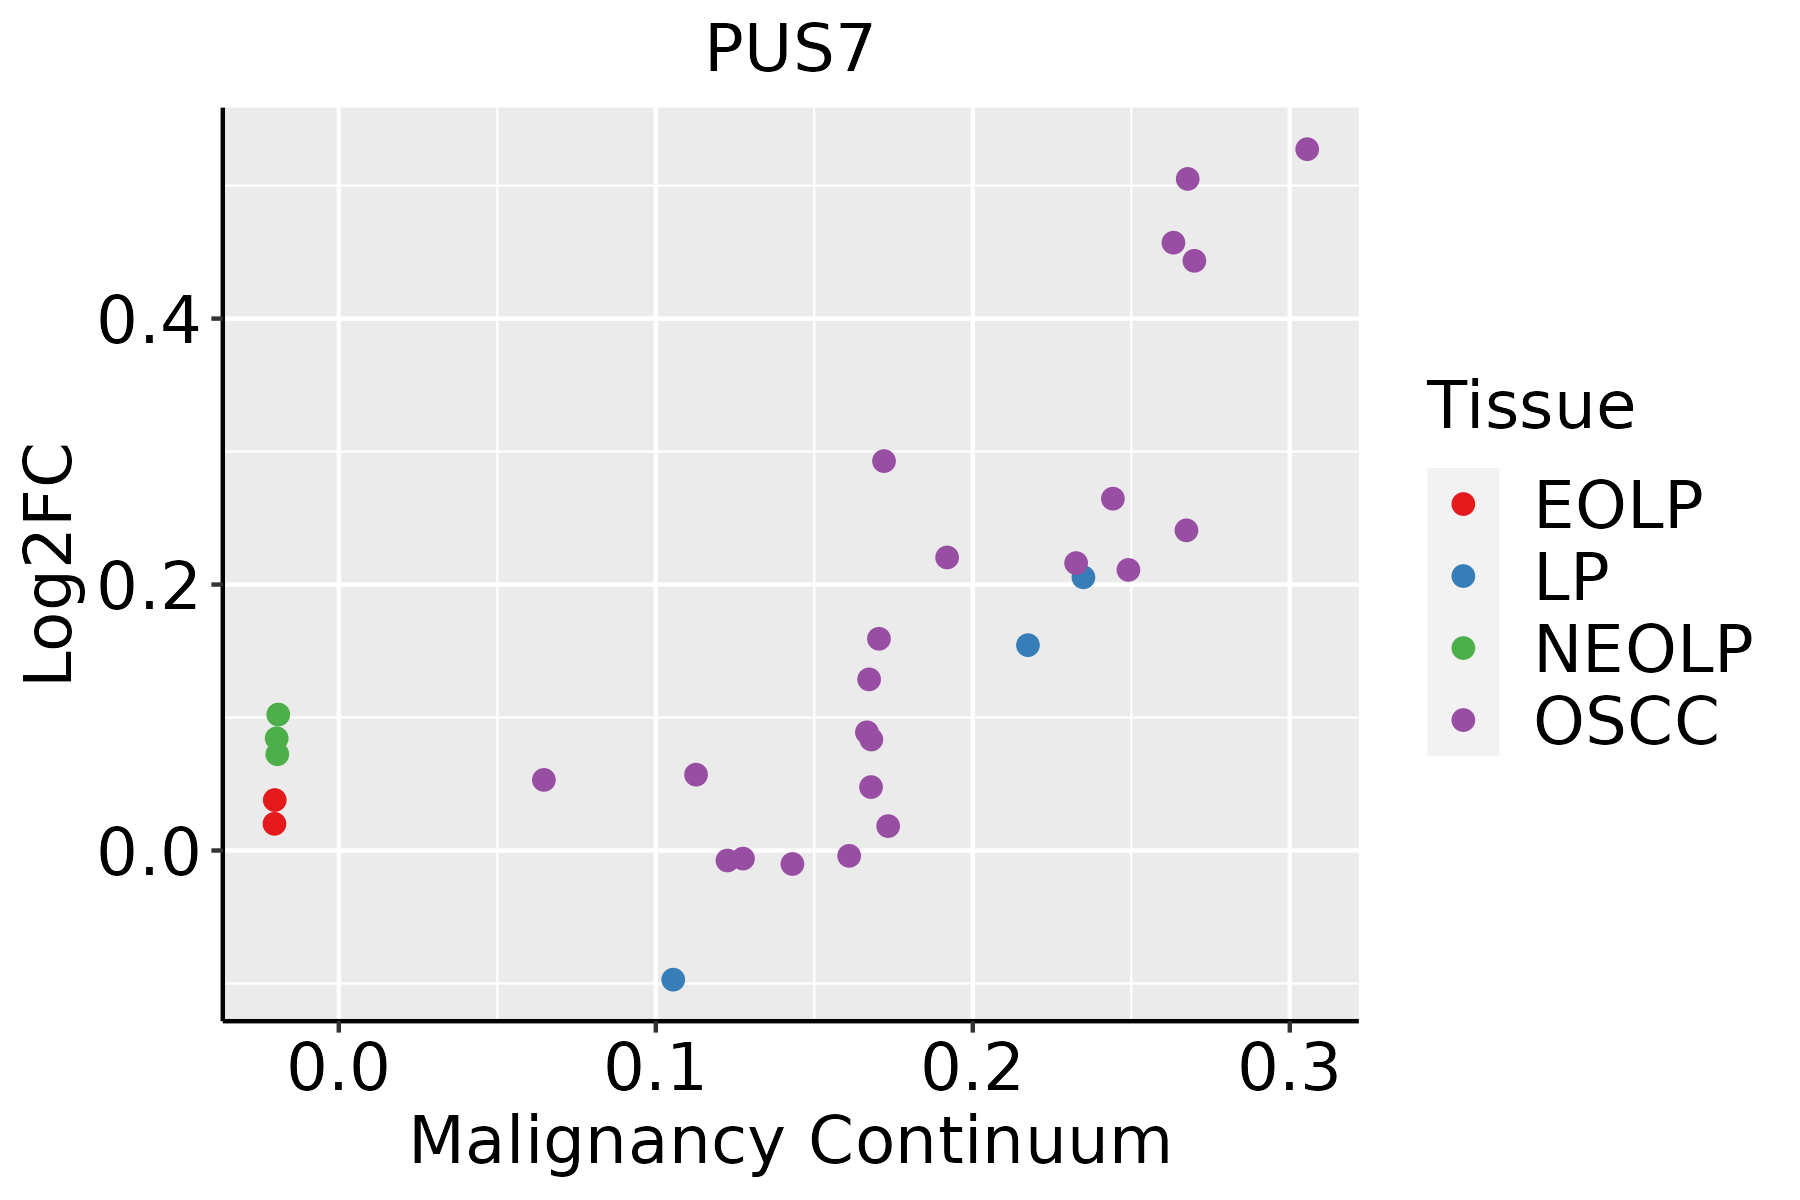
EOLP: Erosive Oral lichen planus
LP: leukoplakia
NEOLP: Non-erosive oral lichen planus
OSCC: Oral squamous cell carcinoma
SkinThe image shows the transcriptomic changes along malignancy continuum.log2FC in expression of this searched gene in stem-like cells from each diseased tissue sample relative to stem-like cells in normal samples in each tissue plotted against the malignancy continuum. Samples are colored based on if they are from different disease stage.
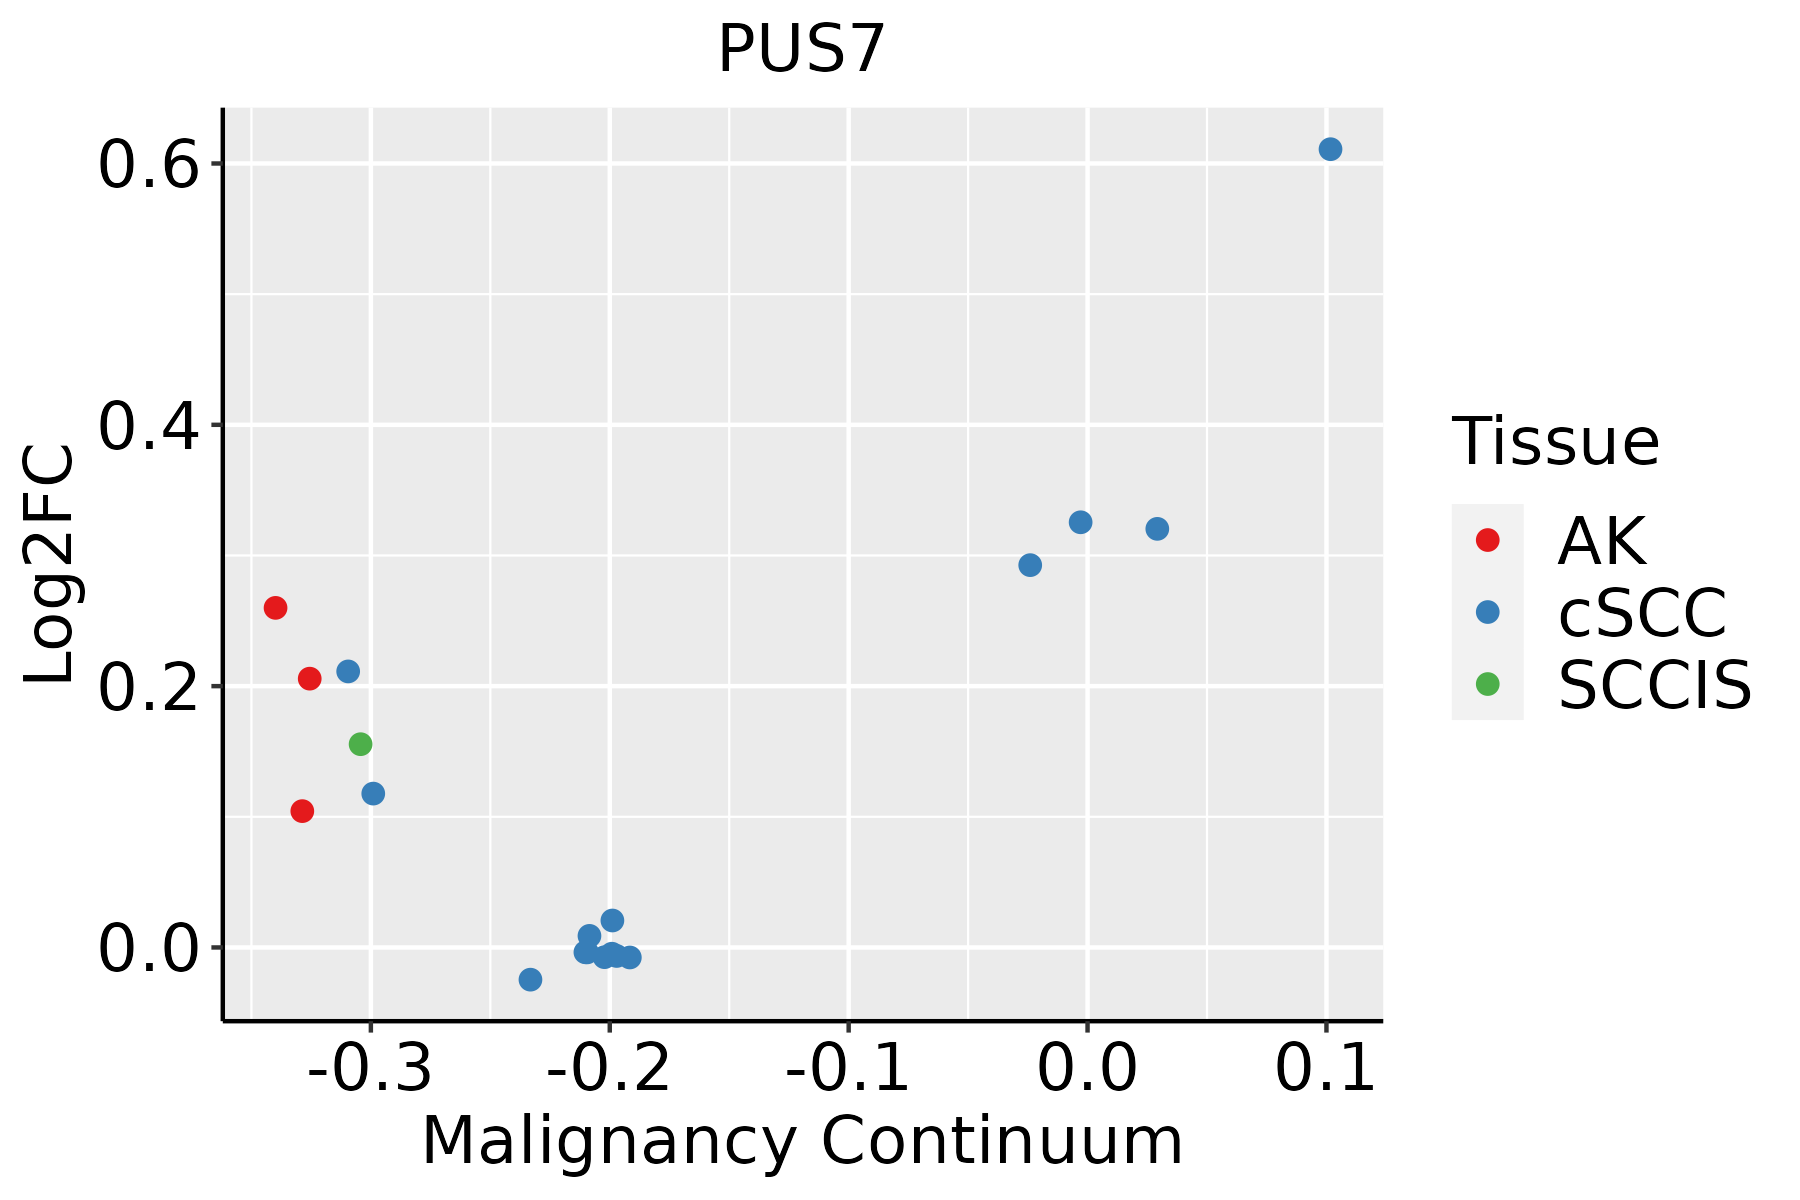
AK: Actinic keratosis
cSCC: Cutaneous squamous cell carcinoma
SCCIS:squamous cell carcinoma in situ
∗log2FC in expression of this searched gene in stem-like cells from each diseased tissue sample relative to stem-like cells in normal samples in each tissue plotted against the malignancy continuum. Samples are colored based on if they are from different disease stage.

Top

Malignant transformation related pathway analysis

check buttonFind out the enriched GO biological processes and KEGG pathways involved in transition from healthy to precancer to cancer
check button Figure of enriched GO biological processes.
TissueDisease StageEnriched GO biological Processes
ColorectumADGO analysis - Figure of enriched GO biological processes: Top 15 enriched GO BP terms are showed in the bar plot of each disease state in each tissue. Each row represents a significant GO biological process which is colored according to the -log10(p.adjust).
ColorectumSERGO analysis - Figure of enriched GO biological processes: Top 15 enriched GO BP terms are showed in the bar plot of each disease state in each tissue. Each row represents a significant GO biological process which is colored according to the -log10(p.adjust).
ColorectumMSSGO analysis - Figure of enriched GO biological processes: Top 15 enriched GO BP terms are showed in the bar plot of each disease state in each tissue. Each row represents a significant GO biological process which is colored according to the -log10(p.adjust).
ColorectumMSI-HGO analysis - Figure of enriched GO biological processes: Top 15 enriched GO BP terms are showed in the bar plot of each disease state in each tissue. Each row represents a significant GO biological process which is colored according to the -log10(p.adjust).
ColorectumFAPGO analysis - Figure of enriched GO biological processes: Top 15 enriched GO BP terms are showed in the bar plot of each disease state in each tissue. Each row represents a significant GO biological process which is colored according to the -log10(p.adjust).
∗Top 15 enriched GO BP terms are showed in the bar plot of each disease state in each tissue. Each row represents a significant GO biological process which is colored according to the -log10(p.adjust).
Page: 1 2 3 4 5 6 7 8 9 

check button Enriched GO biological processes.
GO IDTissueDisease StageDescriptionGene RatioBg Ratiopvaluep.adjustCount
GO:000641710CervixCCregulation of translation89/2311468/187231.86e-053.46e-0489
GO:20007362CervixCCregulation of stem cell differentiation19/231158/187234.01e-056.21e-0419
GO:00488634CervixCCstem cell differentiation46/2311206/187234.11e-056.36e-0446
GO:00022443CervixCChematopoietic progenitor cell differentiation26/2311114/187231.30e-031.03e-0226
GO:0060218CervixCChematopoietic stem cell differentiation10/231130/187232.33e-031.66e-0210
GO:1901532CervixCCregulation of hematopoietic progenitor cell differentiation10/231132/187233.96e-032.48e-0210
GO:1902036CervixCCregulation of hematopoietic stem cell differentiation6/231114/187234.36e-032.67e-026
GO:003447015EsophagusESCCncRNA processing300/8552395/187233.09e-353.26e-32300
GO:003466012EsophagusESCCncRNA metabolic process346/8552485/187234.35e-312.51e-28346
GO:0006417111EsophagusESCCregulation of translation304/8552468/187231.53e-171.33e-15304
GO:00080333EsophagusESCCtRNA processing92/8552127/187237.83e-101.93e-0892
GO:00063992EsophagusESCCtRNA metabolic process122/8552179/187239.03e-102.19e-08122
GO:00094512EsophagusESCCRNA modification114/8552167/187232.76e-096.04e-08114
GO:00064002EsophagusESCCtRNA modification62/855290/187237.02e-067.04e-0562
GO:00488638EsophagusESCCstem cell differentiation122/8552206/187235.95e-054.59e-04122
GO:00015221EsophagusESCCpseudouridine synthesis16/855218/187231.78e-041.15e-0316
GO:00165561EsophagusESCCmRNA modification21/855227/187236.88e-043.61e-0321
GO:200073614EsophagusESCCregulation of stem cell differentiation39/855258/187237.43e-043.86e-0339
GO:00602185EsophagusESCChematopoietic stem cell differentiation22/855230/187231.98e-038.90e-0322
GO:00022446EsophagusESCChematopoietic progenitor cell differentiation66/8552114/187235.74e-032.13e-0266
Page: 1 2 3 4 

check button Enriched KEGG pathways.
Pathway IDTissueDisease StageDescriptionGene RatioBg Ratiopvaluep.adjustqvalueCount
Page: 1 

Top

Cell-cell communication analysis

check buttonIdentification of potential cell-cell interactions between two cell types and their ligand-receptor pairs for different disease states
LigandReceptorLRpairPathwayTissueDisease Stage
Page: 1 

Top

Single-cell gene regulatory network inference analysis

check buttonFind out the significant the regulons (TFs) and the target genes of each regulon across cell types for different disease states
TFCell TypeTissueDisease StageTarget GeneRSSRegulon Activity
∗The dot plots of a searched regulon are shown for all cell subpopulations in each disease state of each tissue based on the regulon specific score inferred using pySCENIC and by calculating the average expression.
Page: 1 

Top

Somatic mutation of malignant transformation related genes

check buttonAnnotation of somatic variants for genes involved in malignant transformation
Hugo SymbolVariant ClassVariant ClassificationdbSNP RSHGVScHGVSpHGVSp ShortSWISSPROTBIOTYPESIFTPolyPhenTumor Sample BarcodeTissueHistologySexAgeStageTherapy TypesDrugsOutcome
PUS7SNVMissense_Mutationnovelc.238G>Cp.Asp80Hisp.D80HQ96PZ0protein_codingdeleterious(0.02)benign(0.092)TCGA-A7-A4SE-01Breastbreast invasive carcinomaFemale<65I/IIChemotherapyadriamycinCR
PUS7SNVMissense_Mutationrs776732227c.1981N>Tp.Arg661Cysp.R661CQ96PZ0protein_codingdeleterious_low_confidence(0)probably_damaging(0.993)TCGA-AC-A23H-01Breastbreast invasive carcinomaFemale>=65I/IIUnknownUnknownPD
PUS7SNVMissense_Mutationc.1193C>Tp.Ser398Phep.S398FQ96PZ0protein_codingdeleterious(0.01)possibly_damaging(0.447)TCGA-AN-A046-01Breastbreast invasive carcinomaFemale>=65I/IIUnknownUnknownSD
PUS7SNVMissense_Mutationc.453N>Cp.Leu151Phep.L151FQ96PZ0protein_codingdeleterious(0)probably_damaging(0.999)TCGA-D8-A27G-01Breastbreast invasive carcinomaFemale>=65I/IIUnknownUnknownSD
PUS7SNVMissense_Mutationnovelc.1957N>Gp.Thr653Alap.T653AQ96PZ0protein_codingtolerated(0.15)benign(0.026)TCGA-OL-A66P-01Breastbreast invasive carcinomaFemale>=65I/IIChemotherapycytoxanCR
PUS7insertionNonsense_Mutationnovelc.1417_1418insAGCCGGGCp.Leu473Terp.L473*Q96PZ0protein_codingTCGA-BH-A0GY-01Breastbreast invasive carcinomaFemale>=65I/IIChemotherapycyotxanSD
PUS7insertionIn_Frame_Insnovelc.1416_1417insGTCTCTACTAAAAATACAAAAAATp.Arg472_Leu473insValSerThrLysAsnThrLysAsnp.R472_L473insVSTKNTKNQ96PZ0protein_codingTCGA-BH-A0GY-01Breastbreast invasive carcinomaFemale>=65I/IIChemotherapycyotxanSD
PUS7SNVMissense_Mutationnovelc.241N>Cp.Glu81Glnp.E81QQ96PZ0protein_codingtolerated(0.22)benign(0.068)TCGA-DS-A7WH-01Cervixcervical & endocervical cancerFemale<65I/IIChemotherapycisplatinCR
PUS7SNVMissense_Mutationc.1700A>Gp.Asp567Glyp.D567GQ96PZ0protein_codingdeleterious(0)probably_damaging(0.978)TCGA-EK-A2PI-01Cervixcervical & endocervical cancerFemale<65III/IVUnknownUnknownSD
PUS7SNVMissense_Mutationrs754710973c.1958N>Tp.Thr653Metp.T653MQ96PZ0protein_codingdeleterious(0)benign(0.216)TCGA-5M-AAT6-01Colorectumcolon adenocarcinomaFemale<65III/IVUnknownUnknownPD
Page: 1 2 3 4 5 6 7 

Top

Related drugs of malignant transformation related genes

check buttonIdentification of chemicals and drugs interact with genes involved in malignant transfromation
(DGIdb 4.0)
Entrez IDSymbolCategoryInteraction TypesDrug Claim NameDrug NamePMIDs
Page: 1