
|
|||||
|
 | |
| |
| |
| |
| |
| |
|
Gene: PURA |
Gene summary for PURA |
| Gene information | Species | Human | Gene symbol | PURA | Gene ID | 5813 |
| Gene name | purine rich element binding protein A | |
| Gene Alias | MRD31 | |
| Cytomap | 5q31.3 | |
| Gene Type | protein-coding | GO ID | GO:0000122 | UniProtAcc | Q00577 |
Top |
Malignant transformation analysis |
| Identification of the aberrant gene expression in precancerous and cancerous lesions by comparing the gene expression of stem-like cells in diseased tissues with normal stem cells |
| Entrez ID | Symbol | Replicates | Species | Organ | Tissue | Adj P-value | Log2FC | Malignancy |
| 5813 | PURA | LZE2T | Human | Esophagus | ESCC | 3.53e-04 | 3.65e-01 | 0.082 |
| 5813 | PURA | LZE4T | Human | Esophagus | ESCC | 6.45e-10 | 9.20e-02 | 0.0811 |
| 5813 | PURA | LZE8T | Human | Esophagus | ESCC | 5.91e-06 | 5.06e-02 | 0.067 |
| 5813 | PURA | LZE20T | Human | Esophagus | ESCC | 1.07e-05 | 6.90e-02 | 0.0662 |
| 5813 | PURA | LZE22D1 | Human | Esophagus | HGIN | 3.46e-02 | 1.28e-02 | 0.0595 |
| 5813 | PURA | LZE22T | Human | Esophagus | ESCC | 2.11e-05 | 2.65e-01 | 0.068 |
| 5813 | PURA | LZE24T | Human | Esophagus | ESCC | 2.70e-21 | 3.12e-01 | 0.0596 |
| 5813 | PURA | LZE21T | Human | Esophagus | ESCC | 9.25e-03 | 1.04e-01 | 0.0655 |
| 5813 | PURA | P1T-E | Human | Esophagus | ESCC | 9.62e-08 | 2.98e-01 | 0.0875 |
| 5813 | PURA | P2T-E | Human | Esophagus | ESCC | 7.09e-19 | 3.95e-01 | 0.1177 |
| 5813 | PURA | P4T-E | Human | Esophagus | ESCC | 8.95e-23 | 3.63e-01 | 0.1323 |
| 5813 | PURA | P5T-E | Human | Esophagus | ESCC | 1.30e-13 | 1.61e-01 | 0.1327 |
| 5813 | PURA | P8T-E | Human | Esophagus | ESCC | 6.58e-14 | 3.04e-01 | 0.0889 |
| 5813 | PURA | P9T-E | Human | Esophagus | ESCC | 4.76e-14 | 2.29e-01 | 0.1131 |
| 5813 | PURA | P10T-E | Human | Esophagus | ESCC | 1.44e-19 | 3.59e-01 | 0.116 |
| 5813 | PURA | P11T-E | Human | Esophagus | ESCC | 3.50e-15 | 7.25e-01 | 0.1426 |
| 5813 | PURA | P12T-E | Human | Esophagus | ESCC | 1.13e-31 | 5.29e-01 | 0.1122 |
| 5813 | PURA | P15T-E | Human | Esophagus | ESCC | 8.28e-15 | 3.26e-01 | 0.1149 |
| 5813 | PURA | P16T-E | Human | Esophagus | ESCC | 1.06e-21 | 2.28e-01 | 0.1153 |
| 5813 | PURA | P19T-E | Human | Esophagus | ESCC | 2.40e-07 | 4.48e-01 | 0.1662 |
| Page: 1 2 3 4 5 6 7 |
| Tissue | Expression Dynamics | Abbreviation |
| Esophagus | 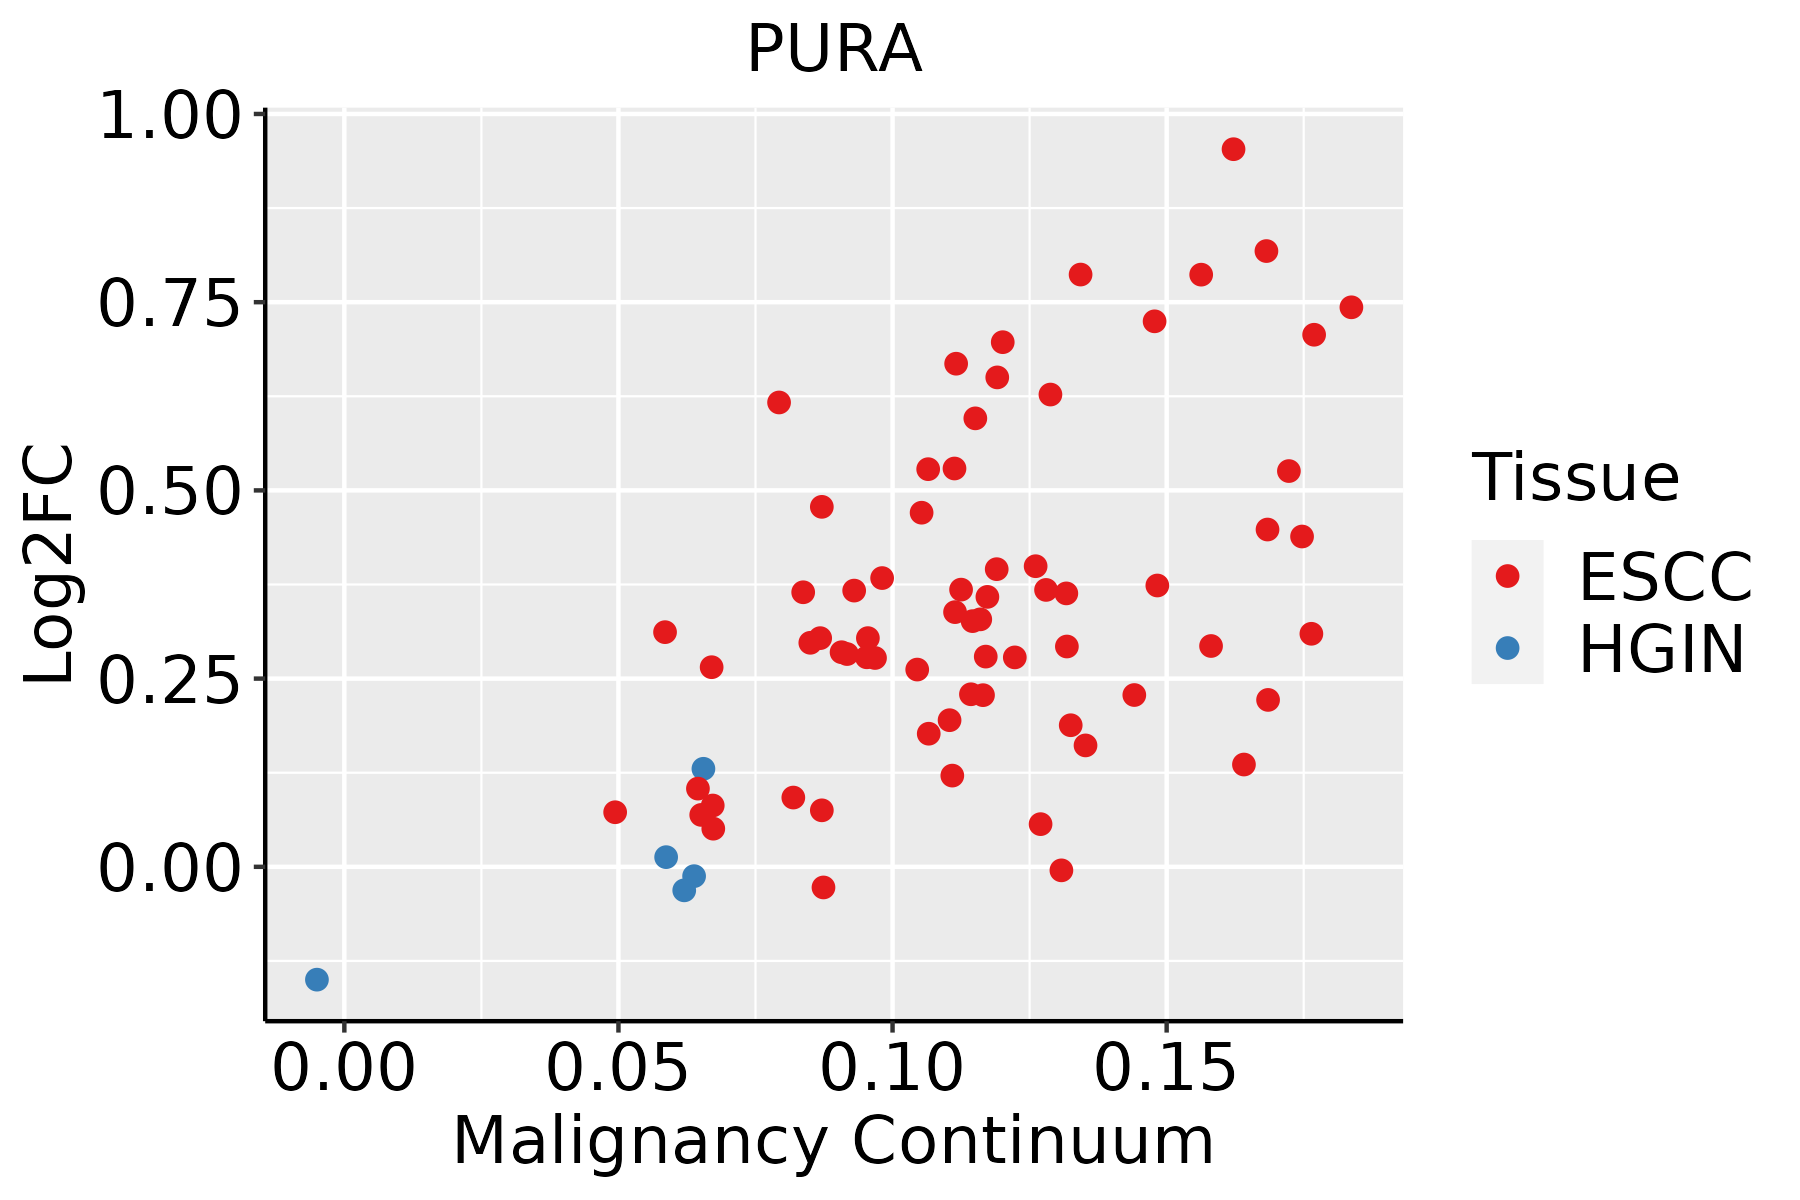 | ESCC: Esophageal squamous cell carcinoma |
| HGIN: High-grade intraepithelial neoplasias | ||
| LGIN: Low-grade intraepithelial neoplasias | ||
| Liver | 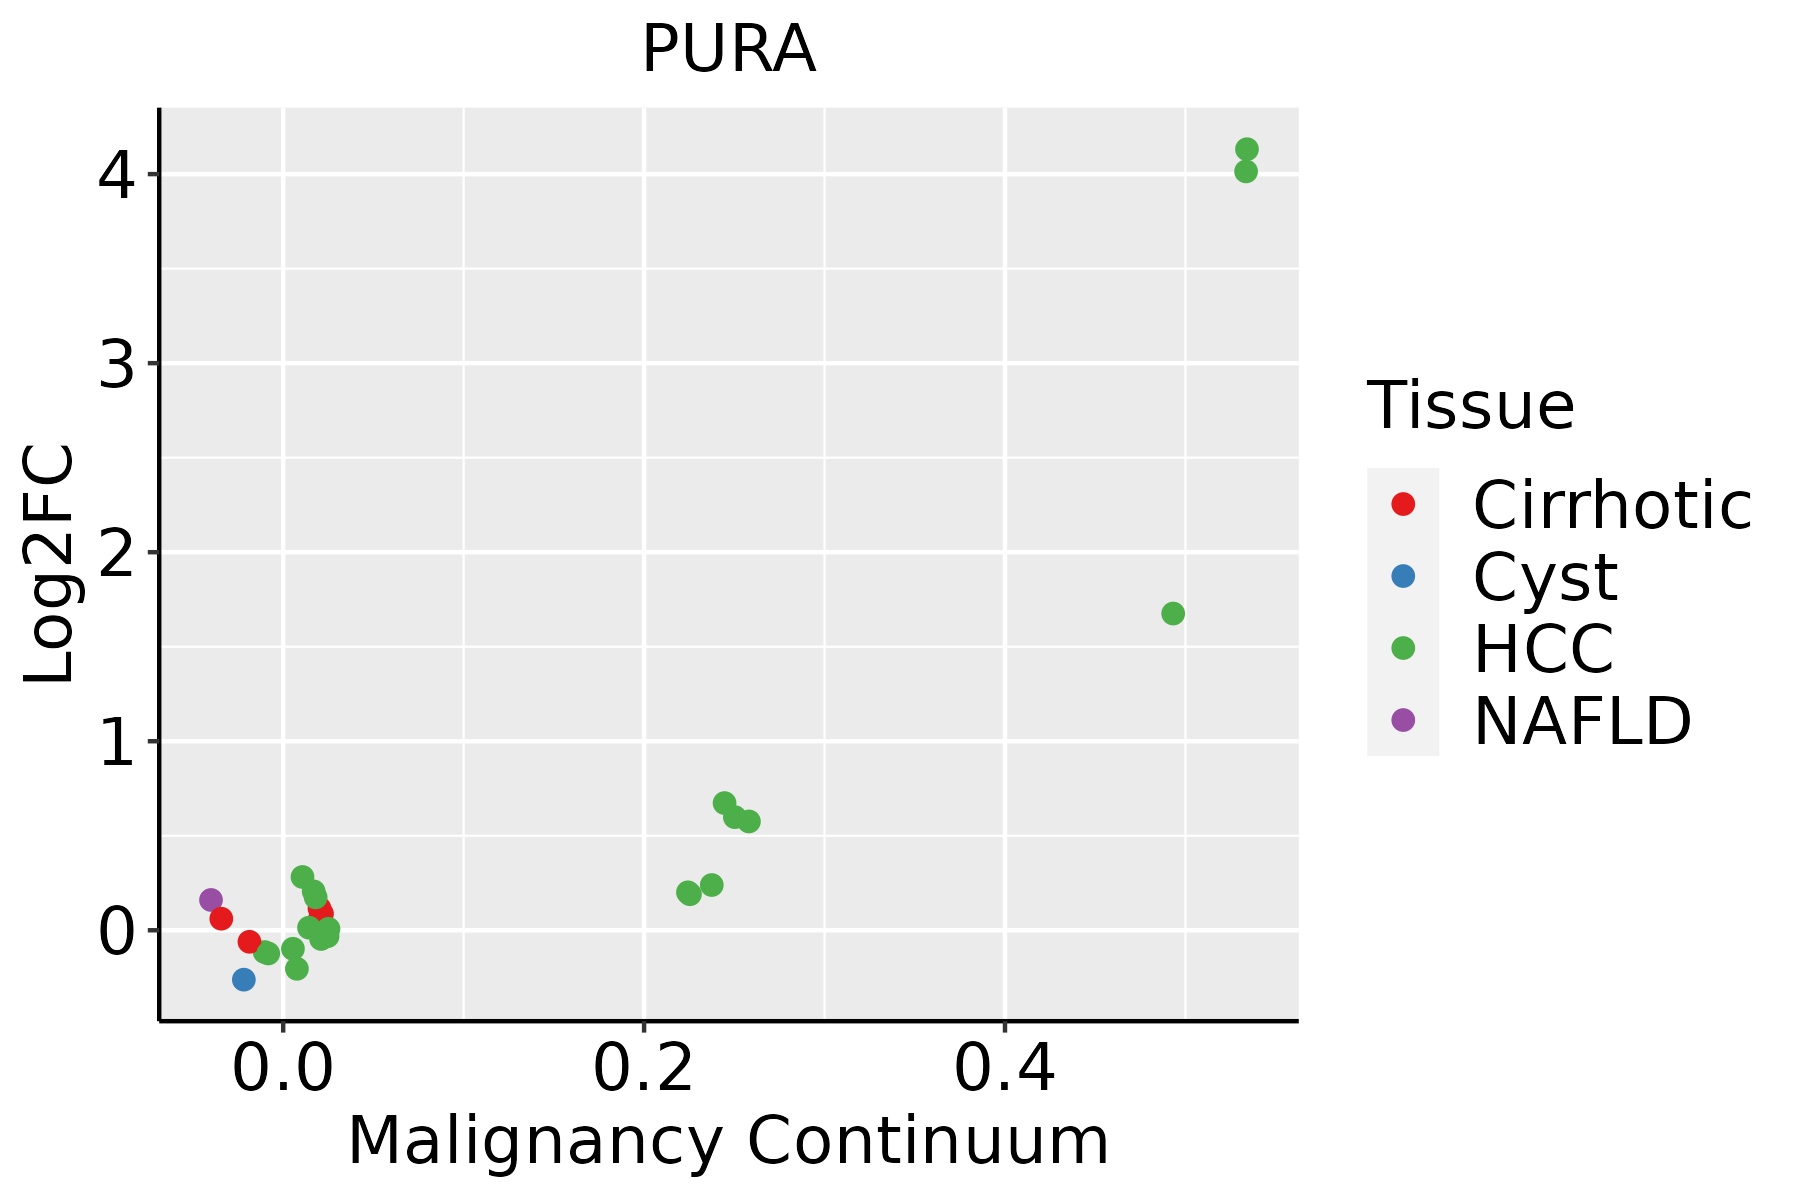 | HCC: Hepatocellular carcinoma |
| NAFLD: Non-alcoholic fatty liver disease | ||
| Lung | 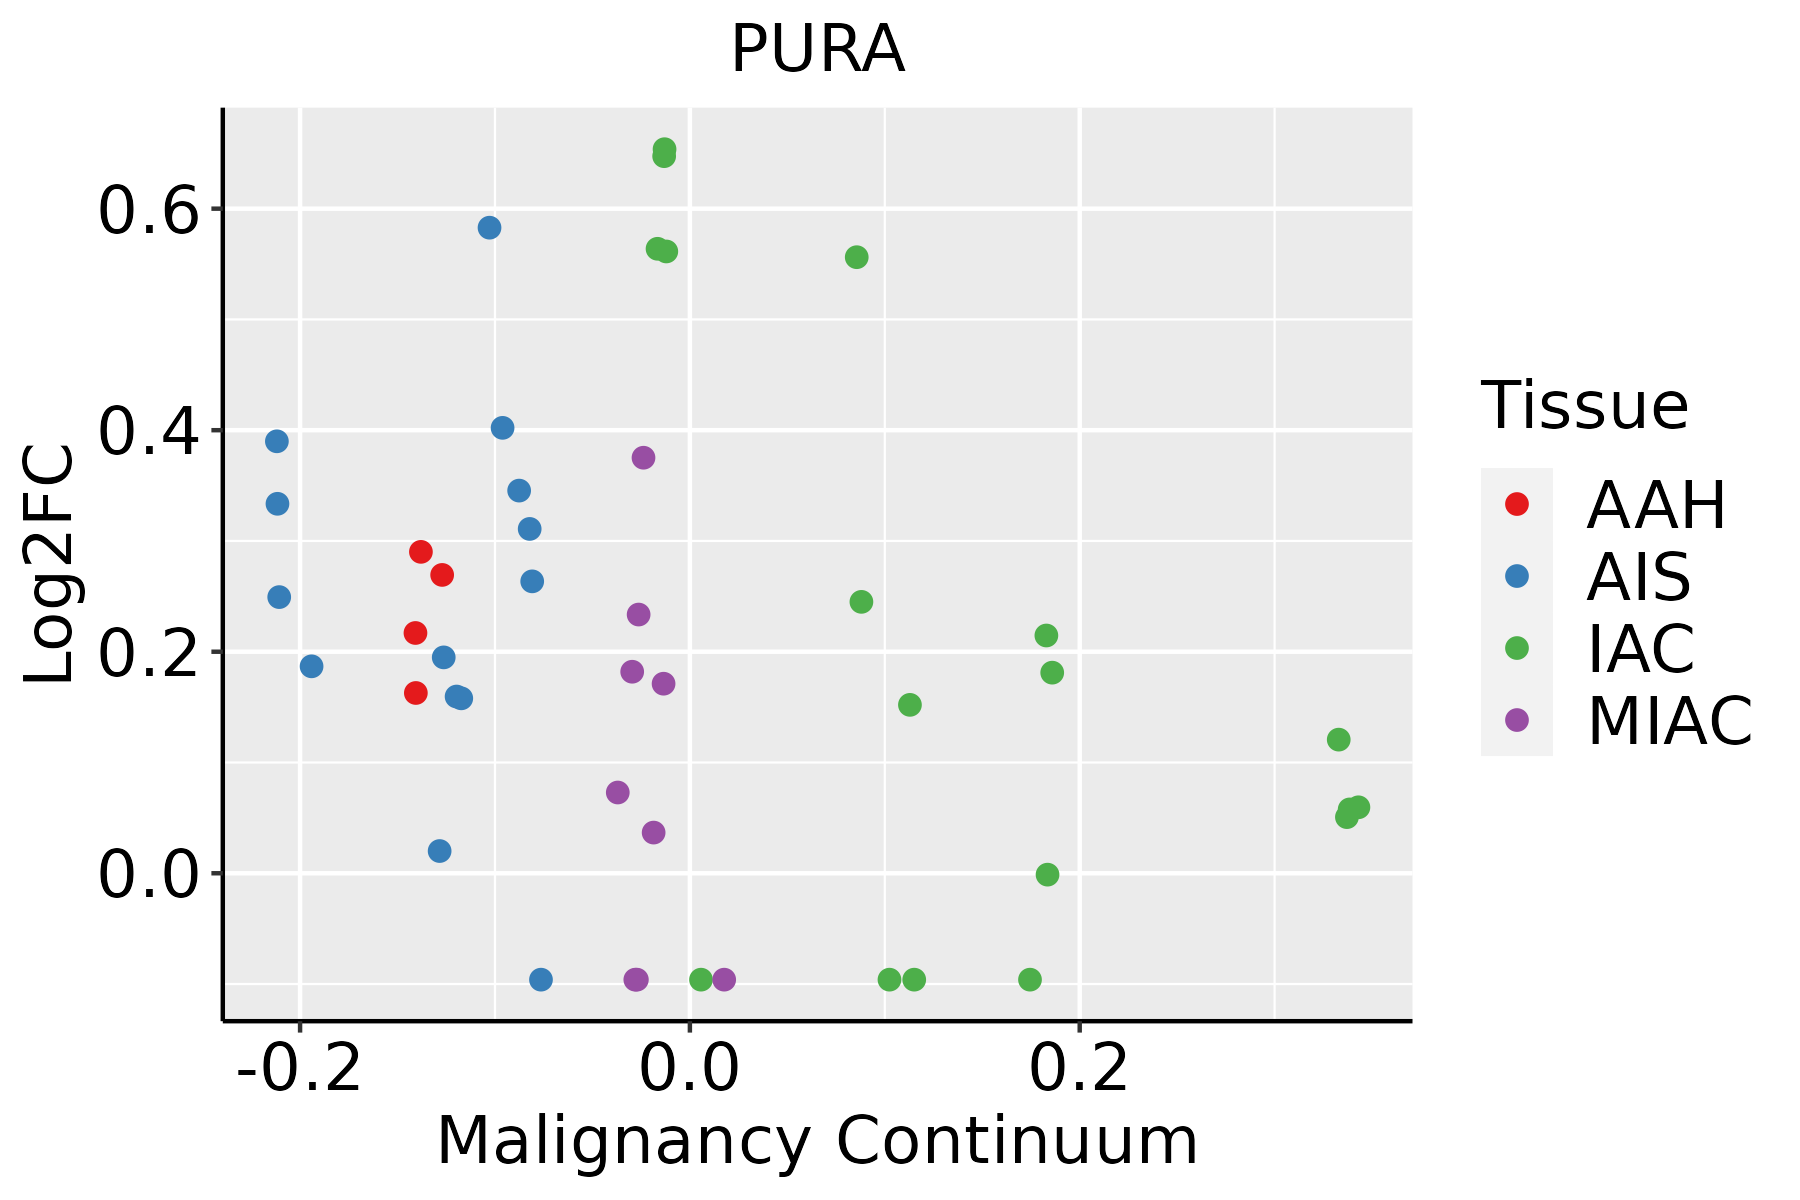 | AAH: Atypical adenomatous hyperplasia |
| AIS: Adenocarcinoma in situ | ||
| IAC: Invasive lung adenocarcinoma | ||
| MIA: Minimally invasive adenocarcinoma | ||
| Oral Cavity | 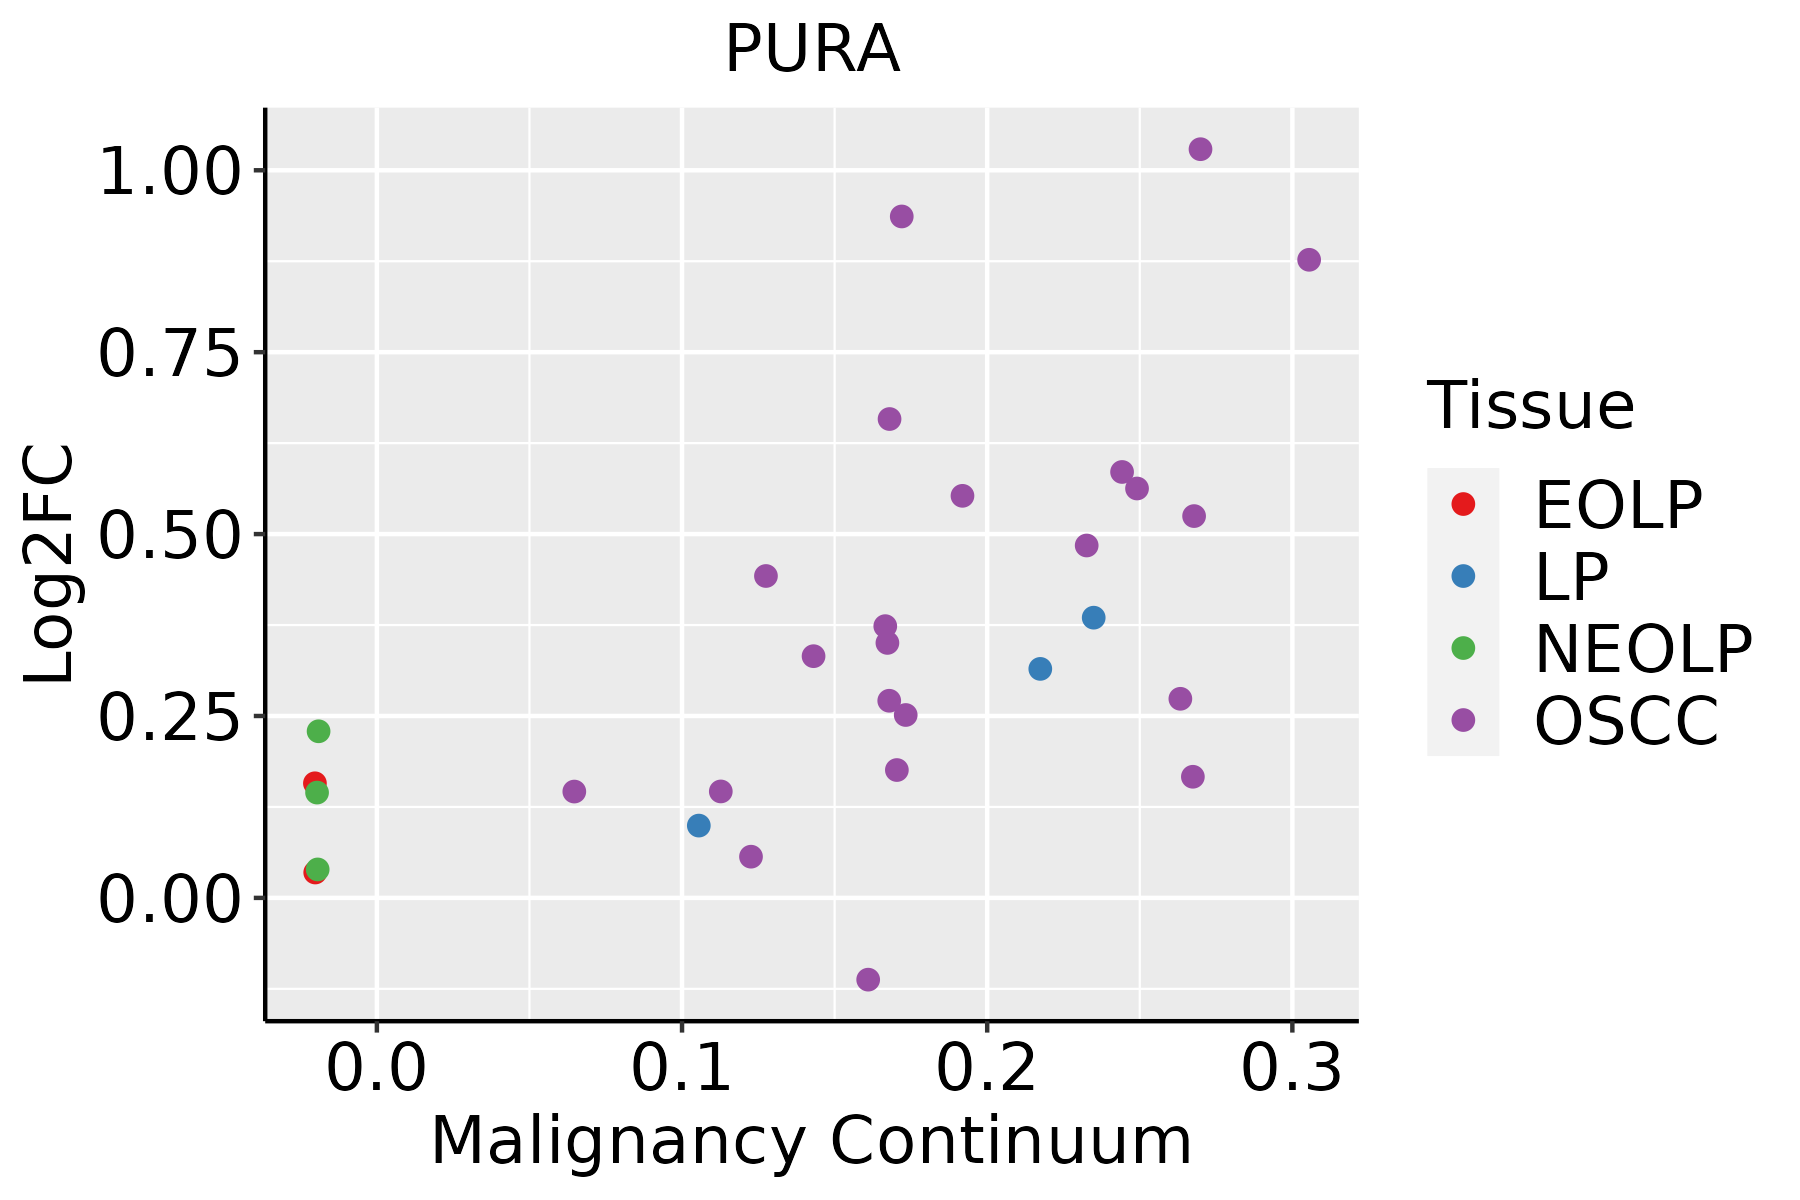 | EOLP: Erosive Oral lichen planus |
| LP: leukoplakia | ||
| NEOLP: Non-erosive oral lichen planus | ||
| OSCC: Oral squamous cell carcinoma | ||
| Prostate | 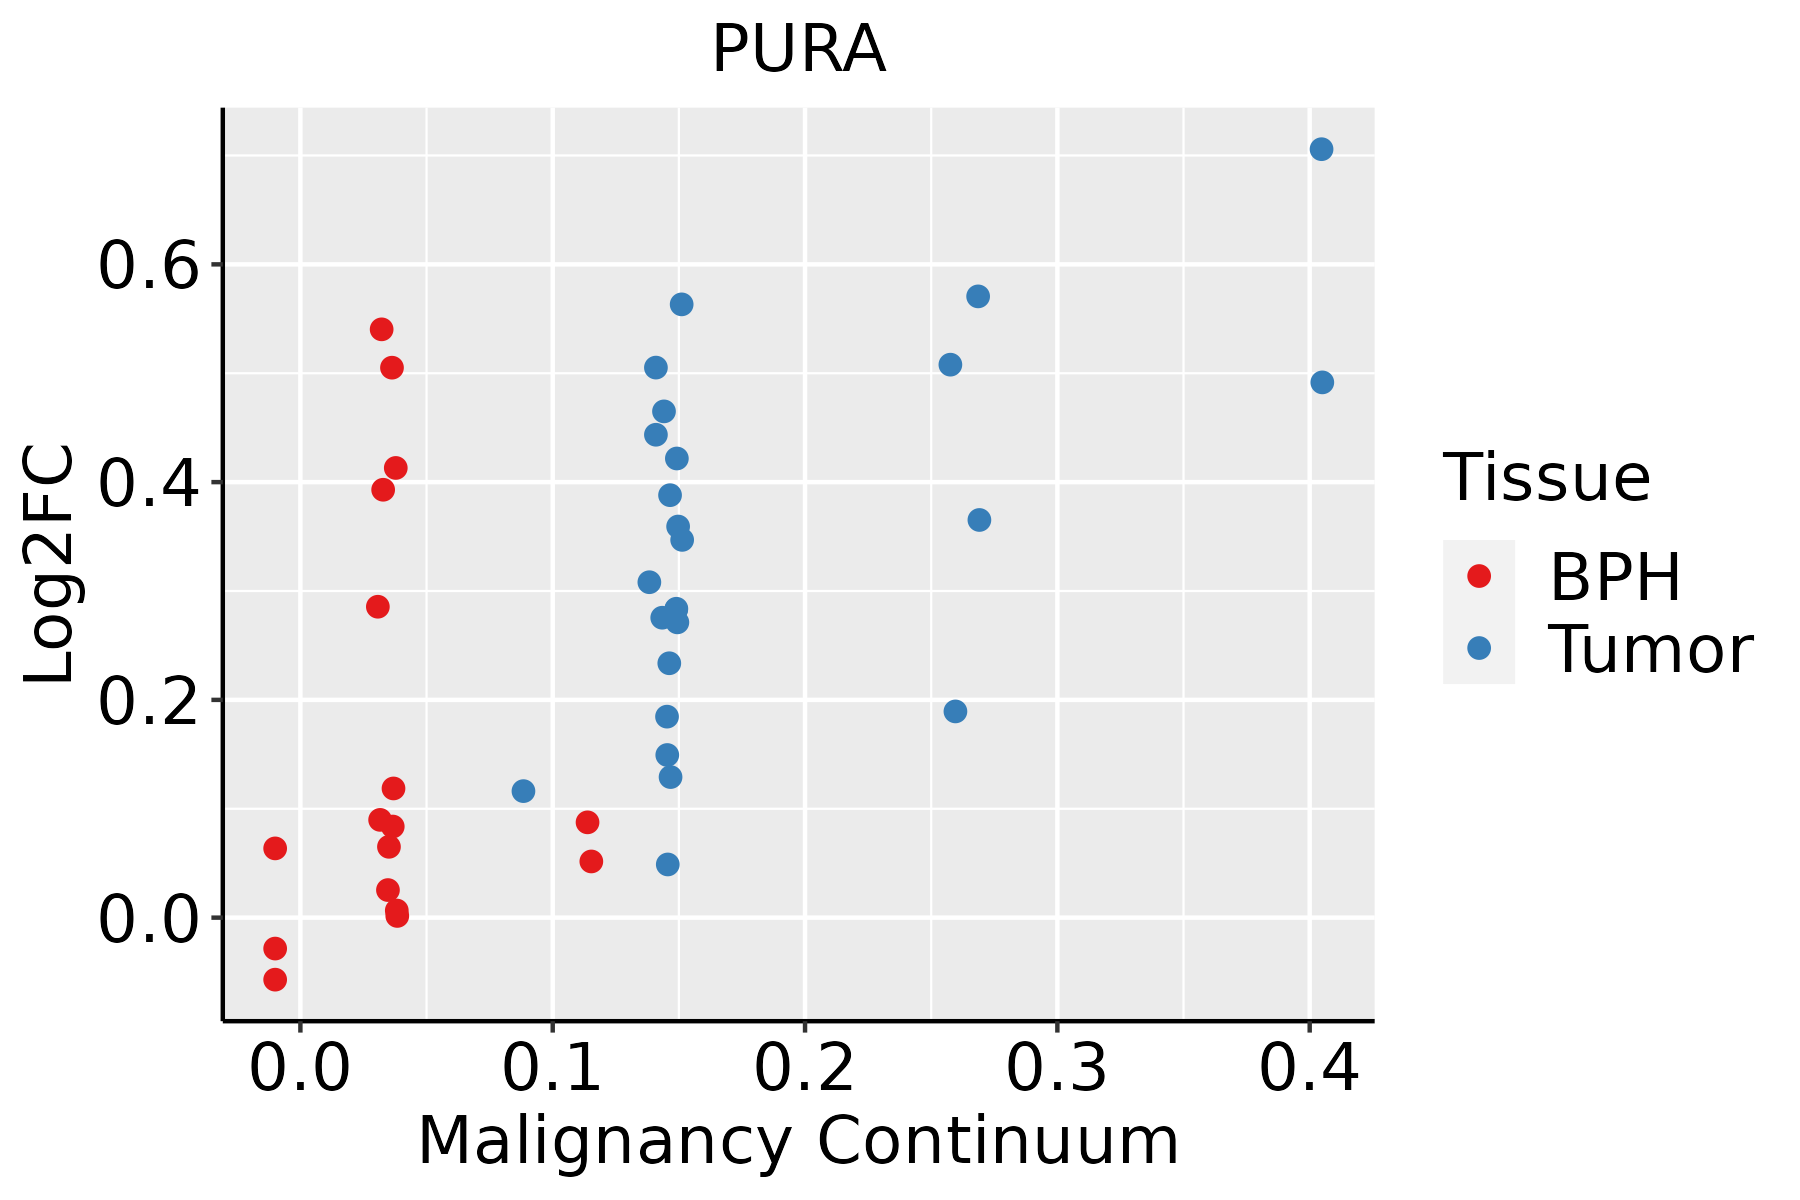 | BPH: Benign Prostatic Hyperplasia |
| Skin | 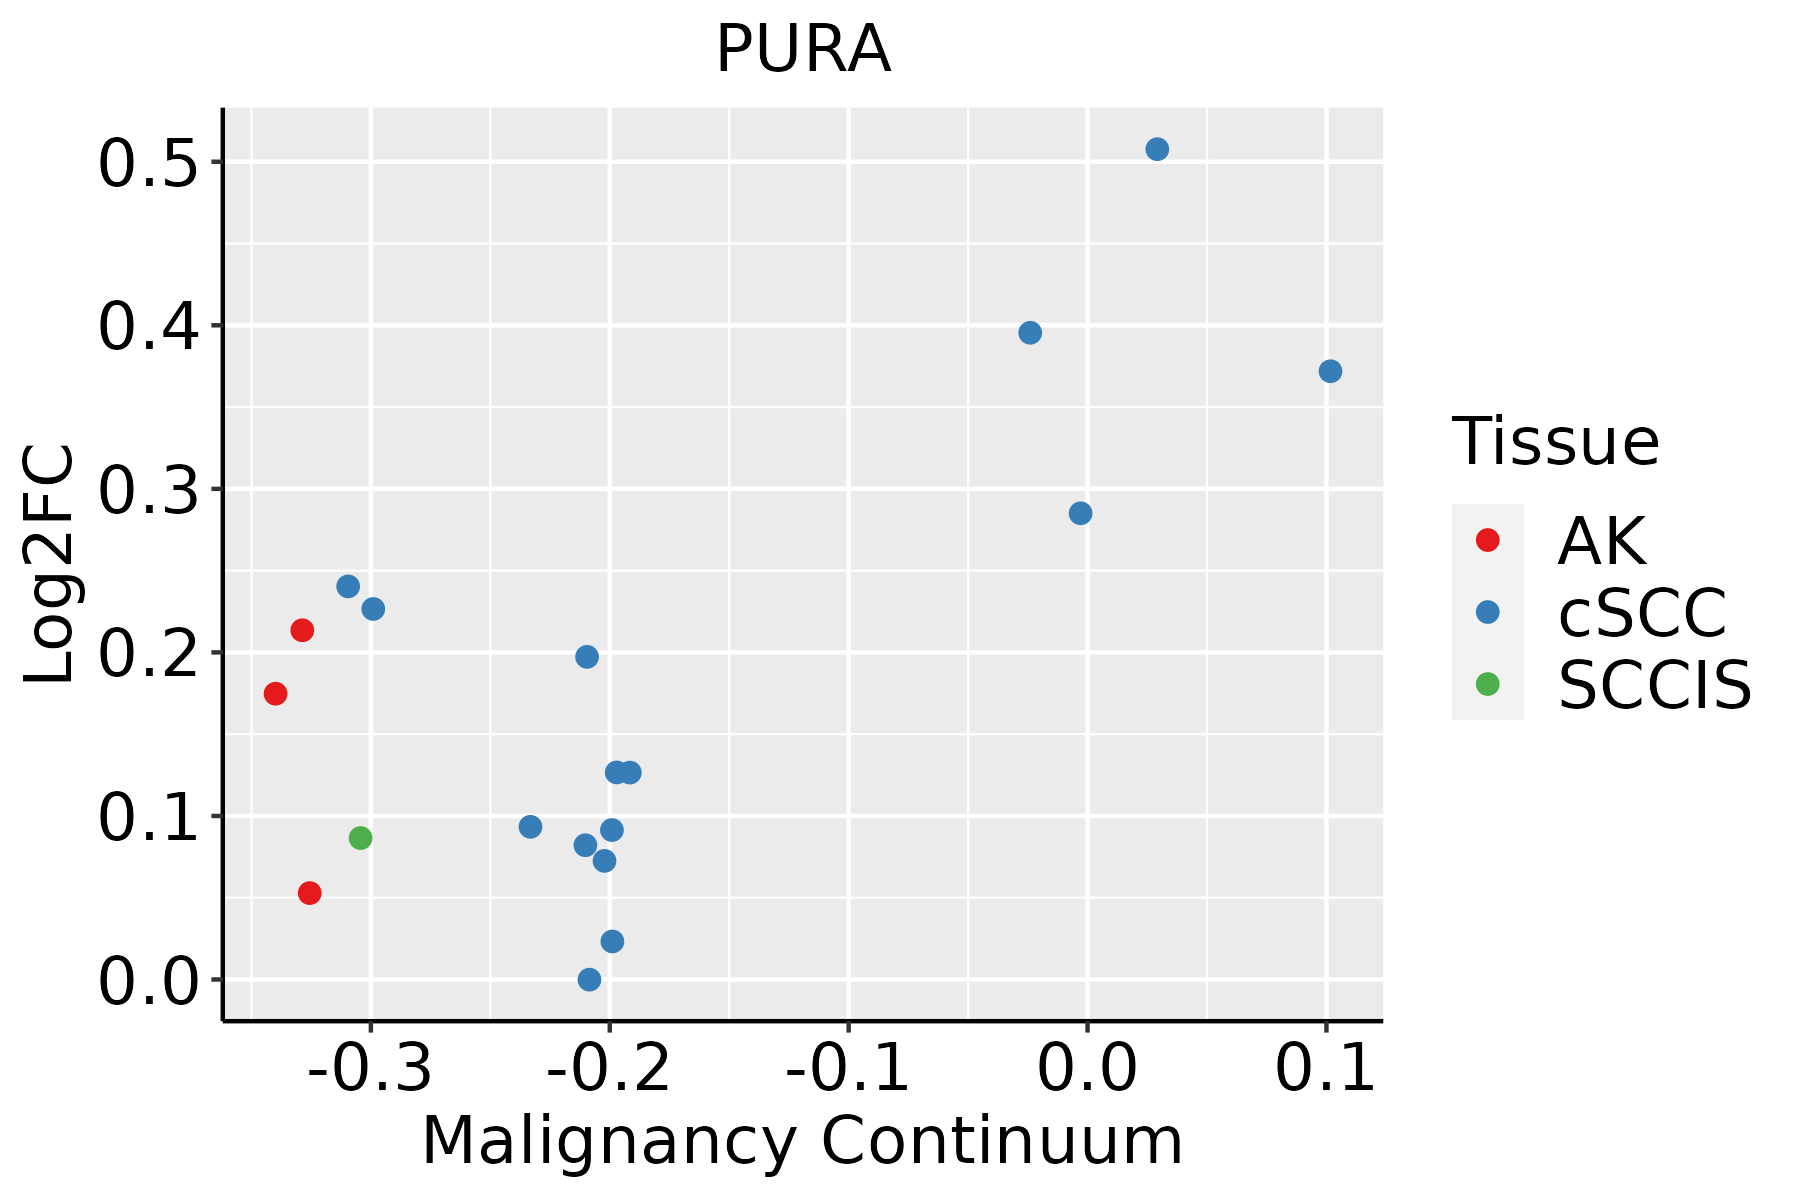 | AK: Actinic keratosis |
| cSCC: Cutaneous squamous cell carcinoma | ||
| SCCIS:squamous cell carcinoma in situ | ||
| Thyroid | 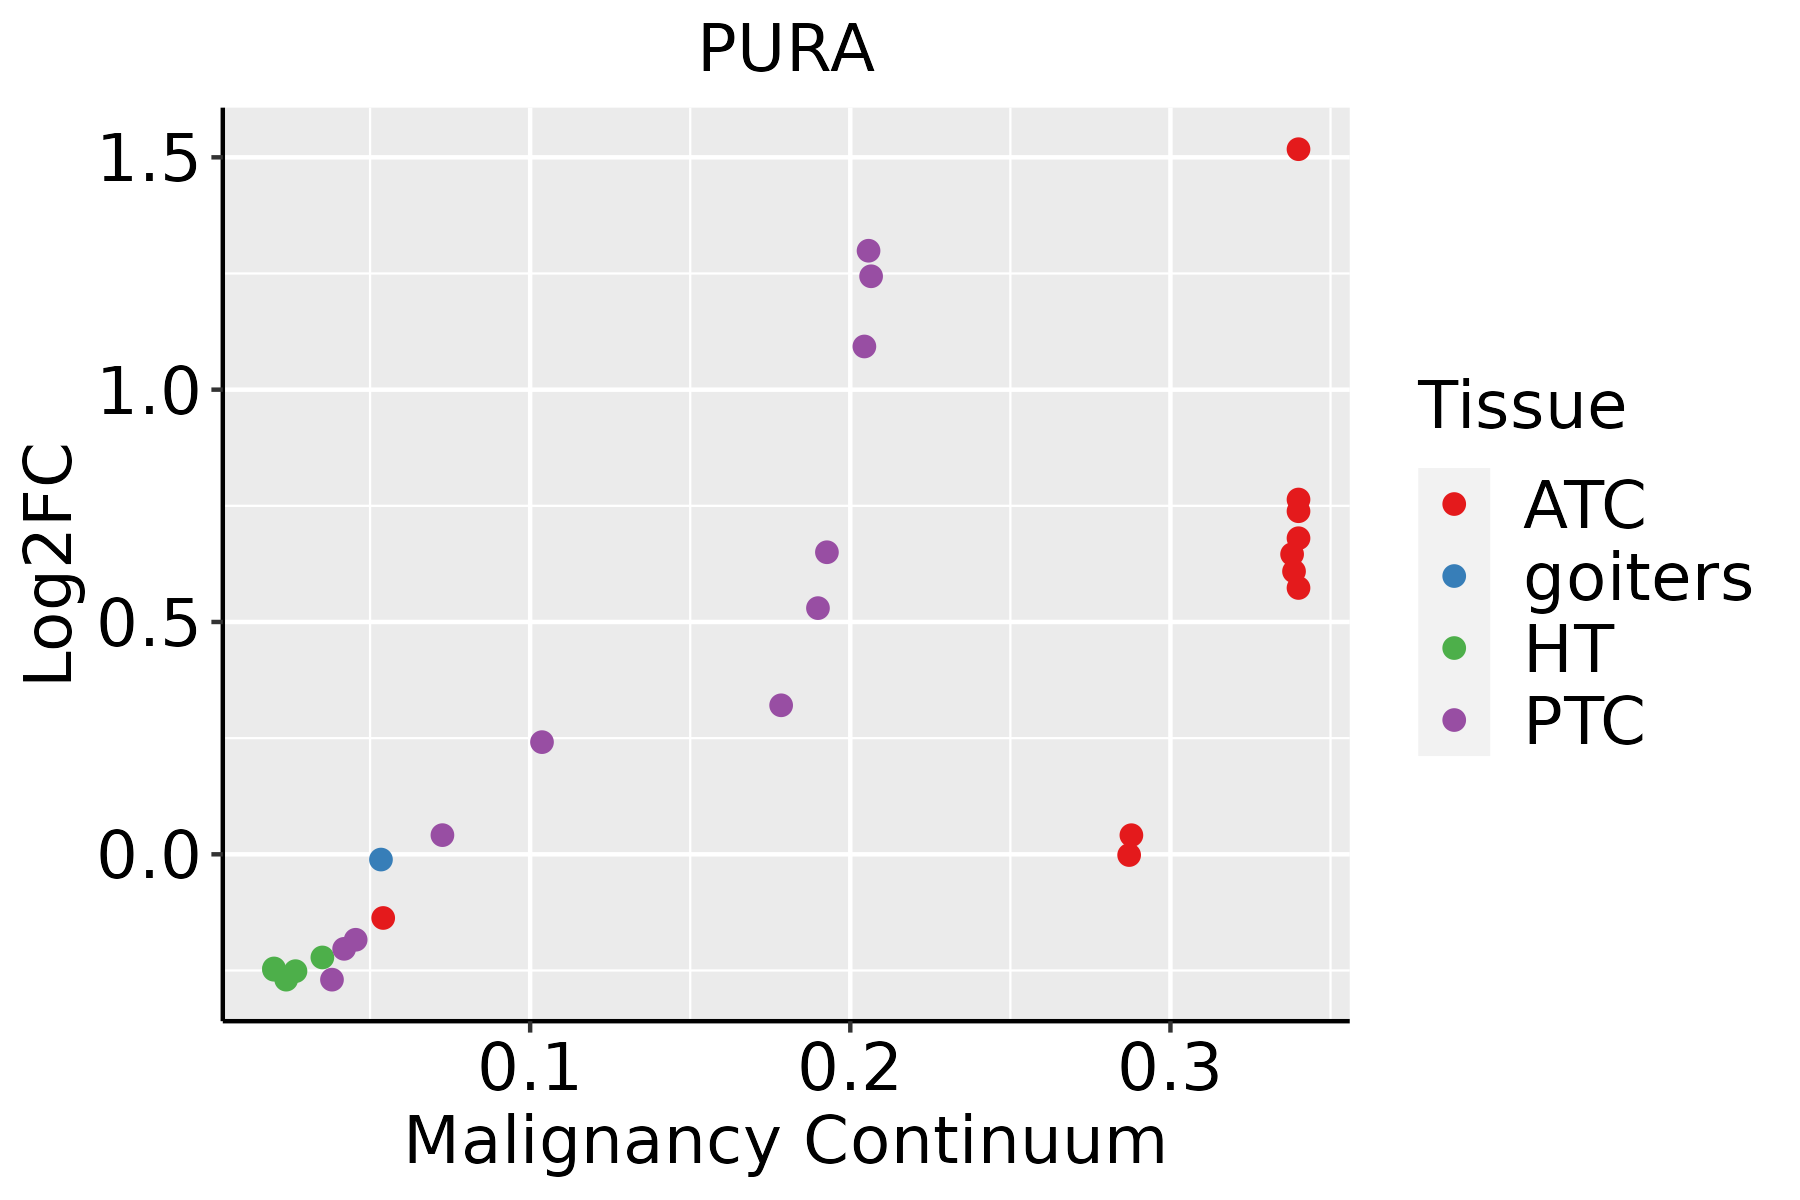 | ATC: Anaplastic thyroid cancer |
| HT: Hashimoto's thyroiditis | ||
| PTC: Papillary thyroid cancer |
| ∗log2FC in expression of this searched gene in stem-like cells from each diseased tissue sample relative to stem-like cells in normal samples in each tissue plotted against the malignancy continuum. Samples are colored based on if they are from different disease stage. |
Top |
Malignant transformation related pathway analysis |
| Find out the enriched GO biological processes and KEGG pathways involved in transition from healthy to precancer to cancer |
| Tissue | Disease Stage | Enriched GO biological Processes |
| Colorectum | AD |  |
| Colorectum | SER |  |
| Colorectum | MSS |  |
| Colorectum | MSI-H |  |
| Colorectum | FAP |  |
| ∗Top 15 enriched GO BP terms are showed in the bar plot of each disease state in each tissue. Each row represents a significant GO biological process which is colored according to the -log10(p.adjust). |
| Page: 1 2 3 4 5 6 7 8 9 |
| GO ID | Tissue | Disease Stage | Description | Gene Ratio | Bg Ratio | pvalue | p.adjust | Count |
| GO:000641727 | Esophagus | HGIN | regulation of translation | 139/2587 | 468/18723 | 1.46e-19 | 7.98e-17 | 139 |
| GO:00342496 | Esophagus | HGIN | negative regulation of cellular amide metabolic process | 66/2587 | 273/18723 | 2.74e-06 | 9.60e-05 | 66 |
| GO:00171486 | Esophagus | HGIN | negative regulation of translation | 59/2587 | 245/18723 | 1.03e-05 | 2.96e-04 | 59 |
| GO:00315035 | Esophagus | HGIN | protein-containing complex localization | 50/2587 | 220/18723 | 2.18e-04 | 3.98e-03 | 50 |
| GO:003070517 | Esophagus | HGIN | cytoskeleton-dependent intracellular transport | 45/2587 | 195/18723 | 3.07e-04 | 5.15e-03 | 45 |
| GO:00323926 | Esophagus | HGIN | DNA geometric change | 25/2587 | 90/18723 | 3.77e-04 | 5.85e-03 | 25 |
| GO:00325084 | Esophagus | HGIN | DNA duplex unwinding | 22/2587 | 84/18723 | 1.91e-03 | 2.03e-02 | 22 |
| GO:00109707 | Esophagus | HGIN | transport along microtubule | 35/2587 | 155/18723 | 2.01e-03 | 2.12e-02 | 35 |
| GO:0006417111 | Esophagus | ESCC | regulation of translation | 304/8552 | 468/18723 | 1.53e-17 | 1.33e-15 | 304 |
| GO:00062604 | Esophagus | ESCC | DNA replication | 181/8552 | 260/18723 | 3.55e-15 | 2.05e-13 | 181 |
| GO:003070518 | Esophagus | ESCC | cytoskeleton-dependent intracellular transport | 133/8552 | 195/18723 | 1.48e-10 | 4.27e-09 | 133 |
| GO:001097013 | Esophagus | ESCC | transport along microtubule | 107/8552 | 155/18723 | 3.17e-09 | 6.80e-08 | 107 |
| GO:000808810 | Esophagus | ESCC | axo-dendritic transport | 58/8552 | 75/18723 | 2.09e-08 | 4.02e-07 | 58 |
| GO:003150314 | Esophagus | ESCC | protein-containing complex localization | 139/8552 | 220/18723 | 1.14e-07 | 1.85e-06 | 139 |
| GO:00062612 | Esophagus | ESCC | DNA-dependent DNA replication | 100/8552 | 151/18723 | 2.61e-07 | 3.94e-06 | 100 |
| GO:00510908 | Esophagus | ESCC | regulation of DNA-binding transcription factor activity | 252/8552 | 440/18723 | 5.22e-07 | 6.97e-06 | 252 |
| GO:003239214 | Esophagus | ESCC | DNA geometric change | 62/8552 | 90/18723 | 7.02e-06 | 7.04e-05 | 62 |
| GO:003250813 | Esophagus | ESCC | DNA duplex unwinding | 58/8552 | 84/18723 | 1.23e-05 | 1.14e-04 | 58 |
| GO:00991114 | Esophagus | ESCC | microtubule-based transport | 115/8552 | 190/18723 | 2.54e-05 | 2.15e-04 | 115 |
| GO:00062701 | Esophagus | ESCC | DNA replication initiation | 27/8552 | 34/18723 | 6.01e-05 | 4.62e-04 | 27 |
| Page: 1 2 3 4 5 6 7 8 |
| Pathway ID | Tissue | Disease Stage | Description | Gene Ratio | Bg Ratio | pvalue | p.adjust | qvalue | Count |
| Page: 1 |
Top |
Cell-cell communication analysis |
| Identification of potential cell-cell interactions between two cell types and their ligand-receptor pairs for different disease states |
| Ligand | Receptor | LRpair | Pathway | Tissue | Disease Stage |
| Page: 1 |
Top |
Single-cell gene regulatory network inference analysis |
| Find out the significant the regulons (TFs) and the target genes of each regulon across cell types for different disease states |
| TF | Cell Type | Tissue | Disease Stage | Target Gene | RSS | Regulon Activity |
| PURA | TREG | Colorectum | AD | IKBKB,ABHD8,ACTN4, etc. | 8.46e-02 |  |
| PURA | CD4TN | Colorectum | Healthy | IKBKB,ABHD8,ACTN4, etc. | 2.11e-02 |  |
| PURA | MAIT | Colorectum | MSI-H | IKBKB,ABHD8,ACTN4, etc. | 4.38e-02 |  |
| PURA | DC | Colorectum | MSS | IKBKB,ABHD8,ACTN4, etc. | 1.03e-01 |  |
| PURA | ILC | Colorectum | SER | IKBKB,ABHD8,ACTN4, etc. | 2.28e-02 |  |
| PURA | AT1 | Lung | ADJ | DDX17,IGIP,PNISR, etc. | 2.02e-01 |  |
| PURA | AT1 | Lung | AIS | DDX17,IGIP,PNISR, etc. | 8.25e-02 |  |
| PURA | AT1 | Lung | Healthy | HIF1A,F3,TIAL1, etc. | 1.30e-01 |  |
| PURA | AT1 | Lung | MIAC | DDX17,IGIP,PNISR, etc. | 5.54e-02 |  |
| PURA | MAST | Lung | ADJ | SLA2,NFRKB,SNX9, etc. | 2.14e-02 | |
| ∗The dot plots of a searched regulon are shown for all cell subpopulations in each disease state of each tissue based on the regulon specific score inferred using pySCENIC and by calculating the average expression. |
| Page: 1 2 |
Top |
Somatic mutation of malignant transformation related genes |
| Annotation of somatic variants for genes involved in malignant transformation |
| Hugo Symbol | Variant Class | Variant Classification | dbSNP RS | HGVSc | HGVSp | HGVSp Short | SWISSPROT | BIOTYPE | SIFT | PolyPhen | Tumor Sample Barcode | Tissue | Histology | Sex | Age | Stage | Therapy Types | Drugs | Outcome |
| PURA | SNV | Missense_Mutation | c.634N>C | p.Glu212Gln | p.E212Q | Q00577 | protein_coding | deleterious(0.02) | possibly_damaging(0.646) | TCGA-LP-A4AV-01 | Cervix | cervical & endocervical cancer | Female | <65 | I/II | Unknown | Unknown | SD | |
| PURA | SNV | Missense_Mutation | c.579G>T | p.Gln193His | p.Q193H | Q00577 | protein_coding | deleterious(0) | probably_damaging(1) | TCGA-CM-6675-01 | Colorectum | colon adenocarcinoma | Male | <65 | I/II | Chemotherapy | fluorouracil | PD | |
| PURA | SNV | Missense_Mutation | novel | c.740G>A | p.Ser247Asn | p.S247N | Q00577 | protein_coding | deleterious(0) | probably_damaging(0.95) | TCGA-AX-A1C5-01 | Endometrium | uterine corpus endometrioid carcinoma | Female | <65 | III/IV | Unspecific | Carboplatin | SD |
| PURA | SNV | Missense_Mutation | novel | c.358N>T | p.His120Tyr | p.H120Y | Q00577 | protein_coding | tolerated(0.68) | benign(0.401) | TCGA-B5-A1MX-01 | Endometrium | uterine corpus endometrioid carcinoma | Female | <65 | I/II | Hormone Therapy | megace | SD |
| PURA | SNV | Missense_Mutation | novel | c.368A>T | p.Gln123Leu | p.Q123L | Q00577 | protein_coding | deleterious(0.03) | possibly_damaging(0.739) | TCGA-D1-A175-01 | Endometrium | uterine corpus endometrioid carcinoma | Female | <65 | I/II | Chemotherapy | paclitaxel | SD |
| PURA | SNV | Missense_Mutation | novel | c.293N>A | p.Ser98Asn | p.S98N | Q00577 | protein_coding | tolerated(0.06) | possibly_damaging(0.506) | TCGA-E6-A1LX-01 | Endometrium | uterine corpus endometrioid carcinoma | Female | <65 | I/II | Unknown | Unknown | SD |
| PURA | SNV | Missense_Mutation | novel | c.178N>A | p.Glu60Lys | p.E60K | Q00577 | protein_coding | deleterious(0.01) | probably_damaging(0.98) | TCGA-EY-A215-01 | Endometrium | uterine corpus endometrioid carcinoma | Female | <65 | I/II | Unknown | Unknown | SD |
| PURA | deletion | Frame_Shift_Del | novel | c.330delN | p.Arg111AlafsTer114 | p.R111Afs*114 | Q00577 | protein_coding | TCGA-EY-A1G8-01 | Endometrium | uterine corpus endometrioid carcinoma | Female | >=65 | I/II | Unknown | Unknown | SD | ||
| PURA | SNV | Missense_Mutation | novel | c.662G>A | p.Gly221Asp | p.G221D | Q00577 | protein_coding | deleterious(0) | probably_damaging(0.982) | TCGA-2Y-A9H0-01 | Liver | liver hepatocellular carcinoma | Male | <65 | III/IV | Unknown | Unknown | SD |
| PURA | SNV | Missense_Mutation | c.744G>T | p.Glu248Asp | p.E248D | Q00577 | protein_coding | deleterious(0) | probably_damaging(0.95) | TCGA-50-6590-01 | Lung | lung adenocarcinoma | Female | >=65 | I/II | Chemotherapy | paclitaxel | CR |
| Page: 1 2 |
Top |
Related drugs of malignant transformation related genes |
| Identification of chemicals and drugs interact with genes involved in malignant transfromation |
| (DGIdb 4.0) |
| Entrez ID | Symbol | Category | Interaction Types | Drug Claim Name | Drug Name | PMIDs |
| 5813 | PURA | NA | methylphenidate | METHYLPHENIDATE | 29382897 |
| Page: 1 |

Copyright 2023-Present -The University of Texas Health Science Center at Houston |