Schematic overview of the cellular and molecular mechanisms involved in the cancer progression, including the proposed cellular and molecular mechanisms in cancer cells trajectory. AT1: alveolar type 1 cells; AT2: alveolar type 2 cells; AAH: atypical adenomatous hyperplasia; AIS: adenocarcinoma in situ; MIA: minimally invasive adenocarcinoma; IA: invasive adenocarcinoma; EMT: epithelial-mesenchymal transition

Home

Download

Statistics

Help

Contact

Center for Computational Systems Medicine
leaf

Gene summary

leaf

Malignant transformation analysis

leaf

Malignant transformation related pathway analysis

leaf

Cell-cell communication analysis

leaf

Single-cell gene regulatory network inference analysis

leaf

Somatic mutation of malignant transformation related genes

leaf

Related drugs of malignant transformation related genes

Gene: PUM3

Gene summary for PUM3

check button Gene summary.

Gene informationSpeciesHuman
Gene symbol

PUM3

Gene ID

9933

Gene namepumilio RNA binding family member 3
Gene AliasHA-8
Cytomap9p24.2
Gene Typeprotein-coding
GO ID

GO:0006412

UniProtAcc

Q15397


Top

Malignant transformation analysis

check button Identification of the aberrant gene expression in precancerous and cancerous lesions by comparing the gene expression of stem-like cells in diseased tissues with normal stem cells
check button Malignant transformation involving gene list.
Entrez IDSymbolReplicatesSpeciesOrganTissueAdj P-valueLog2FCMalignancy
9933PUM3HTA11_3410_2000001011HumanColorectumAD8.70e-14-5.84e-010.0155
9933PUM3HTA11_3361_2000001011HumanColorectumAD1.12e-02-5.11e-01-0.1207
9933PUM3HTA11_696_2000001011HumanColorectumAD1.33e-18-4.56e-01-0.1464
9933PUM3HTA11_866_2000001011HumanColorectumAD5.32e-12-4.30e-01-0.1001
9933PUM3HTA11_5212_2000001011HumanColorectumAD4.75e-02-5.98e-01-0.2061
9933PUM3HTA11_866_3004761011HumanColorectumAD6.99e-06-4.70e-010.096
9933PUM3HTA11_7696_3000711011HumanColorectumAD1.75e-07-3.69e-010.0674
9933PUM3HTA11_99999965104_69814HumanColorectumMSS1.25e-046.60e-010.281
9933PUM3HTA11_99999974143_84620HumanColorectumMSS4.40e-18-4.75e-010.3005
9933PUM3A001-C-207HumanColorectumFAP8.84e-04-2.91e-010.1278
9933PUM3A015-C-203HumanColorectumFAP1.93e-30-3.90e-01-0.1294
9933PUM3A015-C-204HumanColorectumFAP9.03e-05-2.30e-01-0.0228
9933PUM3A014-C-040HumanColorectumFAP3.10e-03-2.94e-01-0.1184
9933PUM3A002-C-201HumanColorectumFAP3.33e-15-3.83e-010.0324
9933PUM3A002-C-203HumanColorectumFAP1.61e-05-1.65e-010.2786
9933PUM3A001-C-119HumanColorectumFAP7.40e-08-4.29e-01-0.1557
9933PUM3A001-C-108HumanColorectumFAP5.84e-16-1.77e-01-0.0272
9933PUM3A002-C-205HumanColorectumFAP6.25e-21-3.19e-01-0.1236
9933PUM3A001-C-104HumanColorectumFAP3.80e-05-1.40e-010.0184
9933PUM3A015-C-005HumanColorectumFAP2.14e-03-2.86e-01-0.0336
Page: 1 2 3 4 5 6 7 8 

check button Transcriptomic changes along malignancy continuum.
TissueExpression DynamicsAbbreviation
Colorectum (GSE201348)The image shows the transcriptomic changes along malignancy continuum.log2FC in expression of this searched gene in stem-like cells from each diseased tissue sample relative to stem-like cells in normal samples in each tissue plotted against the malignancy continuum. Samples are colored based on if they are from different disease stage.FAP: Familial adenomatous polyposis
CRC: Colorectal cancer
Colorectum (HTA11)The image shows the transcriptomic changes along malignancy continuum.log2FC in expression of this searched gene in stem-like cells from each diseased tissue sample relative to stem-like cells in normal samples in each tissue plotted against the malignancy continuum. Samples are colored based on if they are from different disease stage.AD: Adenomas
SER: Sessile serrated lesions
MSI-H: Microsatellite-high colorectal cancer
MSS: Microsatellite stable colorectal cancer
EsophagusThe image shows the transcriptomic changes along malignancy continuum.log2FC in expression of this searched gene in stem-like cells from each diseased tissue sample relative to stem-like cells in normal samples in each tissue plotted against the malignancy continuum. Samples are colored based on if they are from different disease stage.
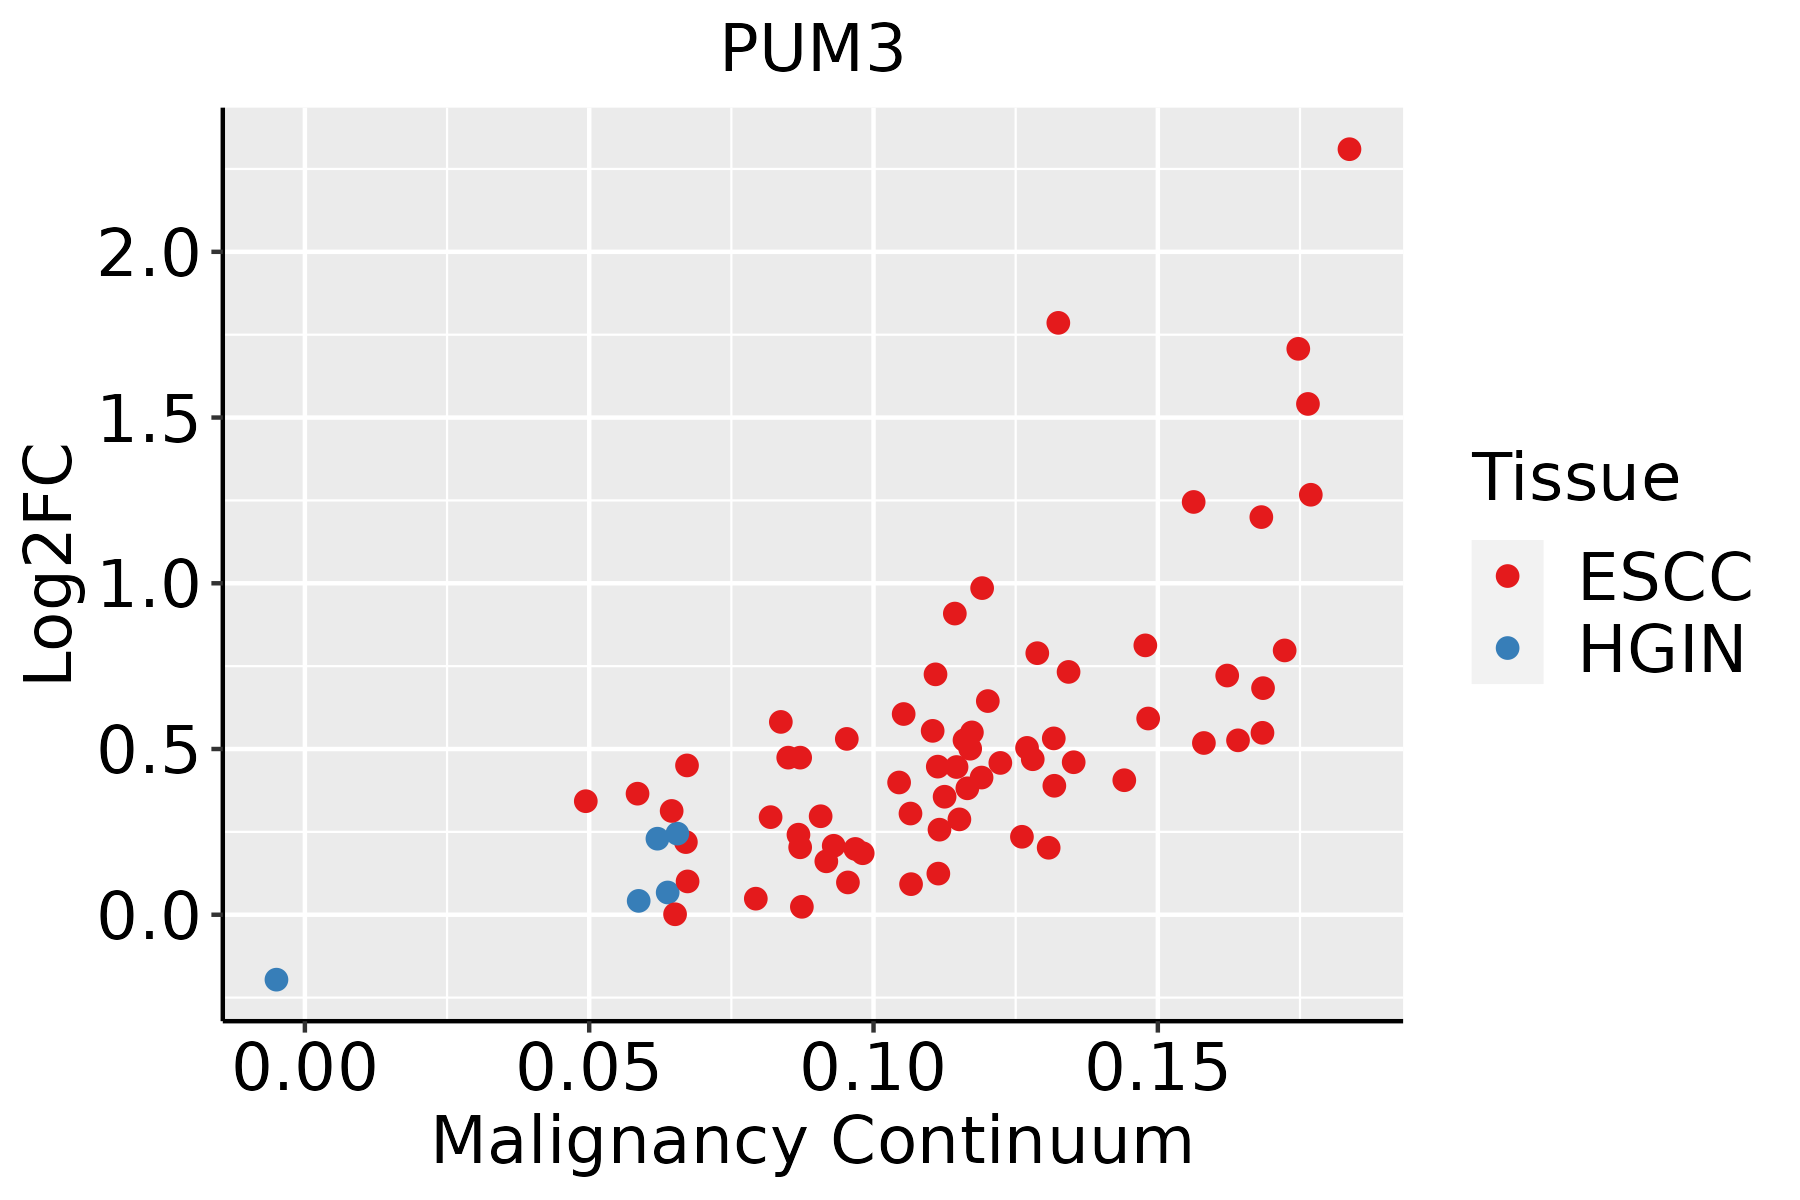
ESCC: Esophageal squamous cell carcinoma
HGIN: High-grade intraepithelial neoplasias
LGIN: Low-grade intraepithelial neoplasias
LiverThe image shows the transcriptomic changes along malignancy continuum.log2FC in expression of this searched gene in stem-like cells from each diseased tissue sample relative to stem-like cells in normal samples in each tissue plotted against the malignancy continuum. Samples are colored based on if they are from different disease stage.HCC: Hepatocellular carcinoma
NAFLD: Non-alcoholic fatty liver disease
Oral CavityThe image shows the transcriptomic changes along malignancy continuum.log2FC in expression of this searched gene in stem-like cells from each diseased tissue sample relative to stem-like cells in normal samples in each tissue plotted against the malignancy continuum. Samples are colored based on if they are from different disease stage.
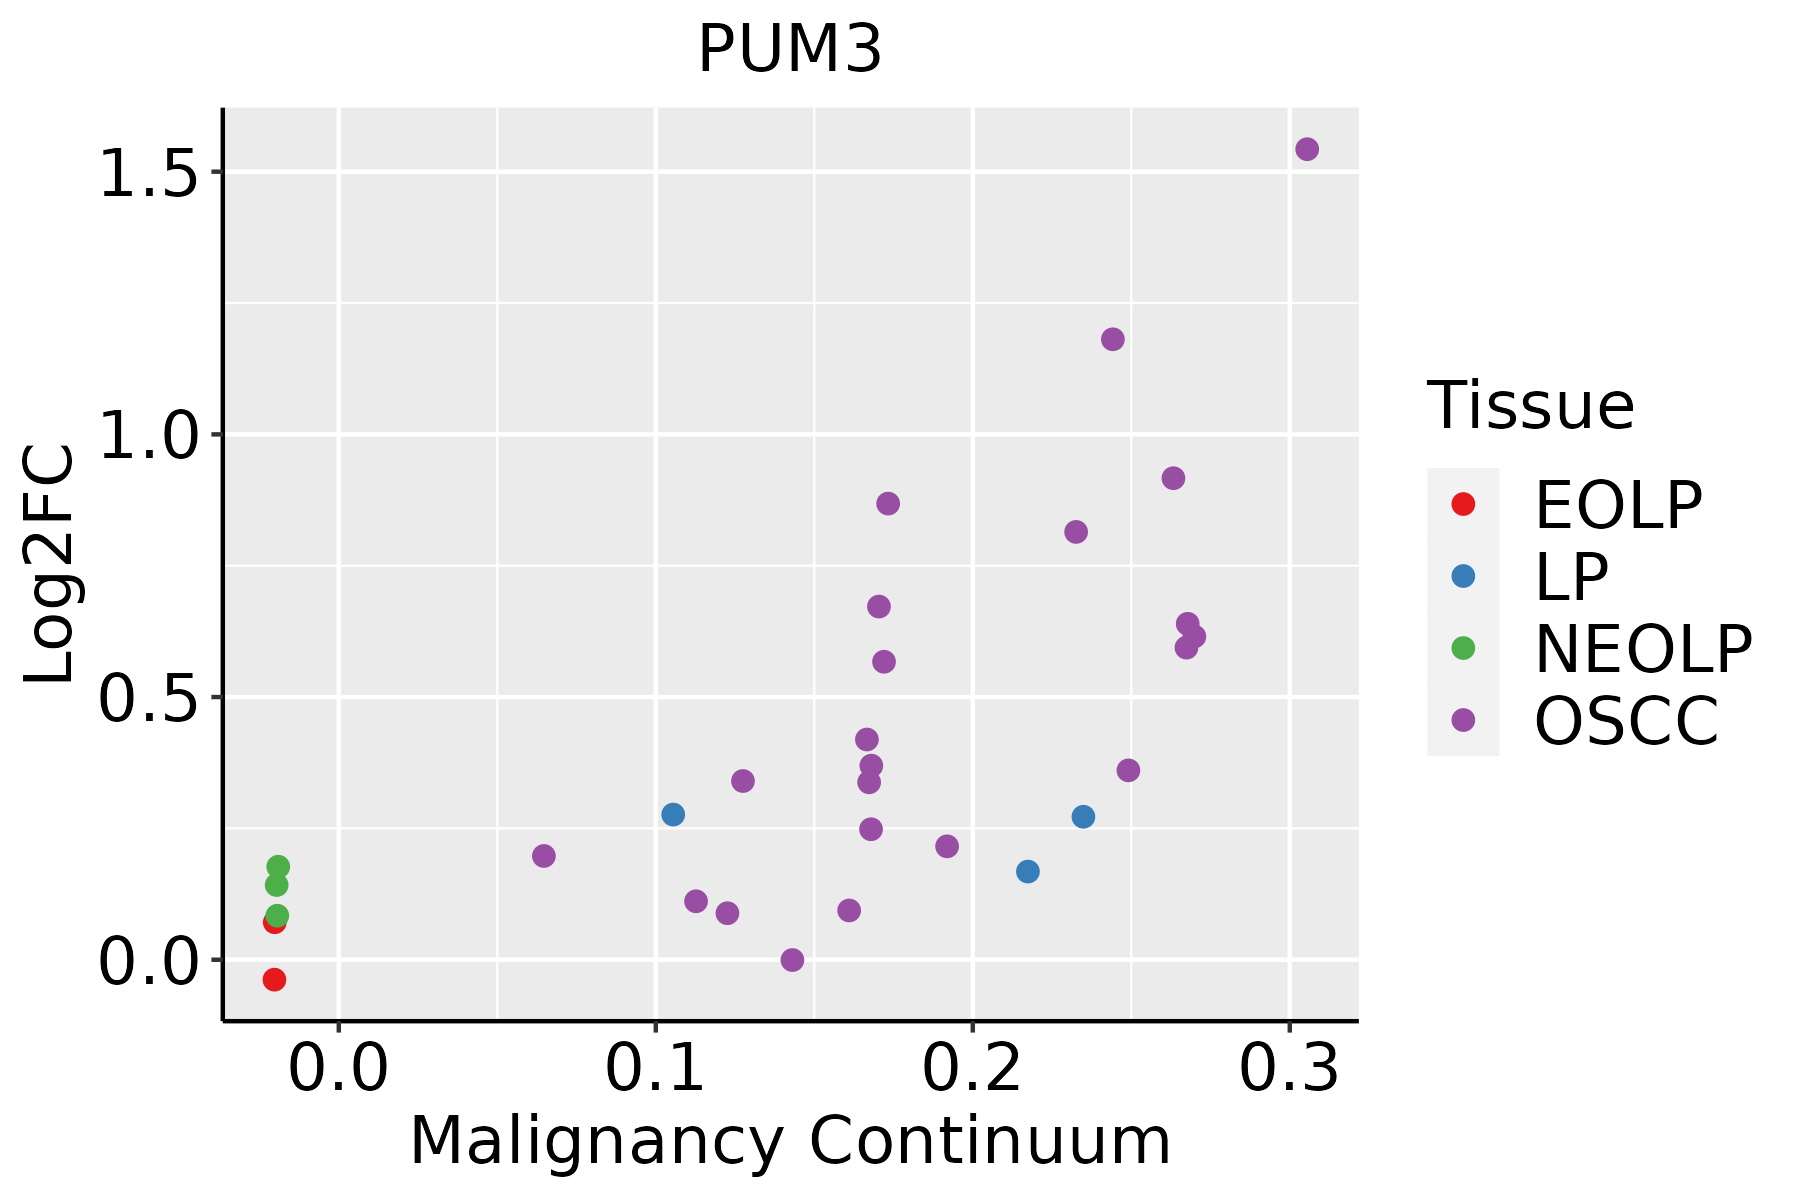
EOLP: Erosive Oral lichen planus
LP: leukoplakia
NEOLP: Non-erosive oral lichen planus
OSCC: Oral squamous cell carcinoma
ProstateThe image shows the transcriptomic changes along malignancy continuum.log2FC in expression of this searched gene in stem-like cells from each diseased tissue sample relative to stem-like cells in normal samples in each tissue plotted against the malignancy continuum. Samples are colored based on if they are from different disease stage.BPH: Benign Prostatic Hyperplasia
SkinThe image shows the transcriptomic changes along malignancy continuum.log2FC in expression of this searched gene in stem-like cells from each diseased tissue sample relative to stem-like cells in normal samples in each tissue plotted against the malignancy continuum. Samples are colored based on if they are from different disease stage.AK: Actinic keratosis
cSCC: Cutaneous squamous cell carcinoma
SCCIS:squamous cell carcinoma in situ
ThyroidThe image shows the transcriptomic changes along malignancy continuum.log2FC in expression of this searched gene in stem-like cells from each diseased tissue sample relative to stem-like cells in normal samples in each tissue plotted against the malignancy continuum. Samples are colored based on if they are from different disease stage.ATC: Anaplastic thyroid cancer
HT: Hashimoto's thyroiditis
PTC: Papillary thyroid cancer
∗log2FC in expression of this searched gene in stem-like cells from each diseased tissue sample relative to stem-like cells in normal samples in each tissue plotted against the malignancy continuum. Samples are colored based on if they are from different disease stage.

Top

Malignant transformation related pathway analysis

check buttonFind out the enriched GO biological processes and KEGG pathways involved in transition from healthy to precancer to cancer
check button Figure of enriched GO biological processes.
TissueDisease StageEnriched GO biological Processes
ColorectumADGO analysis - Figure of enriched GO biological processes: Top 15 enriched GO BP terms are showed in the bar plot of each disease state in each tissue. Each row represents a significant GO biological process which is colored according to the -log10(p.adjust).
ColorectumSERGO analysis - Figure of enriched GO biological processes: Top 15 enriched GO BP terms are showed in the bar plot of each disease state in each tissue. Each row represents a significant GO biological process which is colored according to the -log10(p.adjust).
ColorectumMSSGO analysis - Figure of enriched GO biological processes: Top 15 enriched GO BP terms are showed in the bar plot of each disease state in each tissue. Each row represents a significant GO biological process which is colored according to the -log10(p.adjust).
ColorectumMSI-HGO analysis - Figure of enriched GO biological processes: Top 15 enriched GO BP terms are showed in the bar plot of each disease state in each tissue. Each row represents a significant GO biological process which is colored according to the -log10(p.adjust).
ColorectumFAPGO analysis - Figure of enriched GO biological processes: Top 15 enriched GO BP terms are showed in the bar plot of each disease state in each tissue. Each row represents a significant GO biological process which is colored according to the -log10(p.adjust).
∗Top 15 enriched GO BP terms are showed in the bar plot of each disease state in each tissue. Each row represents a significant GO biological process which is colored according to the -log10(p.adjust).
Page: 1 2 3 4 5 6 7 8 9 

check button Enriched GO biological processes.
GO IDTissueDisease StageDescriptionGene RatioBg Ratiopvaluep.adjustCount
GO:0006417ColorectumADregulation of translation141/3918468/187231.32e-064.22e-05141
GO:00064172ColorectumMSSregulation of translation134/3467468/187234.43e-082.38e-06134
GO:00064174ColorectumFAPregulation of translation111/2622468/187238.47e-091.13e-06111
GO:00064175ColorectumCRCregulation of translation82/2078468/187231.79e-055.40e-0482
GO:0006417111EsophagusESCCregulation of translation304/8552468/187231.53e-171.33e-15304
GO:0006471EsophagusESCCprotein ADP-ribosylation24/855235/187235.25e-031.97e-0224
GO:000641722LiverHCCregulation of translation287/7958468/187238.79e-178.08e-15287
GO:000641720Oral cavityOSCCregulation of translation274/7305468/187234.39e-184.63e-16274
GO:000641734Oral cavityNEOLPregulation of translation97/2005468/187239.94e-111.05e-0897
GO:000641718ProstateBPHregulation of translation157/3107468/187239.09e-205.63e-17157
GO:000641719ProstateTumorregulation of translation161/3246468/187231.55e-198.74e-17161
GO:000641728SkinAKregulation of translation102/1910468/187236.79e-142.36e-11102
GO:0006417112SkinSCCISregulation of translation41/919468/187232.48e-044.52e-0341
GO:000641729SkincSCCregulation of translation226/4864468/187238.78e-262.62e-23226
GO:0006417113ThyroidPTCregulation of translation236/5968468/187232.70e-172.52e-15236
GO:00064712ThyroidPTCprotein ADP-ribosylation18/596835/187231.26e-024.90e-0218
GO:000641735ThyroidATCregulation of translation236/6293468/187232.39e-141.34e-12236
GO:00064711ThyroidATCprotein ADP-ribosylation19/629335/187239.36e-033.44e-0219
Page: 1 

check button Enriched KEGG pathways.
Pathway IDTissueDisease StageDescriptionGene RatioBg Ratiopvaluep.adjustqvalueCount
Page: 1 

Top

Cell-cell communication analysis

check buttonIdentification of potential cell-cell interactions between two cell types and their ligand-receptor pairs for different disease states
LigandReceptorLRpairPathwayTissueDisease Stage
Page: 1 

Top

Single-cell gene regulatory network inference analysis

check buttonFind out the significant the regulons (TFs) and the target genes of each regulon across cell types for different disease states
TFCell TypeTissueDisease StageTarget GeneRSSRegulon Activity
PUM3NKLiverCirrhoticBBC3,IL13RA1,SYNGR2, etc.1.92e-01The dot plots of a searched regulon are shown for all cell subpopulations in each disease state of each tissue based on the regulon specific score inferred using pySCENIC and by calculating the average expression.
PUM3MAITLiverCirrhoticBBC3,IL13RA1,SYNGR2, etc.4.13e-02The dot plots of a searched regulon are shown for all cell subpopulations in each disease state of each tissue based on the regulon specific score inferred using pySCENIC and by calculating the average expression.
PUM3CHIEFStomachCAGNCL,KNOP1,TCERG1, etc.1.37e-01The dot plots of a searched regulon are shown for all cell subpopulations in each disease state of each tissue based on the regulon specific score inferred using pySCENIC and by calculating the average expression.
PUM3GMCStomachCAGNCL,KNOP1,TCERG1, etc.4.87e-02The dot plots of a searched regulon are shown for all cell subpopulations in each disease state of each tissue based on the regulon specific score inferred using pySCENIC and by calculating the average expression.
PUM3STMStomachCAGNCL,KNOP1,TCERG1, etc.1.55e-01The dot plots of a searched regulon are shown for all cell subpopulations in each disease state of each tissue based on the regulon specific score inferred using pySCENIC and by calculating the average expression.
PUM3STMStomachWIMNCL,KNOP1,TCERG1, etc.2.49e-01The dot plots of a searched regulon are shown for all cell subpopulations in each disease state of each tissue based on the regulon specific score inferred using pySCENIC and by calculating the average expression.
PUM3iATCThyroidADJGPATCH4,MTCL1,NOP16, etc.7.67e-02The dot plots of a searched regulon are shown for all cell subpopulations in each disease state of each tissue based on the regulon specific score inferred using pySCENIC and by calculating the average expression.
PUM3TFCThyroidATCGPATCH4,MTCL1,NOP16, etc.4.51e-02The dot plots of a searched regulon are shown for all cell subpopulations in each disease state of each tissue based on the regulon specific score inferred using pySCENIC and by calculating the average expression.
PUM3TFCThyroidHealthyPIAS1,SCNM1,FDPS, etc.3.28e-01The dot plots of a searched regulon are shown for all cell subpopulations in each disease state of each tissue based on the regulon specific score inferred using pySCENIC and by calculating the average expression.
PUM3TFCThyroidHTGPATCH4,MTCL1,NOP16, etc.3.58e-02The dot plots of a searched regulon are shown for all cell subpopulations in each disease state of each tissue based on the regulon specific score inferred using pySCENIC and by calculating the average expression.
∗The dot plots of a searched regulon are shown for all cell subpopulations in each disease state of each tissue based on the regulon specific score inferred using pySCENIC and by calculating the average expression.
Page: 1 2 

Top

Somatic mutation of malignant transformation related genes

check buttonAnnotation of somatic variants for genes involved in malignant transformation
Hugo SymbolVariant ClassVariant ClassificationdbSNP RSHGVScHGVSpHGVSp ShortSWISSPROTBIOTYPESIFTPolyPhenTumor Sample BarcodeTissueHistologySexAgeStageTherapy TypesDrugsOutcome
PUM3SNVMissense_Mutationc.1306A>Cp.Lys436Glnp.K436QQ15397protein_codingtolerated(0.16)benign(0.155)TCGA-A2-A04T-01Breastbreast invasive carcinomaFemale<65I/IIChemotherapycyclophosphamideSD
PUM3SNVMissense_Mutationc.1130C>Ap.Pro377Hisp.P377HQ15397protein_codingdeleterious(0)possibly_damaging(0.894)TCGA-A8-A085-01Breastbreast invasive carcinomaMale<65I/IIHormone TherapytamoxiphenSD
PUM3SNVMissense_Mutationrs551241677c.1426N>Ap.Glu476Lysp.E476KQ15397protein_codingtolerated(0.54)benign(0.015)TCGA-AC-A23H-01Breastbreast invasive carcinomaFemale>=65I/IIUnknownUnknownPD
PUM3SNVMissense_Mutationrs755791650c.644N>Tp.Ser215Leup.S215LQ15397protein_codingdeleterious(0.01)possibly_damaging(0.489)TCGA-AN-A046-01Breastbreast invasive carcinomaFemale>=65I/IIUnknownUnknownSD
PUM3SNVMissense_Mutationnovelc.1549T>Cp.Ser517Prop.S517PQ15397protein_codingtolerated(0.14)benign(0.039)TCGA-BH-A0HO-01Breastbreast invasive carcinomaFemale<65I/IIChemotherapycyclophosphamideSD
PUM3SNVMissense_Mutationc.1633N>Cp.Glu545Glnp.E545QQ15397protein_codingtolerated(0.64)benign(0.05)TCGA-D8-A1J8-01Breastbreast invasive carcinomaFemale>=65I/IIHormone TherapynolvadexSD
PUM3insertionFrame_Shift_Insnovelc.703_704insAAATACATp.Ile235LysfsTer11p.I235Kfs*11Q15397protein_codingTCGA-AC-A3QQ-01Breastbreast invasive carcinomaFemale<65I/IIUnknownUnknownSD
PUM3deletionFrame_Shift_Delnovelc.1542delNp.Leu515TrpfsTer12p.L515Wfs*12Q15397protein_codingTCGA-D8-A27V-01Breastbreast invasive carcinomaFemale<65I/IIHormone TherapytamoxiphenSD
PUM3deletionFrame_Shift_Delnovelc.1392delNp.Gly465GlufsTer19p.G465Efs*19Q15397protein_codingTCGA-D8-A27V-01Breastbreast invasive carcinomaFemale<65I/IIHormone TherapytamoxiphenSD
PUM3SNVMissense_Mutationc.662A>Gp.Lys221Argp.K221RQ15397protein_codingtolerated(0.05)possibly_damaging(0.572)TCGA-FU-A3HZ-01Cervixcervical & endocervical cancerFemale<65I/IIChemotherapycisplatinCR
Page: 1 2 3 4 5 6 7 

Top

Related drugs of malignant transformation related genes

check buttonIdentification of chemicals and drugs interact with genes involved in malignant transfromation
(DGIdb 4.0)
Entrez IDSymbolCategoryInteraction TypesDrug Claim NameDrug NamePMIDs
Page: 1