
|
|||||
|
 | |
| |
| |
| |
| |
| |
|
Gene: PUM2 |
Gene summary for PUM2 |
| Gene information | Species | Human | Gene symbol | PUM2 | Gene ID | 23369 |
| Gene name | pumilio RNA binding family member 2 | |
| Gene Alias | PUMH2 | |
| Cytomap | 2p24.1 | |
| Gene Type | protein-coding | GO ID | GO:0002221 | UniProtAcc | Q8TB72 |
Top |
Malignant transformation analysis |
| Identification of the aberrant gene expression in precancerous and cancerous lesions by comparing the gene expression of stem-like cells in diseased tissues with normal stem cells |
| Entrez ID | Symbol | Replicates | Species | Organ | Tissue | Adj P-value | Log2FC | Malignancy |
| 23369 | PUM2 | CCI_1 | Human | Cervix | CC | 5.47e-06 | 1.19e+00 | 0.528 |
| 23369 | PUM2 | CCI_2 | Human | Cervix | CC | 6.93e-18 | 1.64e+00 | 0.5249 |
| 23369 | PUM2 | CCI_3 | Human | Cervix | CC | 5.01e-14 | 1.07e+00 | 0.516 |
| 23369 | PUM2 | HTA11_3410_2000001011 | Human | Colorectum | AD | 1.92e-41 | -8.66e-01 | 0.0155 |
| 23369 | PUM2 | HTA11_2487_2000001011 | Human | Colorectum | SER | 2.68e-13 | -6.32e-01 | -0.1808 |
| 23369 | PUM2 | HTA11_2951_2000001011 | Human | Colorectum | AD | 2.43e-03 | -6.95e-01 | 0.0216 |
| 23369 | PUM2 | HTA11_3361_2000001011 | Human | Colorectum | AD | 4.84e-11 | -6.62e-01 | -0.1207 |
| 23369 | PUM2 | HTA11_83_2000001011 | Human | Colorectum | SER | 1.63e-08 | -5.97e-01 | -0.1526 |
| 23369 | PUM2 | HTA11_696_2000001011 | Human | Colorectum | AD | 1.91e-22 | -5.98e-01 | -0.1464 |
| 23369 | PUM2 | HTA11_866_2000001011 | Human | Colorectum | AD | 1.01e-10 | -4.80e-01 | -0.1001 |
| 23369 | PUM2 | HTA11_1391_2000001011 | Human | Colorectum | AD | 1.55e-02 | -4.05e-01 | -0.059 |
| 23369 | PUM2 | HTA11_2992_2000001011 | Human | Colorectum | SER | 2.31e-02 | -6.30e-01 | -0.1706 |
| 23369 | PUM2 | HTA11_5212_2000001011 | Human | Colorectum | AD | 3.34e-08 | -7.74e-01 | -0.2061 |
| 23369 | PUM2 | HTA11_5216_2000001011 | Human | Colorectum | SER | 6.64e-03 | -5.18e-01 | -0.1462 |
| 23369 | PUM2 | HTA11_546_2000001011 | Human | Colorectum | AD | 9.20e-08 | -6.19e-01 | -0.0842 |
| 23369 | PUM2 | HTA11_7862_2000001011 | Human | Colorectum | AD | 7.87e-11 | -7.21e-01 | -0.0179 |
| 23369 | PUM2 | HTA11_866_3004761011 | Human | Colorectum | AD | 5.28e-16 | -6.88e-01 | 0.096 |
| 23369 | PUM2 | HTA11_4255_2000001011 | Human | Colorectum | SER | 9.81e-03 | -6.26e-01 | 0.0446 |
| 23369 | PUM2 | HTA11_8622_2000001021 | Human | Colorectum | SER | 4.82e-06 | -7.07e-01 | 0.0528 |
| 23369 | PUM2 | HTA11_10623_2000001011 | Human | Colorectum | AD | 1.96e-06 | -4.75e-01 | -0.0177 |
| Page: 1 2 3 4 5 6 7 8 9 10 11 12 |
| Tissue | Expression Dynamics | Abbreviation |
| Cervix | 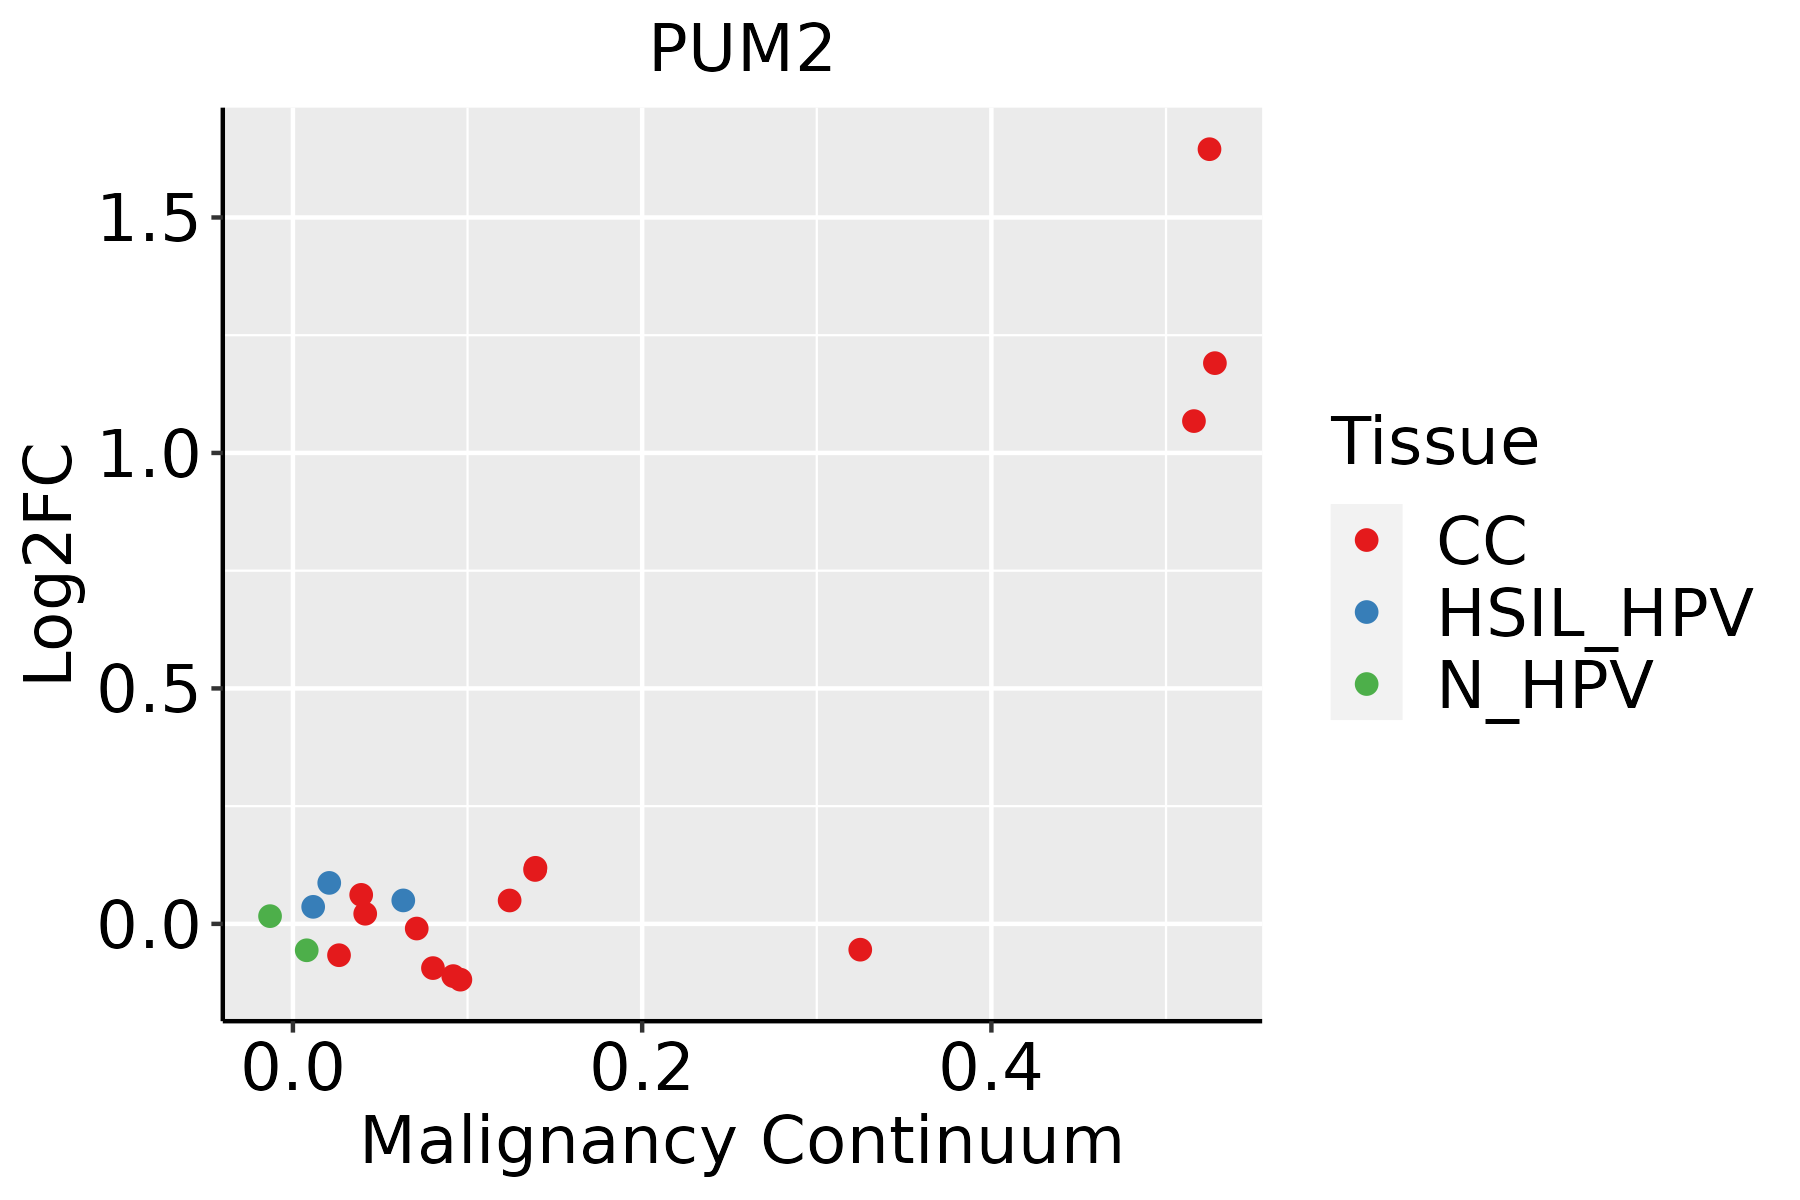 | CC: Cervix cancer |
| HSIL_HPV: HPV-infected high-grade squamous intraepithelial lesions | ||
| N_HPV: HPV-infected normal cervix | ||
| Colorectum (GSE201348) |  | FAP: Familial adenomatous polyposis |
| CRC: Colorectal cancer | ||
| Colorectum (HTA11) |  | AD: Adenomas |
| SER: Sessile serrated lesions | ||
| MSI-H: Microsatellite-high colorectal cancer | ||
| MSS: Microsatellite stable colorectal cancer | ||
| Endometrium | 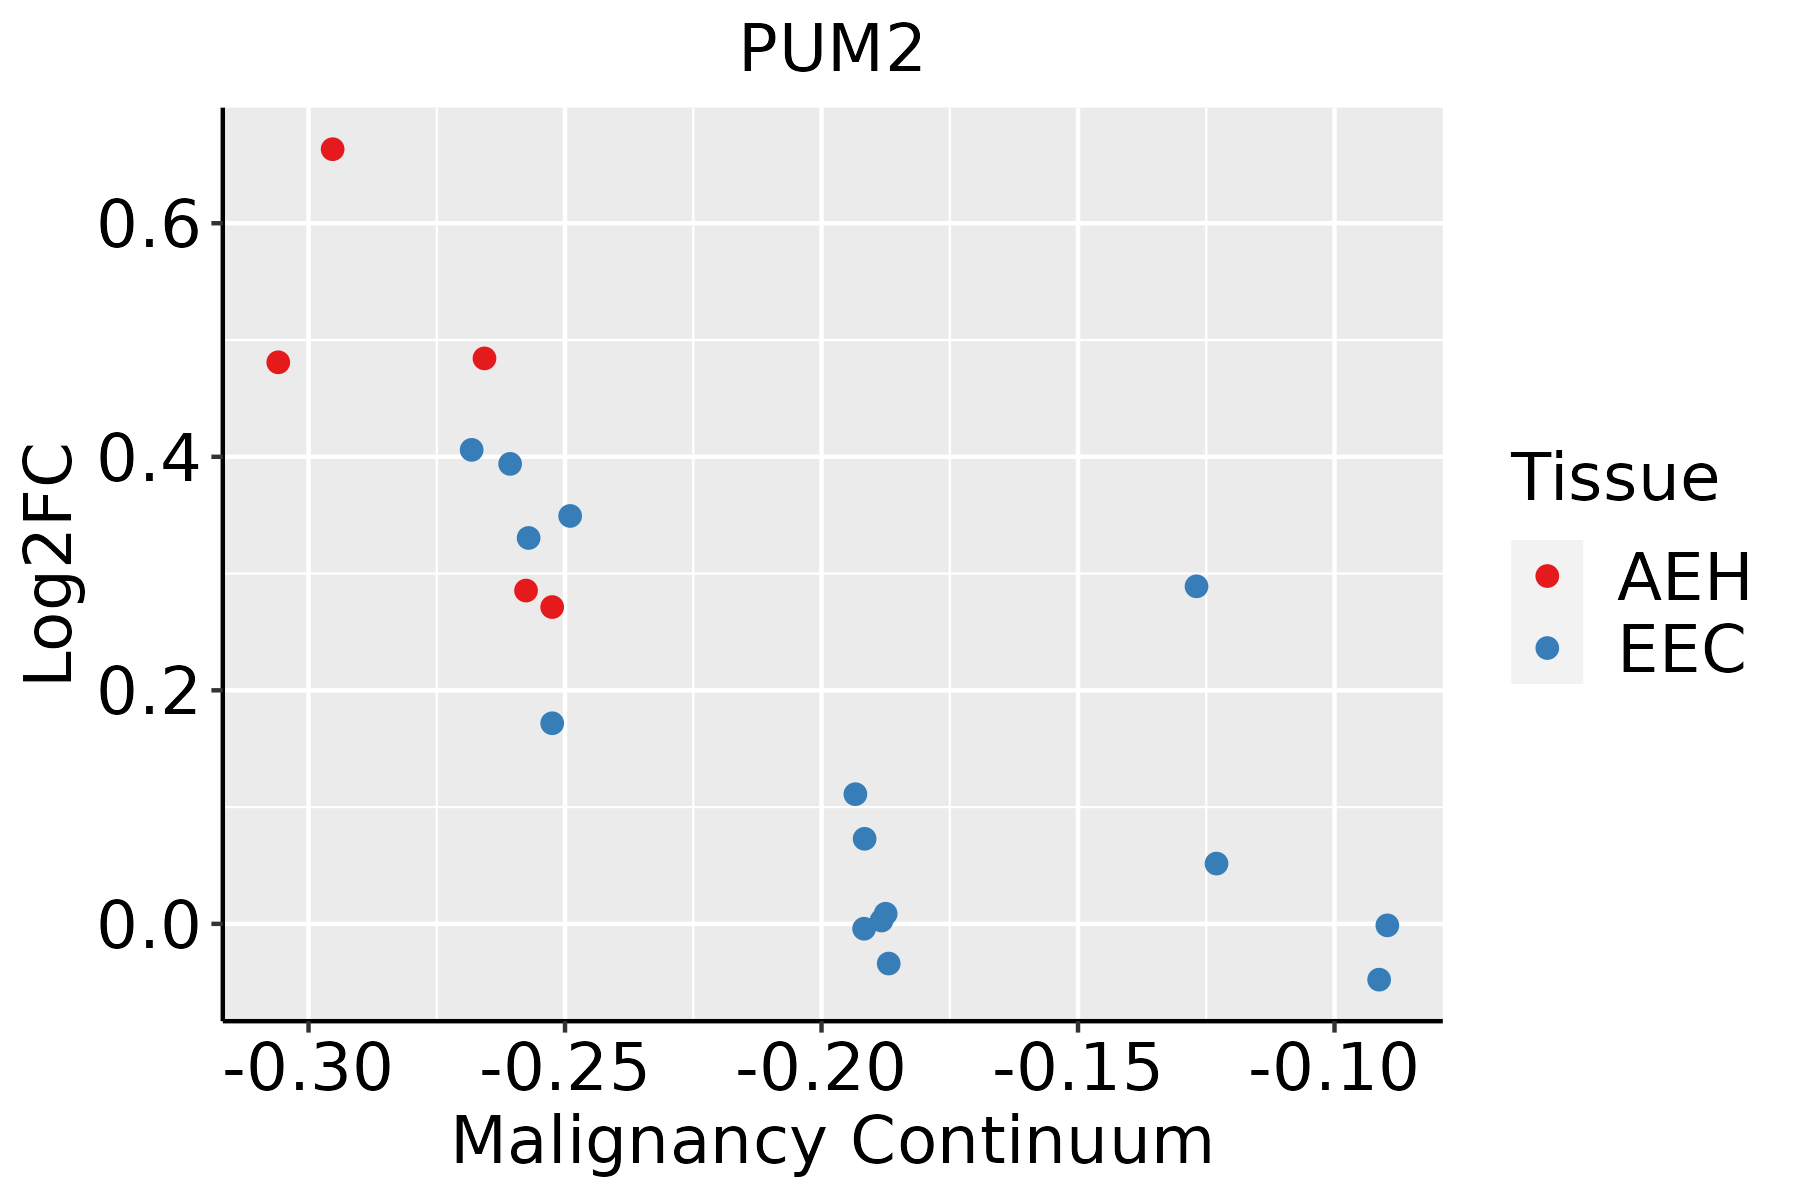 | AEH: Atypical endometrial hyperplasia |
| EEC: Endometrioid Cancer | ||
| Esophagus |  | ESCC: Esophageal squamous cell carcinoma |
| HGIN: High-grade intraepithelial neoplasias | ||
| LGIN: Low-grade intraepithelial neoplasias | ||
| Liver | 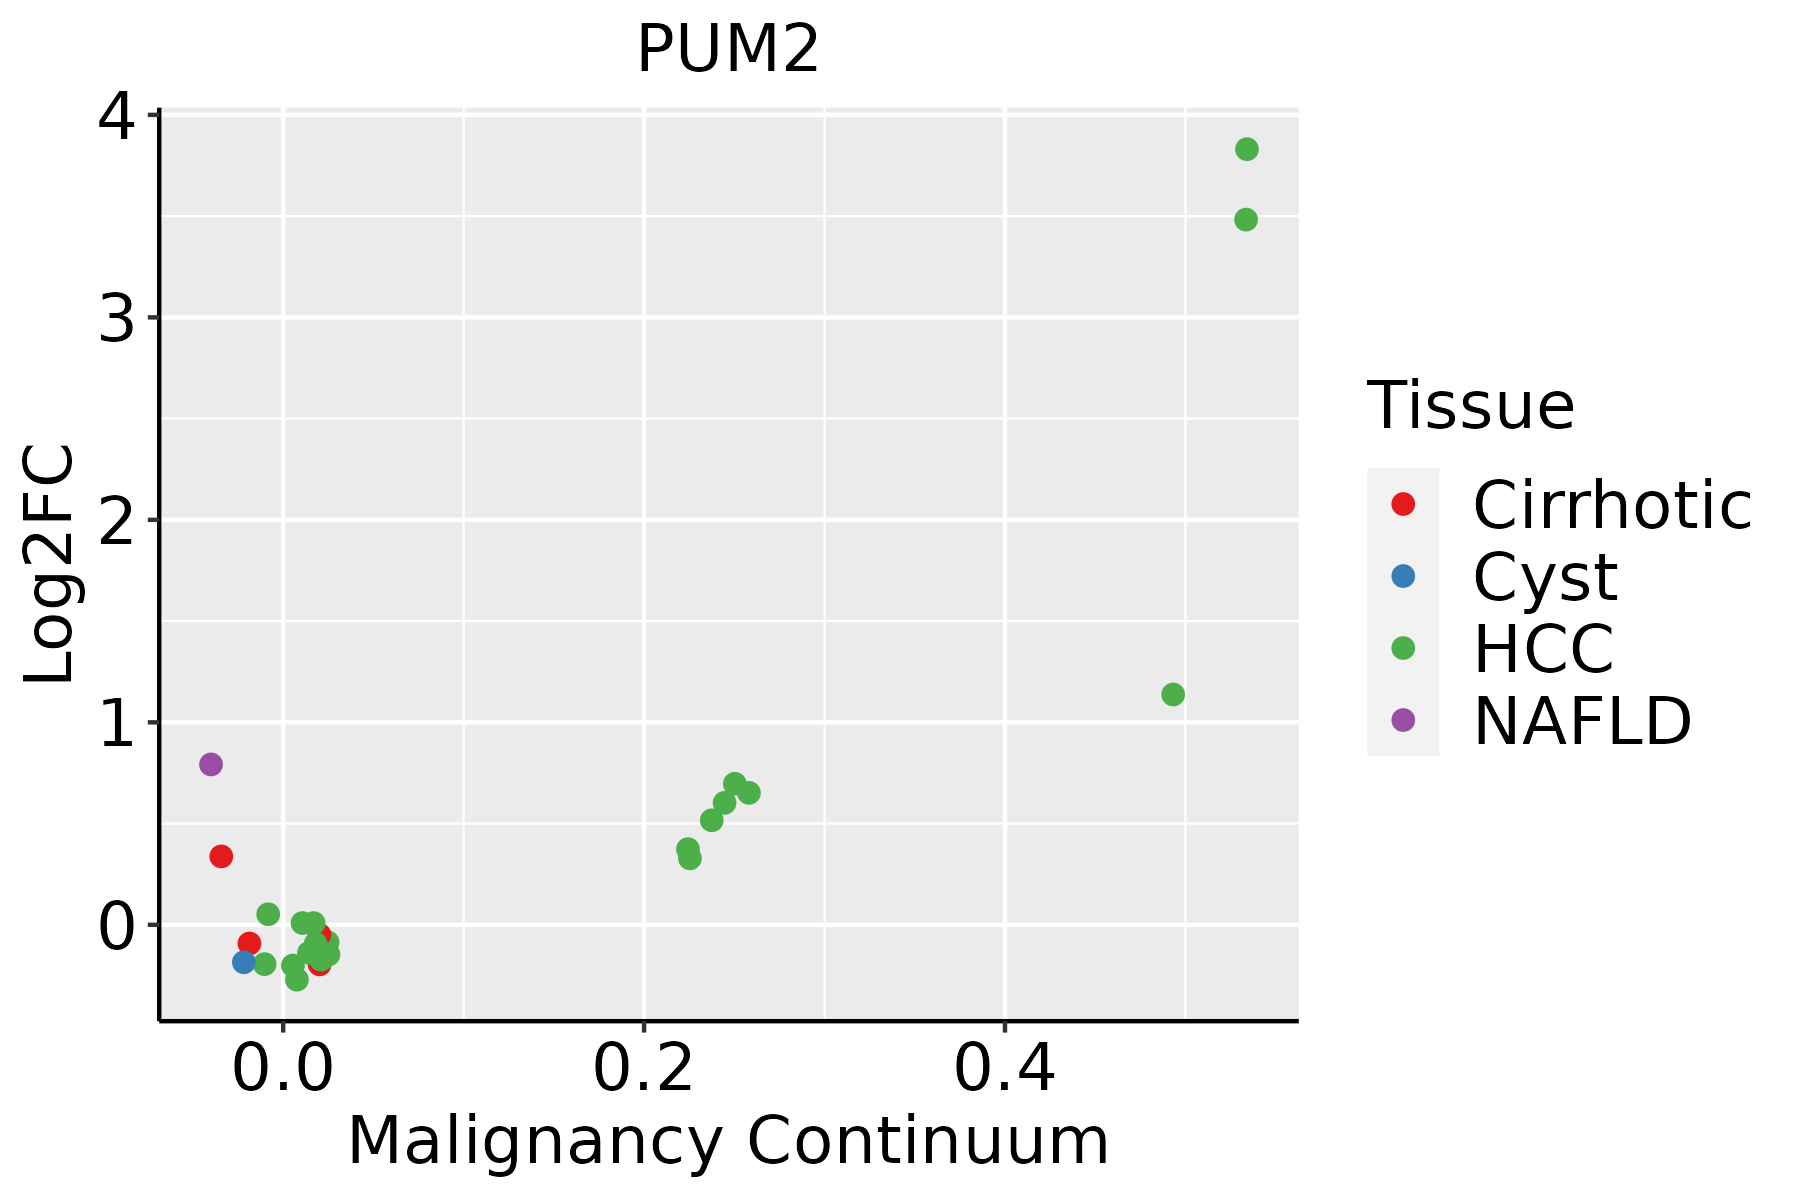 | HCC: Hepatocellular carcinoma |
| NAFLD: Non-alcoholic fatty liver disease | ||
| Lung | 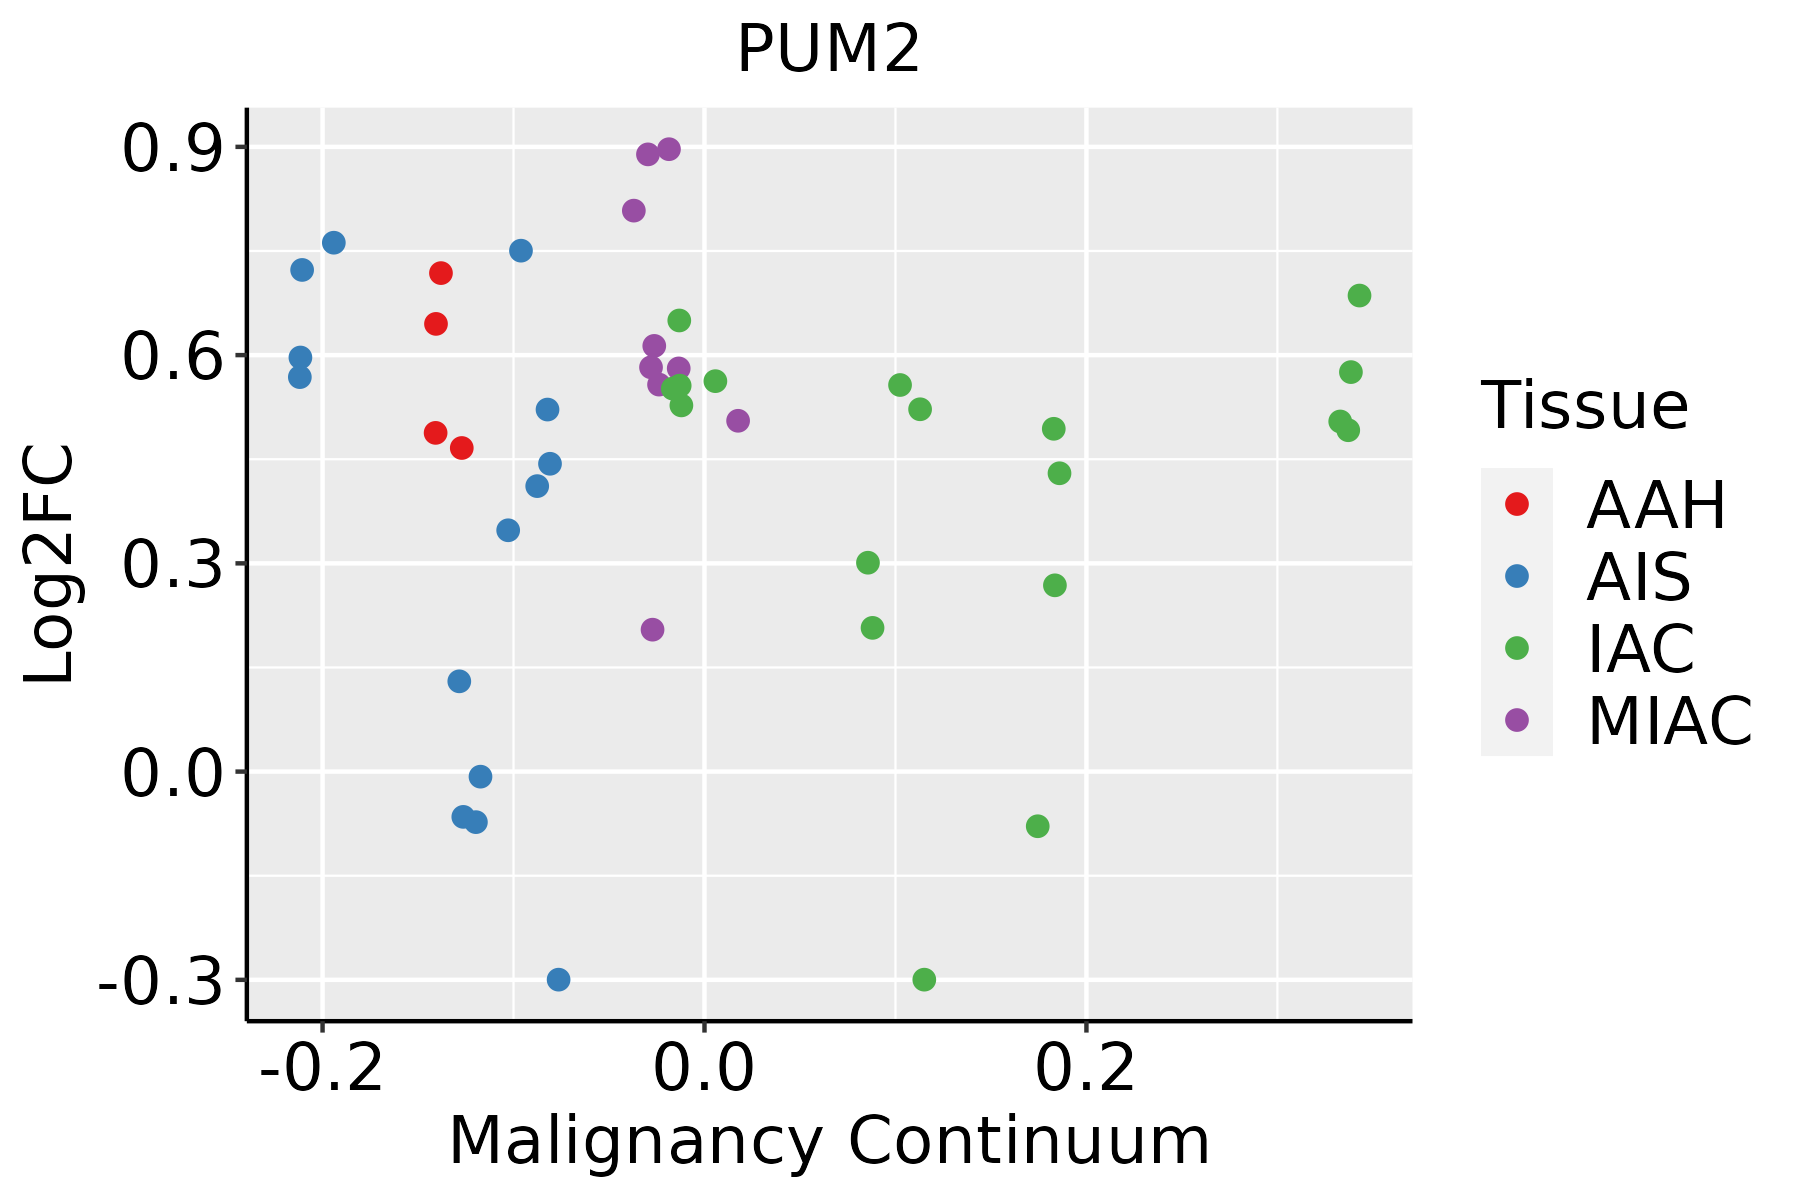 | AAH: Atypical adenomatous hyperplasia |
| AIS: Adenocarcinoma in situ | ||
| IAC: Invasive lung adenocarcinoma | ||
| MIA: Minimally invasive adenocarcinoma | ||
| Prostate | 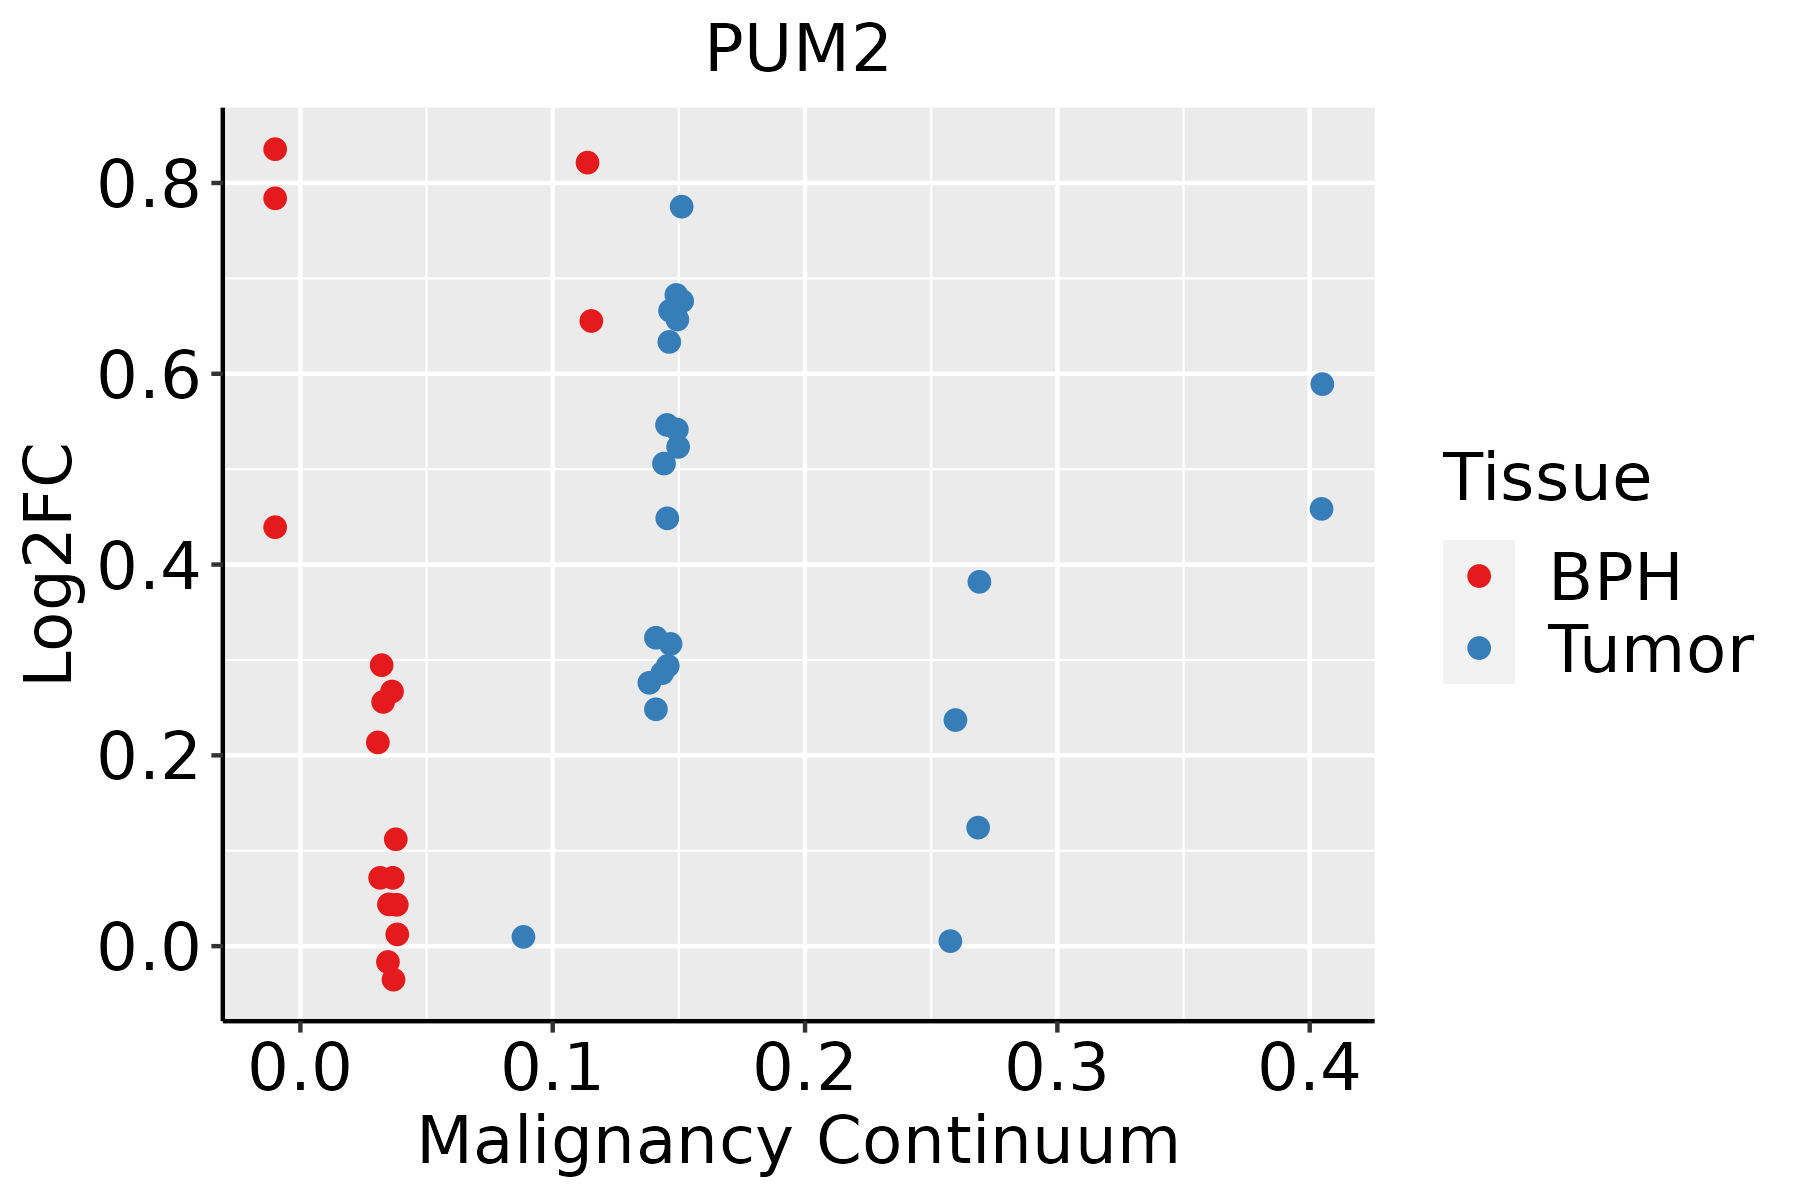 | BPH: Benign Prostatic Hyperplasia |
| Skin | 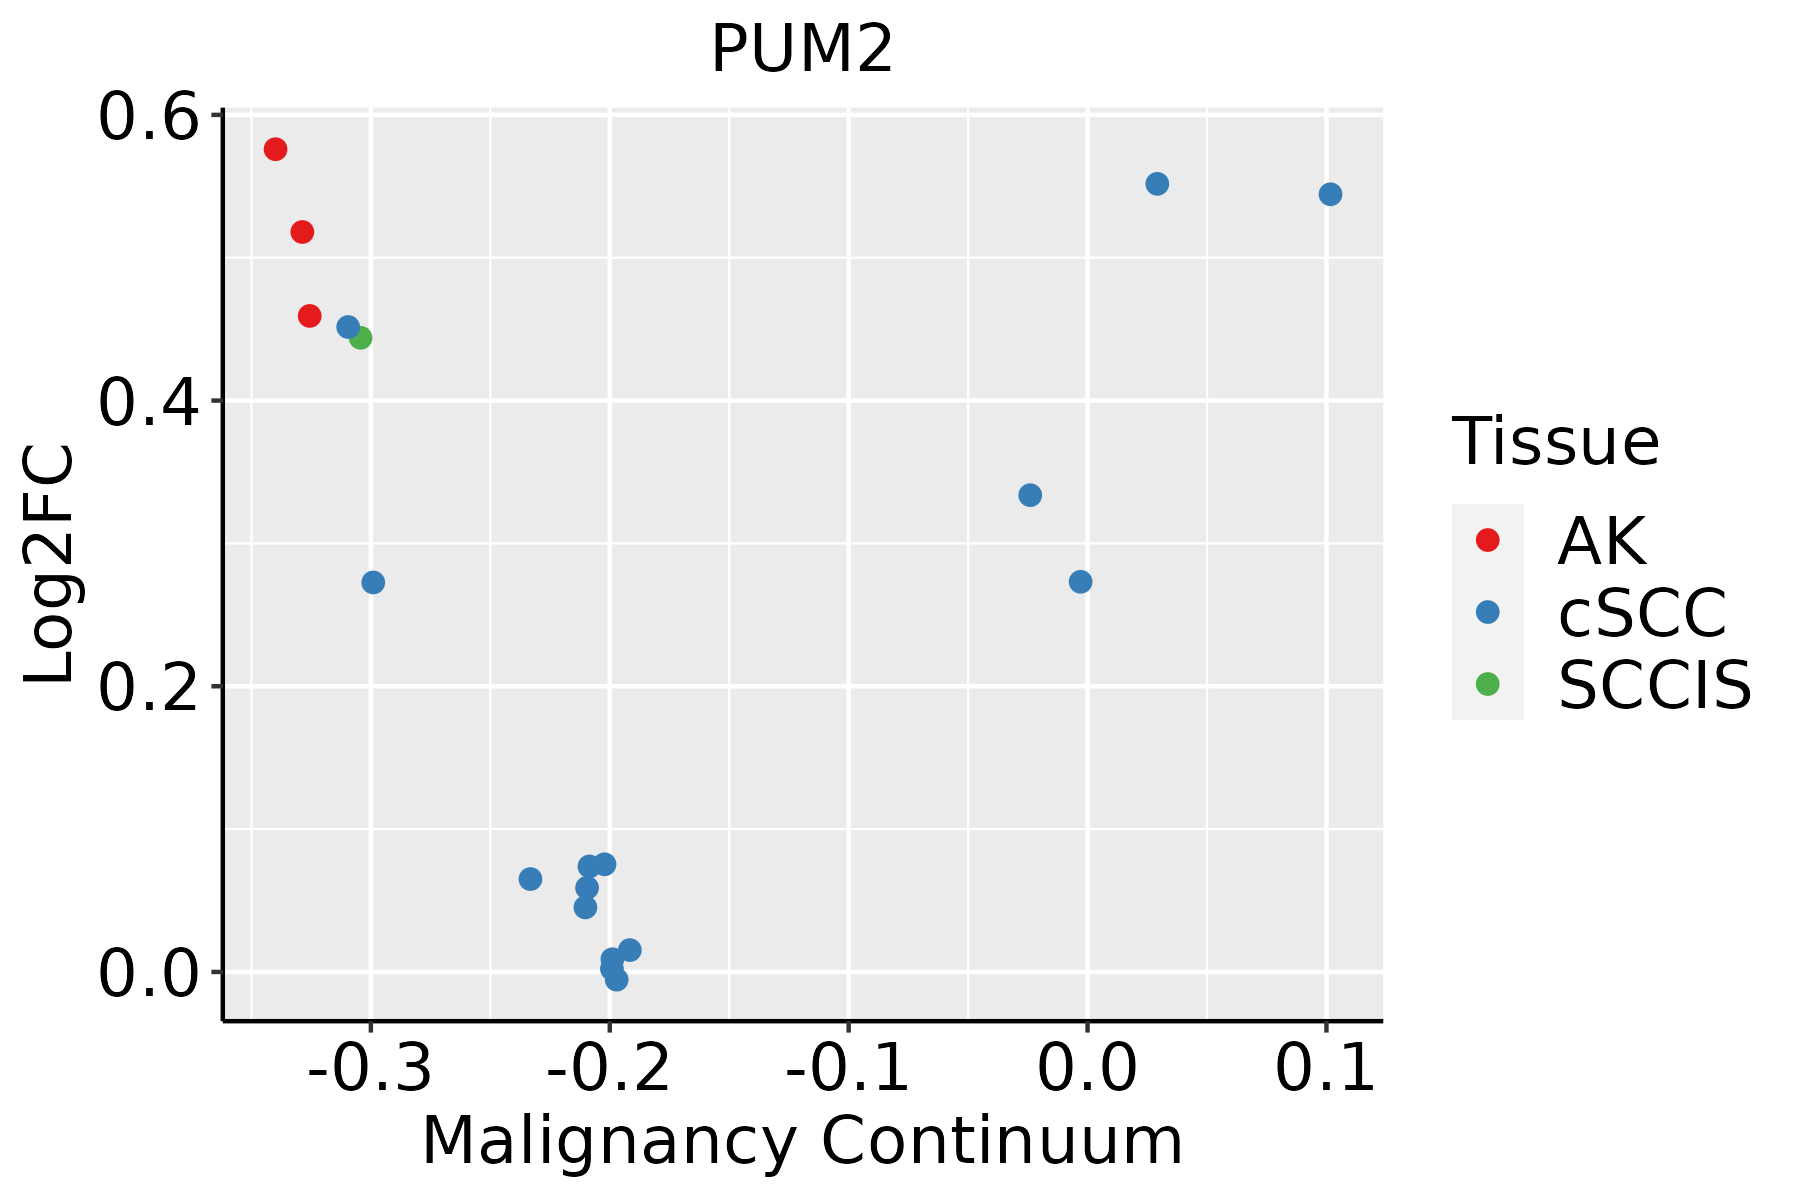 | AK: Actinic keratosis |
| cSCC: Cutaneous squamous cell carcinoma | ||
| SCCIS:squamous cell carcinoma in situ | ||
| Thyroid | 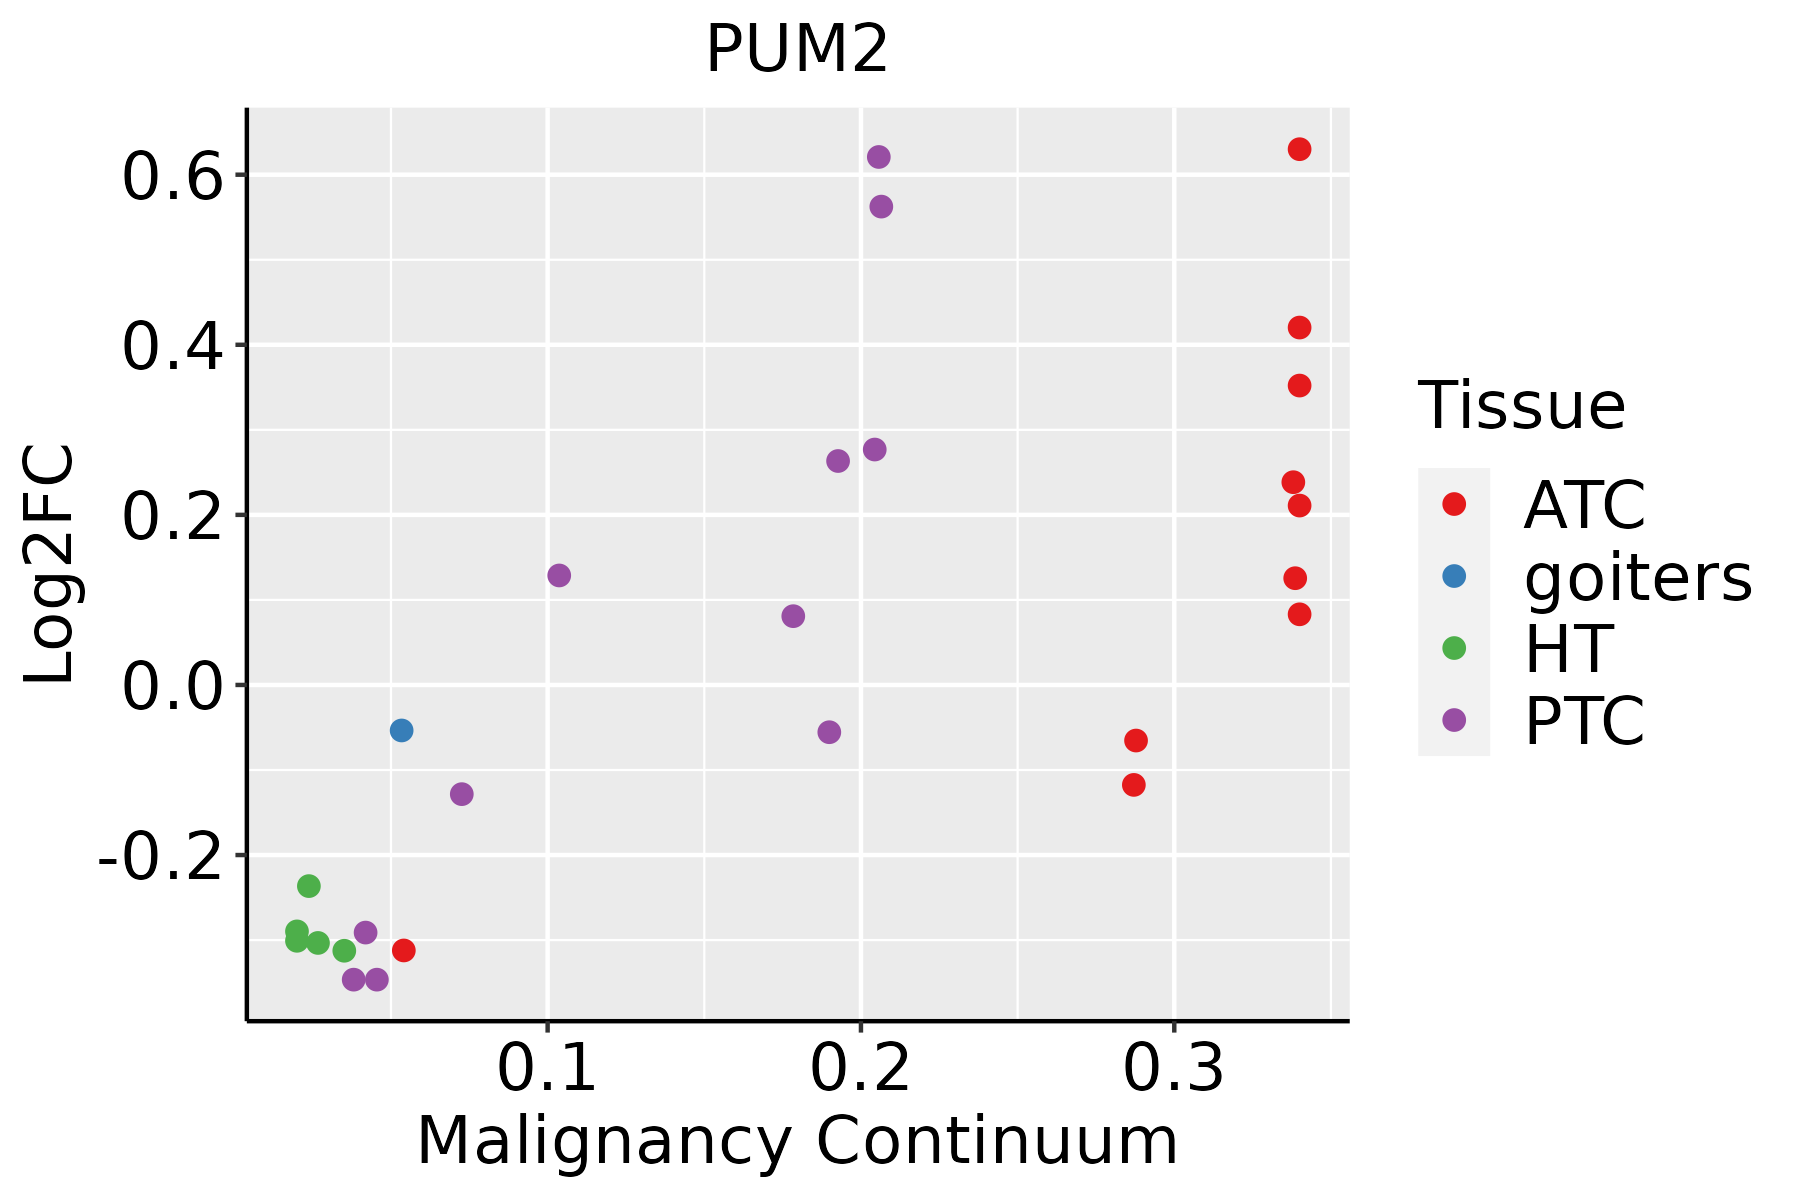 | ATC: Anaplastic thyroid cancer |
| HT: Hashimoto's thyroiditis | ||
| PTC: Papillary thyroid cancer |
| ∗log2FC in expression of this searched gene in stem-like cells from each diseased tissue sample relative to stem-like cells in normal samples in each tissue plotted against the malignancy continuum. Samples are colored based on if they are from different disease stage. |
Top |
Malignant transformation related pathway analysis |
| Find out the enriched GO biological processes and KEGG pathways involved in transition from healthy to precancer to cancer |
| Tissue | Disease Stage | Enriched GO biological Processes |
| Colorectum | AD |  |
| Colorectum | SER |  |
| Colorectum | MSS |  |
| Colorectum | MSI-H |  |
| Colorectum | FAP |  |
| ∗Top 15 enriched GO BP terms are showed in the bar plot of each disease state in each tissue. Each row represents a significant GO biological process which is colored according to the -log10(p.adjust). |
| Page: 1 2 3 4 5 6 7 8 9 |
| GO ID | Tissue | Disease Stage | Description | Gene Ratio | Bg Ratio | pvalue | p.adjust | Count |
| GO:00321035 | Cervix | CC | positive regulation of response to external stimulus | 95/2311 | 427/18723 | 5.44e-09 | 5.03e-07 | 95 |
| GO:00027644 | Cervix | CC | immune response-regulating signaling pathway | 97/2311 | 468/18723 | 1.49e-07 | 7.07e-06 | 97 |
| GO:00064029 | Cervix | CC | mRNA catabolic process | 56/2311 | 232/18723 | 4.81e-07 | 1.83e-05 | 56 |
| GO:19033119 | Cervix | CC | regulation of mRNA metabolic process | 64/2311 | 288/18723 | 1.71e-06 | 5.64e-05 | 64 |
| GO:00305229 | Cervix | CC | intracellular receptor signaling pathway | 60/2311 | 265/18723 | 1.89e-06 | 5.97e-05 | 60 |
| GO:00064019 | Cervix | CC | RNA catabolic process | 62/2311 | 278/18723 | 2.18e-06 | 6.56e-05 | 62 |
| GO:00028315 | Cervix | CC | regulation of response to biotic stimulus | 67/2311 | 327/18723 | 1.79e-05 | 3.36e-04 | 67 |
| GO:000641710 | Cervix | CC | regulation of translation | 89/2311 | 468/18723 | 1.86e-05 | 3.46e-04 | 89 |
| GO:00096158 | Cervix | CC | response to virus | 73/2311 | 367/18723 | 2.22e-05 | 3.95e-04 | 73 |
| GO:00610139 | Cervix | CC | regulation of mRNA catabolic process | 38/2311 | 166/18723 | 1.07e-04 | 1.36e-03 | 38 |
| GO:00022212 | Cervix | CC | pattern recognition receptor signaling pathway | 39/2311 | 172/18723 | 1.08e-04 | 1.38e-03 | 39 |
| GO:00622073 | Cervix | CC | regulation of pattern recognition receptor signaling pathway | 27/2311 | 105/18723 | 1.37e-04 | 1.68e-03 | 27 |
| GO:00027534 | Cervix | CC | cytoplasmic pattern recognition receptor signaling pathway | 18/2311 | 60/18723 | 2.26e-04 | 2.55e-03 | 18 |
| GO:00467008 | Cervix | CC | heterocycle catabolic process | 80/2311 | 445/18723 | 3.23e-04 | 3.42e-03 | 80 |
| GO:00346559 | Cervix | CC | nucleobase-containing compound catabolic process | 74/2311 | 407/18723 | 3.77e-04 | 3.88e-03 | 74 |
| GO:00434889 | Cervix | CC | regulation of mRNA stability | 35/2311 | 158/18723 | 3.80e-04 | 3.89e-03 | 35 |
| GO:00434879 | Cervix | CC | regulation of RNA stability | 36/2311 | 170/18723 | 7.72e-04 | 6.86e-03 | 36 |
| GO:00442709 | Cervix | CC | cellular nitrogen compound catabolic process | 79/2311 | 451/18723 | 7.80e-04 | 6.91e-03 | 79 |
| GO:00395292 | Cervix | CC | RIG-I signaling pathway | 10/2311 | 27/18723 | 9.25e-04 | 7.84e-03 | 10 |
| GO:00028331 | Cervix | CC | positive regulation of response to biotic stimulus | 35/2311 | 168/18723 | 1.23e-03 | 9.87e-03 | 35 |
| Page: 1 2 3 4 5 6 7 8 9 10 11 12 13 14 15 16 17 18 19 20 21 22 23 24 25 26 27 28 29 30 31 |
| Pathway ID | Tissue | Disease Stage | Description | Gene Ratio | Bg Ratio | pvalue | p.adjust | qvalue | Count |
| hsa0501716 | Cervix | CC | Spinocerebellar ataxia | 35/1267 | 143/8465 | 1.77e-03 | 7.21e-03 | 4.26e-03 | 35 |
| hsa0501717 | Cervix | CC | Spinocerebellar ataxia | 35/1267 | 143/8465 | 1.77e-03 | 7.21e-03 | 4.26e-03 | 35 |
| hsa05017 | Colorectum | AD | Spinocerebellar ataxia | 60/2092 | 143/8465 | 3.78e-06 | 4.35e-05 | 2.78e-05 | 60 |
| hsa050171 | Colorectum | AD | Spinocerebellar ataxia | 60/2092 | 143/8465 | 3.78e-06 | 4.35e-05 | 2.78e-05 | 60 |
| hsa050172 | Colorectum | SER | Spinocerebellar ataxia | 46/1580 | 143/8465 | 6.78e-05 | 7.51e-04 | 5.45e-04 | 46 |
| hsa050173 | Colorectum | SER | Spinocerebellar ataxia | 46/1580 | 143/8465 | 6.78e-05 | 7.51e-04 | 5.45e-04 | 46 |
| hsa050174 | Colorectum | MSS | Spinocerebellar ataxia | 60/1875 | 143/8465 | 7.14e-08 | 1.26e-06 | 7.71e-07 | 60 |
| hsa050175 | Colorectum | MSS | Spinocerebellar ataxia | 60/1875 | 143/8465 | 7.14e-08 | 1.26e-06 | 7.71e-07 | 60 |
| hsa050178 | Colorectum | FAP | Spinocerebellar ataxia | 37/1404 | 143/8465 | 2.94e-03 | 1.29e-02 | 7.86e-03 | 37 |
| hsa050179 | Colorectum | FAP | Spinocerebellar ataxia | 37/1404 | 143/8465 | 2.94e-03 | 1.29e-02 | 7.86e-03 | 37 |
| hsa0501718 | Endometrium | AEH | Spinocerebellar ataxia | 43/1197 | 143/8465 | 5.92e-07 | 7.69e-06 | 5.63e-06 | 43 |
| hsa0501719 | Endometrium | AEH | Spinocerebellar ataxia | 43/1197 | 143/8465 | 5.92e-07 | 7.69e-06 | 5.63e-06 | 43 |
| hsa0501723 | Endometrium | EEC | Spinocerebellar ataxia | 43/1237 | 143/8465 | 1.46e-06 | 2.01e-05 | 1.50e-05 | 43 |
| hsa0501733 | Endometrium | EEC | Spinocerebellar ataxia | 43/1237 | 143/8465 | 1.46e-06 | 2.01e-05 | 1.50e-05 | 43 |
| hsa0501728 | Esophagus | ESCC | Spinocerebellar ataxia | 94/4205 | 143/8465 | 6.77e-05 | 2.90e-04 | 1.48e-04 | 94 |
| hsa0501736 | Esophagus | ESCC | Spinocerebellar ataxia | 94/4205 | 143/8465 | 6.77e-05 | 2.90e-04 | 1.48e-04 | 94 |
| hsa0501710 | Liver | Cirrhotic | Spinocerebellar ataxia | 66/2530 | 143/8465 | 2.58e-05 | 2.15e-04 | 1.32e-04 | 66 |
| hsa0501711 | Liver | Cirrhotic | Spinocerebellar ataxia | 66/2530 | 143/8465 | 2.58e-05 | 2.15e-04 | 1.32e-04 | 66 |
| hsa0501721 | Liver | HCC | Spinocerebellar ataxia | 92/4020 | 143/8465 | 3.20e-05 | 1.88e-04 | 1.04e-04 | 92 |
| hsa0501731 | Liver | HCC | Spinocerebellar ataxia | 92/4020 | 143/8465 | 3.20e-05 | 1.88e-04 | 1.04e-04 | 92 |
| Page: 1 2 |
Top |
Cell-cell communication analysis |
| Identification of potential cell-cell interactions between two cell types and their ligand-receptor pairs for different disease states |
| Ligand | Receptor | LRpair | Pathway | Tissue | Disease Stage |
| Page: 1 |
Top |
Single-cell gene regulatory network inference analysis |
| Find out the significant the regulons (TFs) and the target genes of each regulon across cell types for different disease states |
| TF | Cell Type | Tissue | Disease Stage | Target Gene | RSS | Regulon Activity |
| ∗The dot plots of a searched regulon are shown for all cell subpopulations in each disease state of each tissue based on the regulon specific score inferred using pySCENIC and by calculating the average expression. |
| Page: 1 |
Top |
Somatic mutation of malignant transformation related genes |
| Annotation of somatic variants for genes involved in malignant transformation |
| Hugo Symbol | Variant Class | Variant Classification | dbSNP RS | HGVSc | HGVSp | HGVSp Short | SWISSPROT | BIOTYPE | SIFT | PolyPhen | Tumor Sample Barcode | Tissue | Histology | Sex | Age | Stage | Therapy Types | Drugs | Outcome |
| PUM2 | SNV | Missense_Mutation | c.2534A>C | p.Asp845Ala | p.D845A | Q8TB72 | protein_coding | deleterious(0) | probably_damaging(0.972) | TCGA-A2-A04Q-01 | Breast | breast invasive carcinoma | Female | <65 | I/II | Chemotherapy | adriamycin | SD | |
| PUM2 | SNV | Missense_Mutation | c.1364N>G | p.Thr455Ser | p.T455S | Q8TB72 | protein_coding | tolerated(0.26) | benign(0.041) | TCGA-A2-A0D2-01 | Breast | breast invasive carcinoma | Female | <65 | I/II | Chemotherapy | adriamycin | SD | |
| PUM2 | SNV | Missense_Mutation | rs372196772 | c.536N>A | p.Arg179His | p.R179H | Q8TB72 | protein_coding | tolerated(0.15) | possibly_damaging(0.796) | TCGA-A8-A07W-01 | Breast | breast invasive carcinoma | Female | >=65 | III/IV | Hormone Therapy | exemestane | SD |
| PUM2 | SNV | Missense_Mutation | c.308N>T | p.Pro103Leu | p.P103L | Q8TB72 | protein_coding | deleterious_low_confidence(0) | probably_damaging(1) | TCGA-AR-A24H-01 | Breast | breast invasive carcinoma | Female | >=65 | I/II | Hormone Therapy | tamoxiphen | SD | |
| PUM2 | SNV | Missense_Mutation | rs761103124 | c.502G>A | p.Asp168Asn | p.D168N | Q8TB72 | protein_coding | deleterious_low_confidence(0) | probably_damaging(0.999) | TCGA-AR-A2LE-01 | Breast | breast invasive carcinoma | Female | >=65 | I/II | Hormone Therapy | tamoxiphen | PD |
| PUM2 | SNV | Missense_Mutation | c.562N>A | p.Glu188Lys | p.E188K | Q8TB72 | protein_coding | deleterious_low_confidence(0.01) | possibly_damaging(0.465) | TCGA-BH-A0HF-01 | Breast | breast invasive carcinoma | Female | >=65 | I/II | Hormone Therapy | arimidex | SD | |
| PUM2 | SNV | Missense_Mutation | c.2147A>G | p.Asn716Ser | p.N716S | Q8TB72 | protein_coding | tolerated(0.13) | benign(0.194) | TCGA-BH-A18G-01 | Breast | breast invasive carcinoma | Female | >=65 | I/II | Unknown | Unknown | SD | |
| PUM2 | SNV | Missense_Mutation | c.364N>A | p.Glu122Lys | p.E122K | Q8TB72 | protein_coding | tolerated_low_confidence(0.22) | possibly_damaging(0.465) | TCGA-C8-A12Z-01 | Breast | breast invasive carcinoma | Female | <65 | I/II | Chemotherapy | 5-fluorouracil | CR | |
| PUM2 | insertion | Nonsense_Mutation | novel | c.1525_1526insTATTGTTTCTTATGTTTTTTTTATGA | p.Gln509LeufsTer9 | p.Q509Lfs*9 | Q8TB72 | protein_coding | TCGA-A2-A0EM-01 | Breast | breast invasive carcinoma | Female | >=65 | I/II | Hormone Therapy | tamoxiphen | SD | ||
| PUM2 | deletion | Frame_Shift_Del | novel | c.2019delT | p.Arg674GlufsTer54 | p.R674Efs*54 | Q8TB72 | protein_coding | TCGA-D8-A27V-01 | Breast | breast invasive carcinoma | Female | <65 | I/II | Hormone Therapy | tamoxiphen | SD |
| Page: 1 2 3 4 5 6 7 8 9 10 11 |
Top |
Related drugs of malignant transformation related genes |
| Identification of chemicals and drugs interact with genes involved in malignant transfromation |
| (DGIdb 4.0) |
| Entrez ID | Symbol | Category | Interaction Types | Drug Claim Name | Drug Name | PMIDs |
| Page: 1 |

Copyright 2023-Present -The University of Texas Health Science Center at Houston |