
|
|||||
|
 | |
| |
| |
| |
| |
| |
|
Gene: PTS |
Gene summary for PTS |
| Gene information | Species | Human | Gene symbol | PTS | Gene ID | 5805 |
| Gene name | 6-pyruvoyltetrahydropterin synthase | |
| Gene Alias | PTPS | |
| Cytomap | 11q23.1 | |
| Gene Type | protein-coding | GO ID | GO:0006066 | UniProtAcc | Q03393 |
Top |
Malignant transformation analysis |
| Identification of the aberrant gene expression in precancerous and cancerous lesions by comparing the gene expression of stem-like cells in diseased tissues with normal stem cells |
| Entrez ID | Symbol | Replicates | Species | Organ | Tissue | Adj P-value | Log2FC | Malignancy |
| 5805 | PTS | LZE2T | Human | Esophagus | ESCC | 4.09e-03 | -7.51e-02 | 0.082 |
| 5805 | PTS | LZE3D | Human | Esophagus | HGIN | 1.14e-02 | 1.02e-01 | 0.0668 |
| 5805 | PTS | LZE4T | Human | Esophagus | ESCC | 2.80e-14 | 1.23e-01 | 0.0811 |
| 5805 | PTS | LZE5T | Human | Esophagus | ESCC | 5.27e-06 | -4.76e-02 | 0.0514 |
| 5805 | PTS | LZE7T | Human | Esophagus | ESCC | 6.07e-05 | 3.16e-01 | 0.0667 |
| 5805 | PTS | LZE8T | Human | Esophagus | ESCC | 3.06e-11 | -6.64e-02 | 0.067 |
| 5805 | PTS | LZE20T | Human | Esophagus | ESCC | 3.99e-07 | 2.02e-01 | 0.0662 |
| 5805 | PTS | LZE24T | Human | Esophagus | ESCC | 5.04e-16 | 5.93e-01 | 0.0596 |
| 5805 | PTS | LZE6T | Human | Esophagus | ESCC | 3.08e-05 | -5.27e-04 | 0.0845 |
| 5805 | PTS | P1T-E | Human | Esophagus | ESCC | 7.75e-05 | 2.16e-01 | 0.0875 |
| 5805 | PTS | P2T-E | Human | Esophagus | ESCC | 1.41e-23 | 4.57e-02 | 0.1177 |
| 5805 | PTS | P4T-E | Human | Esophagus | ESCC | 8.10e-50 | 1.43e+00 | 0.1323 |
| 5805 | PTS | P5T-E | Human | Esophagus | ESCC | 1.19e-49 | 1.17e+00 | 0.1327 |
| 5805 | PTS | P8T-E | Human | Esophagus | ESCC | 2.48e-06 | 1.38e-01 | 0.0889 |
| 5805 | PTS | P9T-E | Human | Esophagus | ESCC | 5.80e-32 | 9.28e-01 | 0.1131 |
| 5805 | PTS | P10T-E | Human | Esophagus | ESCC | 5.87e-30 | 6.13e-01 | 0.116 |
| 5805 | PTS | P11T-E | Human | Esophagus | ESCC | 1.86e-08 | 7.40e-01 | 0.1426 |
| 5805 | PTS | P12T-E | Human | Esophagus | ESCC | 1.94e-29 | 8.40e-01 | 0.1122 |
| 5805 | PTS | P15T-E | Human | Esophagus | ESCC | 1.43e-14 | 1.56e-01 | 0.1149 |
| 5805 | PTS | P16T-E | Human | Esophagus | ESCC | 3.60e-18 | 1.72e-01 | 0.1153 |
| Page: 1 2 3 4 5 6 |
| Tissue | Expression Dynamics | Abbreviation |
| Esophagus | 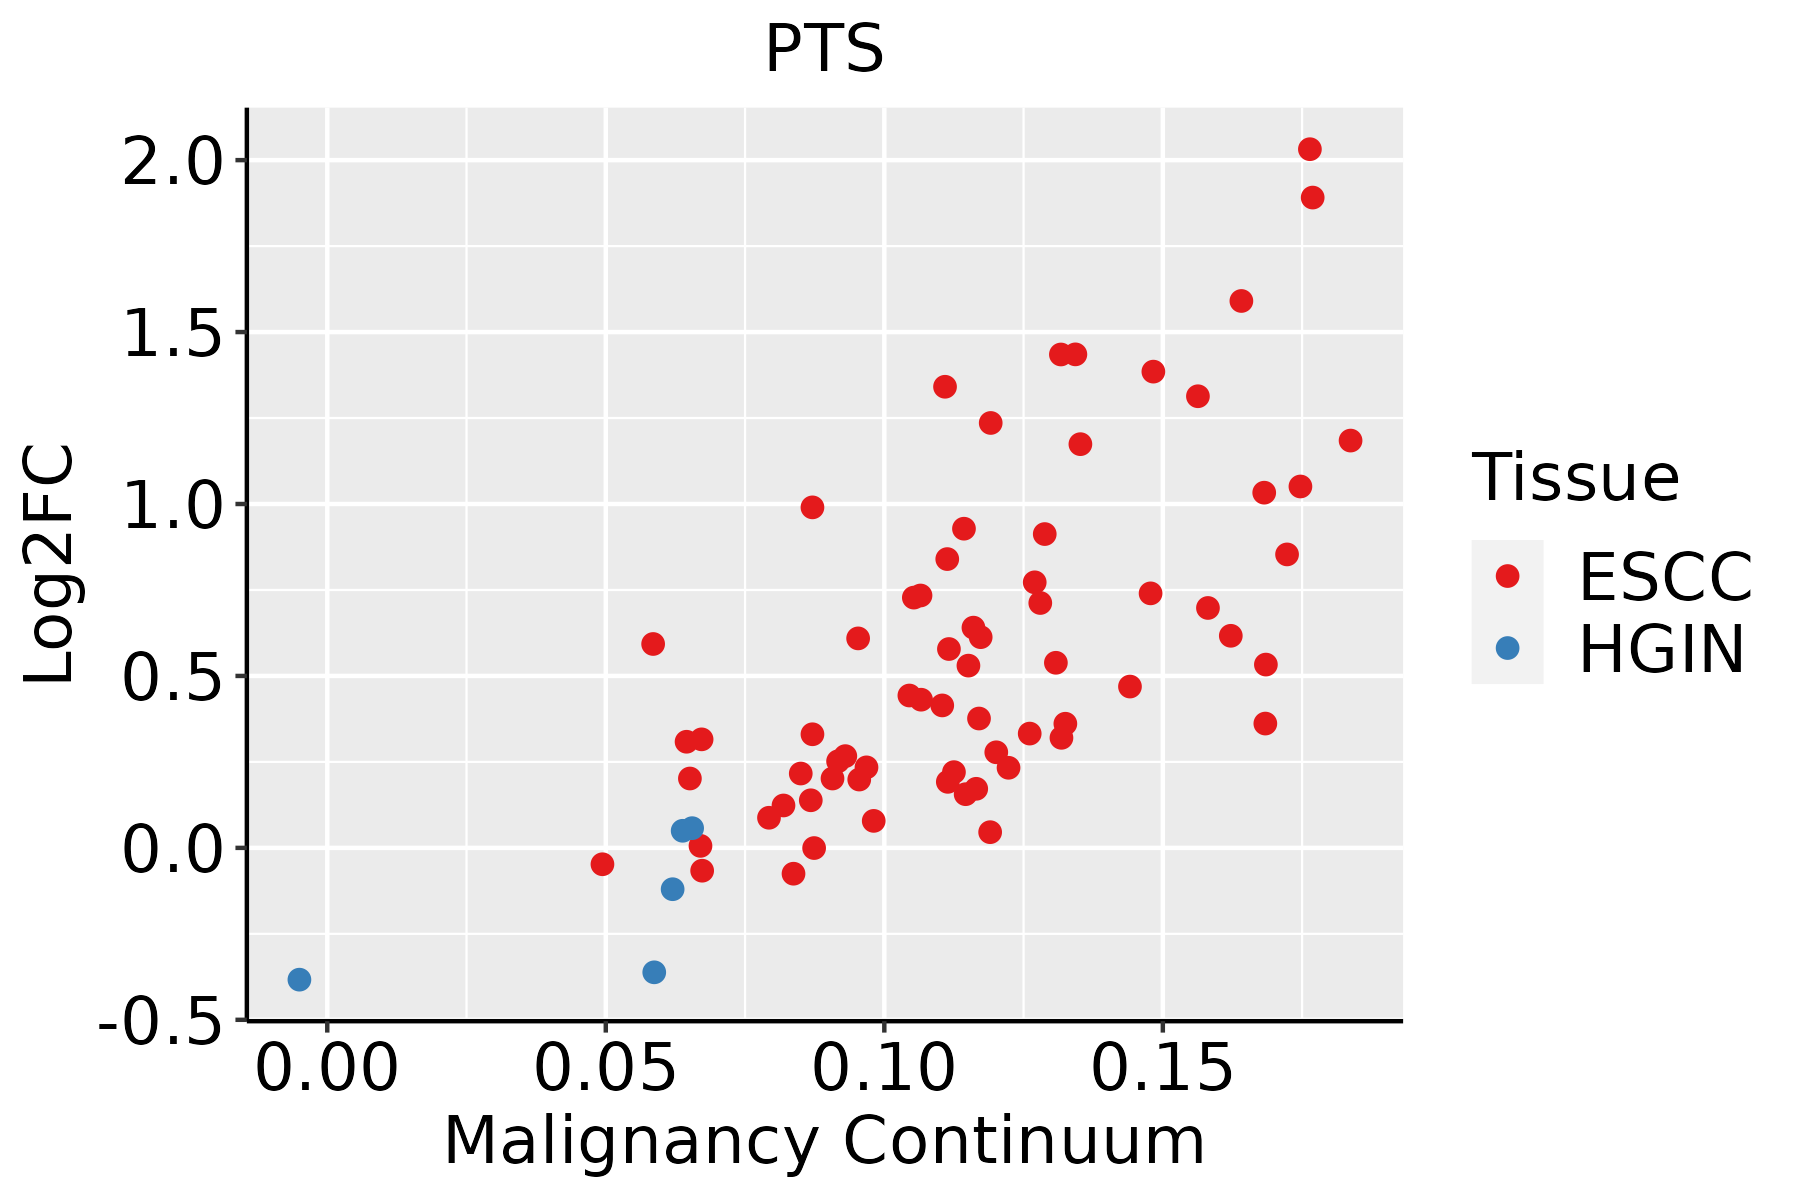 | ESCC: Esophageal squamous cell carcinoma |
| HGIN: High-grade intraepithelial neoplasias | ||
| LGIN: Low-grade intraepithelial neoplasias | ||
| Liver |  | HCC: Hepatocellular carcinoma |
| NAFLD: Non-alcoholic fatty liver disease | ||
| Oral Cavity | 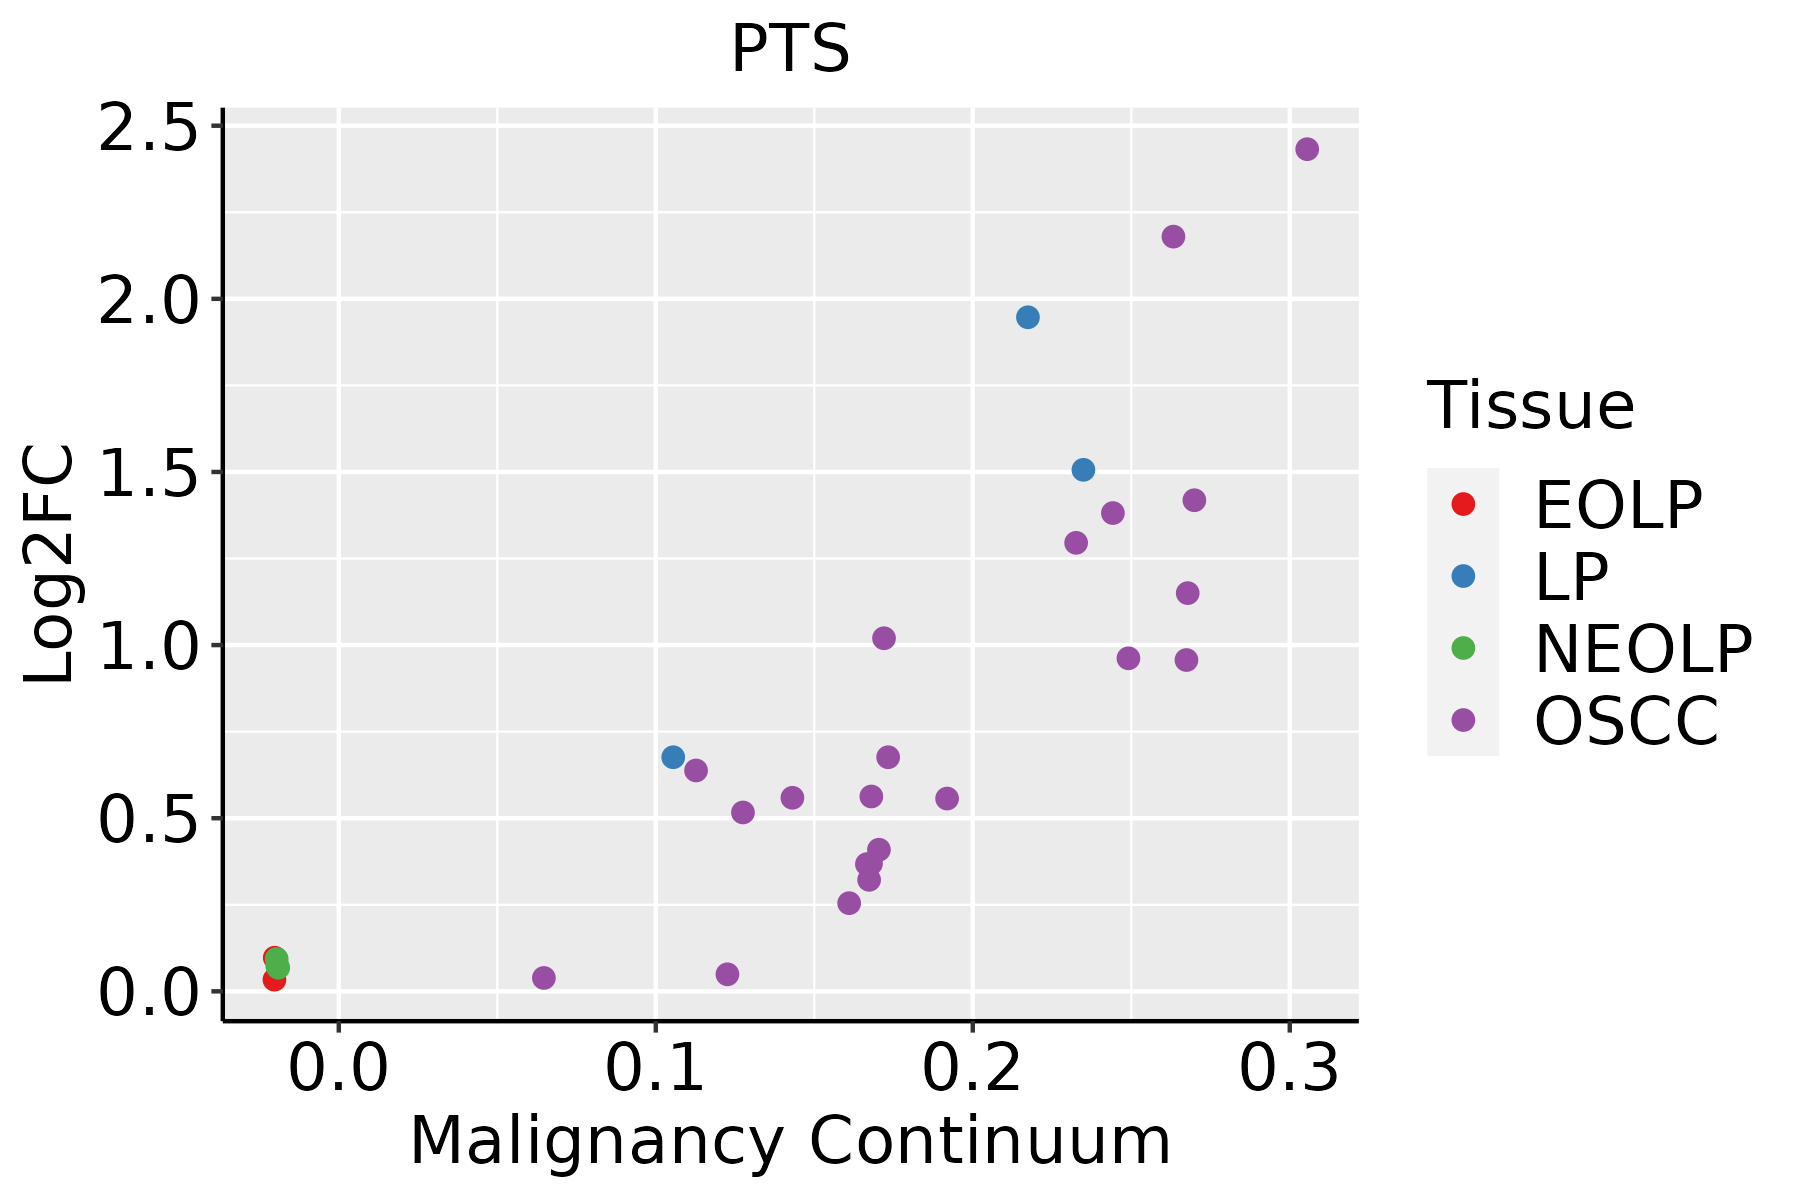 | EOLP: Erosive Oral lichen planus |
| LP: leukoplakia | ||
| NEOLP: Non-erosive oral lichen planus | ||
| OSCC: Oral squamous cell carcinoma | ||
| Skin | 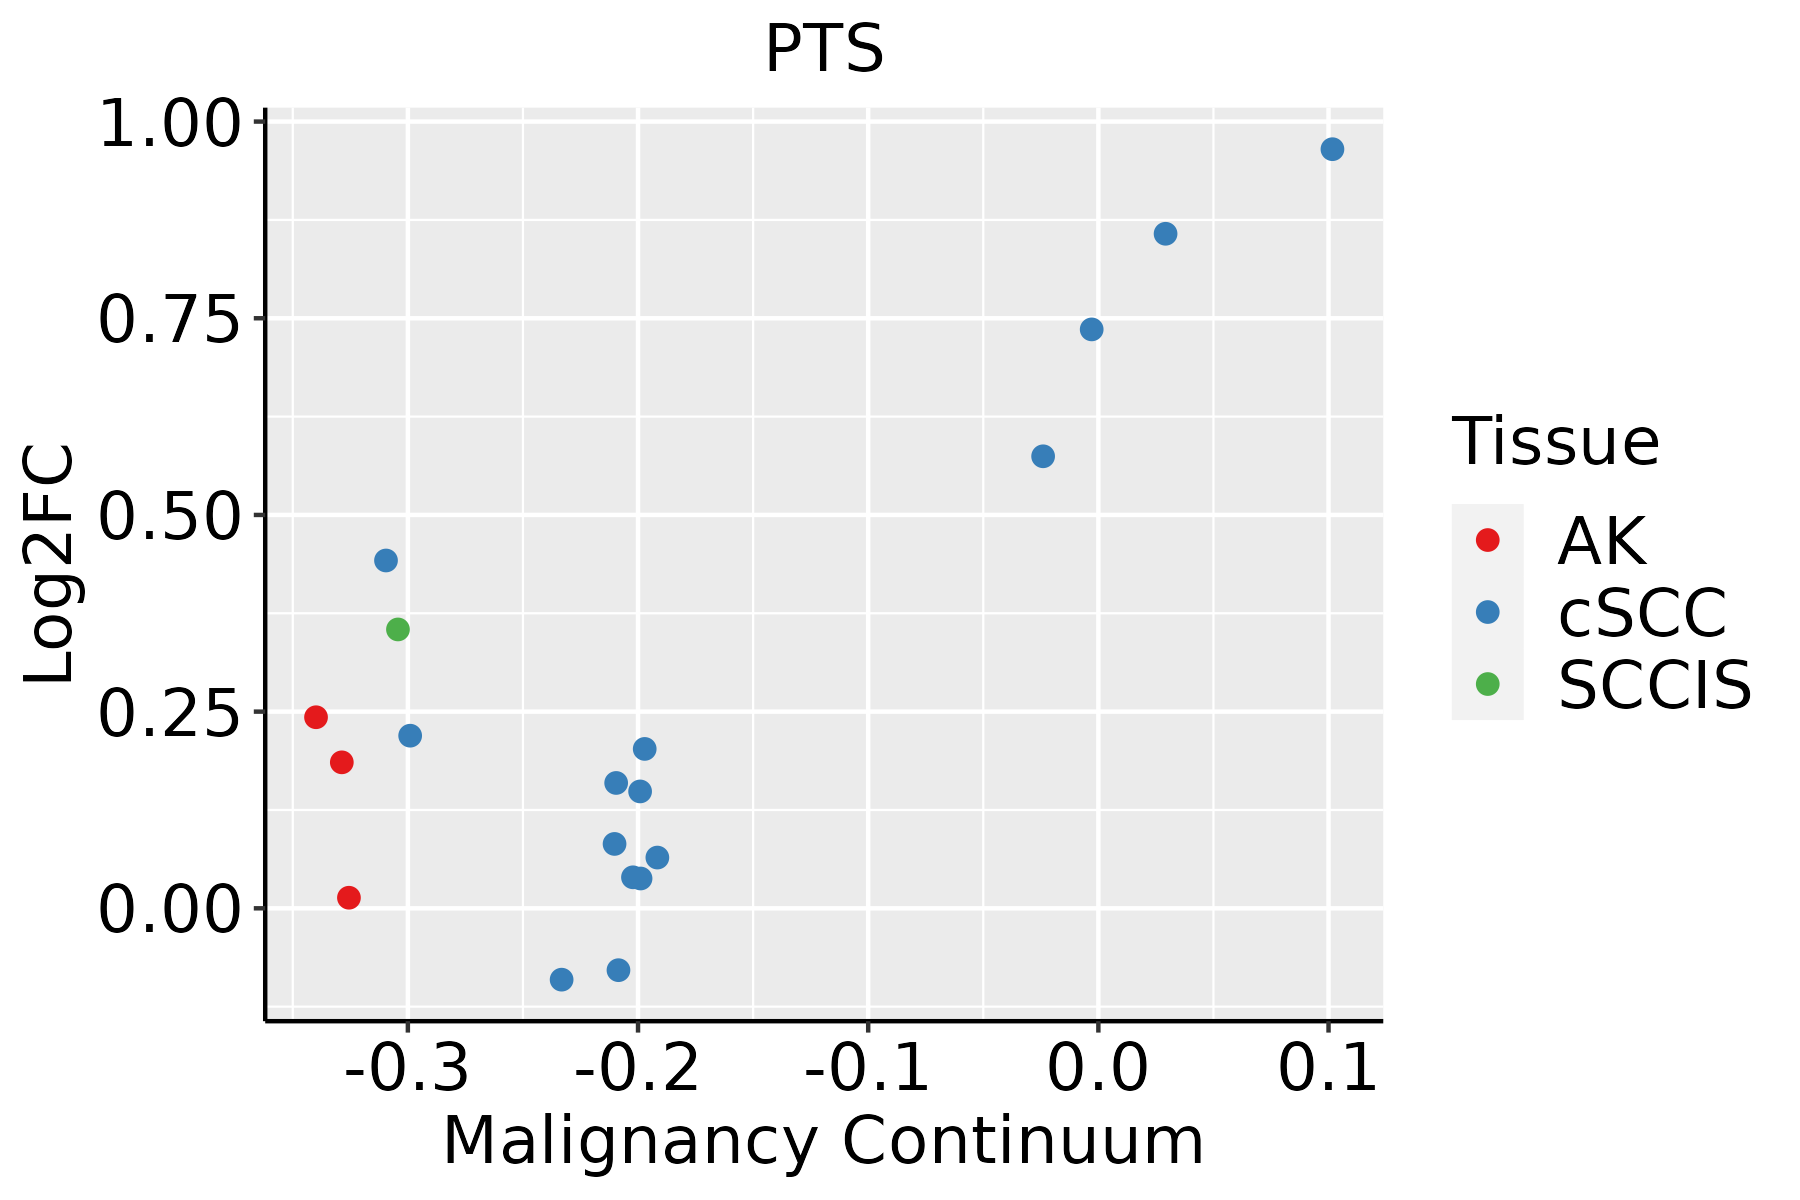 | AK: Actinic keratosis |
| cSCC: Cutaneous squamous cell carcinoma | ||
| SCCIS:squamous cell carcinoma in situ | ||
| Thyroid | 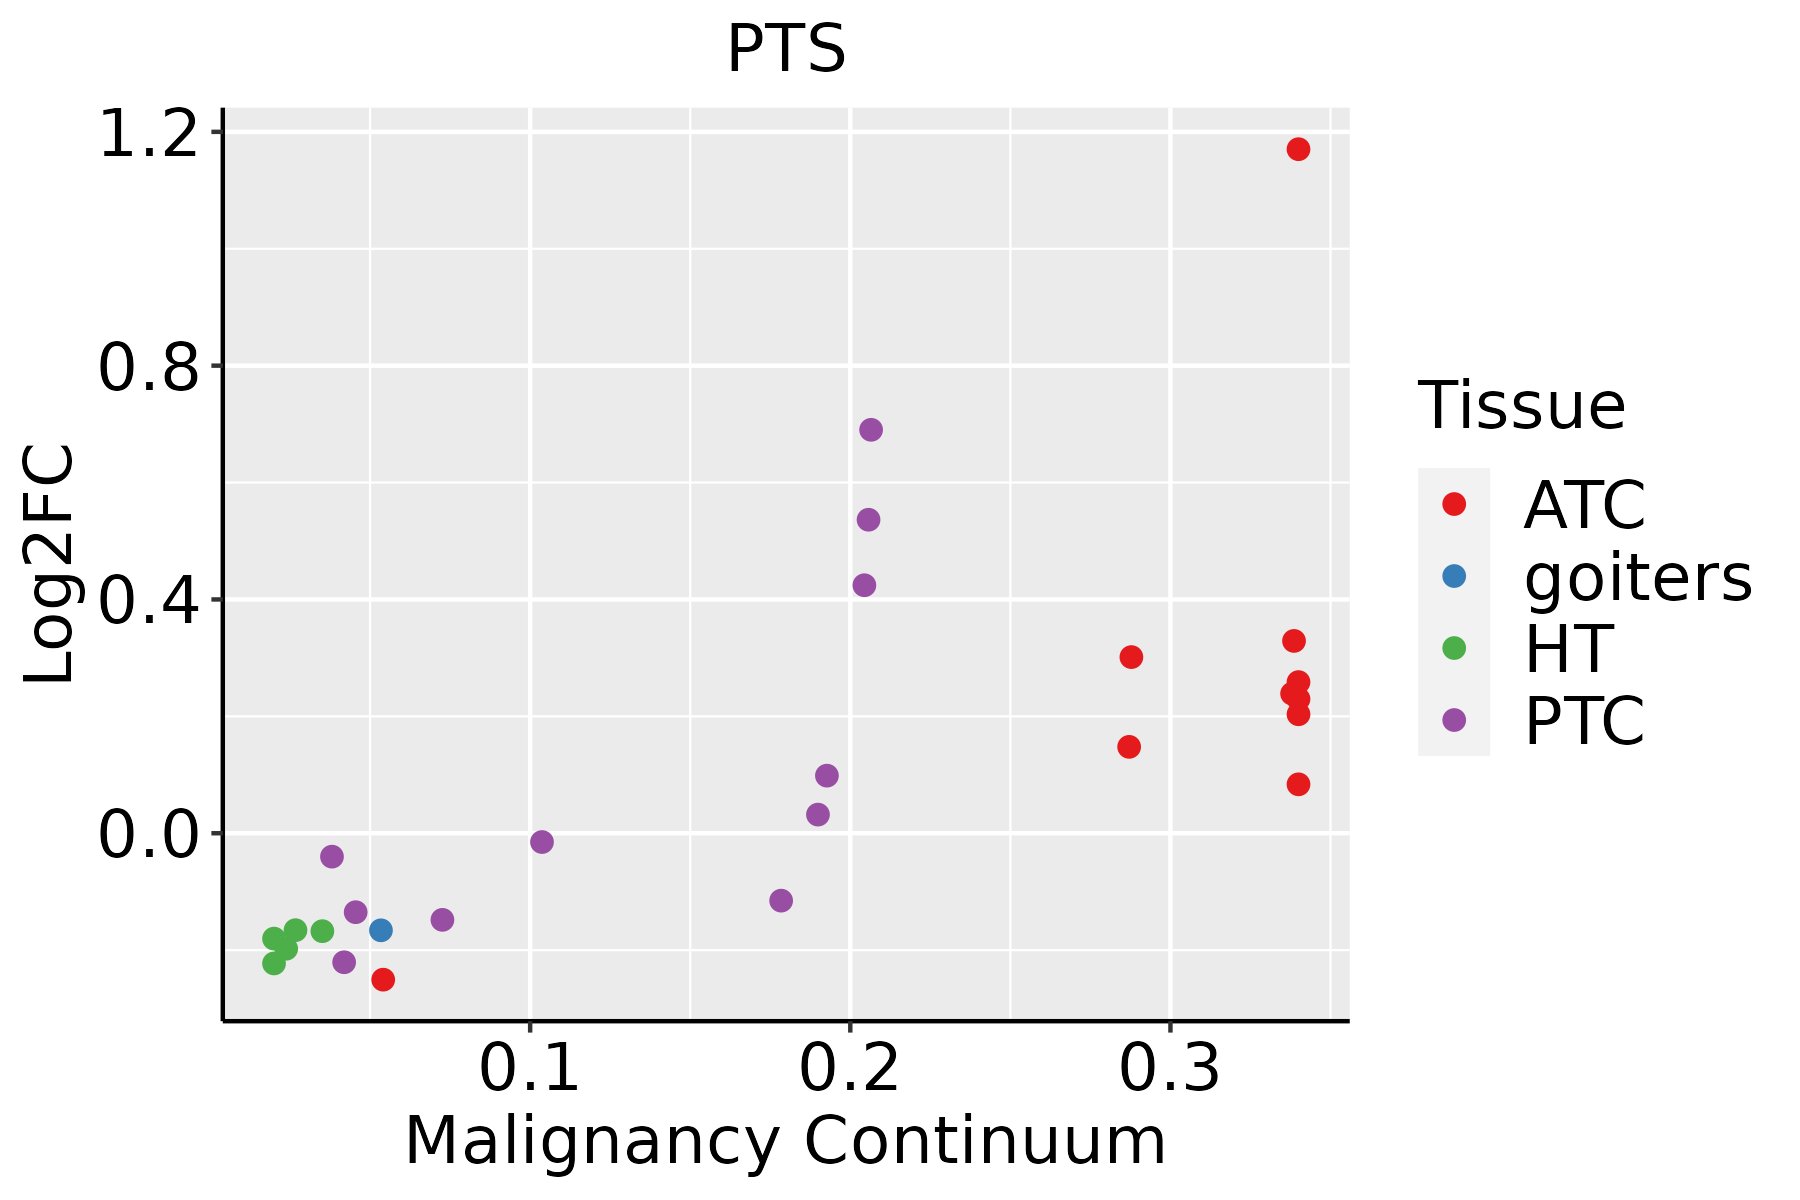 | ATC: Anaplastic thyroid cancer |
| HT: Hashimoto's thyroiditis | ||
| PTC: Papillary thyroid cancer |
| ∗log2FC in expression of this searched gene in stem-like cells from each diseased tissue sample relative to stem-like cells in normal samples in each tissue plotted against the malignancy continuum. Samples are colored based on if they are from different disease stage. |
Top |
Malignant transformation related pathway analysis |
| Find out the enriched GO biological processes and KEGG pathways involved in transition from healthy to precancer to cancer |
| Tissue | Disease Stage | Enriched GO biological Processes |
| Colorectum | AD |  |
| Colorectum | SER |  |
| Colorectum | MSS |  |
| Colorectum | MSI-H |  |
| Colorectum | FAP |  |
| ∗Top 15 enriched GO BP terms are showed in the bar plot of each disease state in each tissue. Each row represents a significant GO biological process which is colored according to the -log10(p.adjust). |
| Page: 1 2 3 4 5 6 7 8 9 |
| GO ID | Tissue | Disease Stage | Description | Gene Ratio | Bg Ratio | pvalue | p.adjust | Count |
| GO:000702914 | Esophagus | ESCC | endoplasmic reticulum organization | 65/8552 | 87/18723 | 3.28e-08 | 6.08e-07 | 65 |
| GO:00066433 | Esophagus | ESCC | membrane lipid metabolic process | 130/8552 | 203/18723 | 9.29e-08 | 1.54e-06 | 130 |
| GO:00464673 | Esophagus | ESCC | membrane lipid biosynthetic process | 91/8552 | 142/18723 | 7.19e-06 | 7.19e-05 | 91 |
| GO:00060668 | Esophagus | ESCC | alcohol metabolic process | 202/8552 | 353/18723 | 7.32e-06 | 7.26e-05 | 202 |
| GO:00066652 | Esophagus | ESCC | sphingolipid metabolic process | 96/8552 | 155/18723 | 3.21e-05 | 2.66e-04 | 96 |
| GO:00425584 | Esophagus | ESCC | pteridine-containing compound metabolic process | 25/8552 | 33/18723 | 4.30e-04 | 2.43e-03 | 25 |
| GO:00461653 | Esophagus | ESCC | alcohol biosynthetic process | 83/8552 | 140/18723 | 8.04e-04 | 4.16e-03 | 83 |
| GO:00425595 | Esophagus | ESCC | pteridine-containing compound biosynthetic process | 13/8552 | 15/18723 | 1.31e-03 | 6.26e-03 | 13 |
| GO:00301481 | Esophagus | ESCC | sphingolipid biosynthetic process | 62/8552 | 103/18723 | 2.10e-03 | 9.38e-03 | 62 |
| GO:00066721 | Esophagus | ESCC | ceramide metabolic process | 61/8552 | 102/18723 | 2.82e-03 | 1.19e-02 | 61 |
| GO:19016174 | Esophagus | ESCC | organic hydroxy compound biosynthetic process | 128/8552 | 237/18723 | 5.86e-03 | 2.16e-02 | 128 |
| GO:0046513 | Esophagus | ESCC | ceramide biosynthetic process | 40/8552 | 65/18723 | 7.25e-03 | 2.63e-02 | 40 |
| GO:00065203 | Liver | NAFLD | cellular amino acid metabolic process | 63/1882 | 284/18723 | 1.14e-09 | 2.17e-07 | 63 |
| GO:00060666 | Liver | NAFLD | alcohol metabolic process | 62/1882 | 353/18723 | 9.01e-06 | 2.96e-04 | 62 |
| GO:00425582 | Liver | NAFLD | pteridine-containing compound metabolic process | 11/1882 | 33/18723 | 2.45e-04 | 4.09e-03 | 11 |
| GO:00425593 | Liver | NAFLD | pteridine-containing compound biosynthetic process | 6/1882 | 15/18723 | 2.30e-03 | 2.19e-02 | 6 |
| GO:1901617 | Liver | NAFLD | organic hydroxy compound biosynthetic process | 37/1882 | 237/18723 | 4.58e-03 | 3.68e-02 | 37 |
| GO:000606612 | Liver | Cirrhotic | alcohol metabolic process | 141/4634 | 353/18723 | 1.57e-10 | 8.03e-09 | 141 |
| GO:000652011 | Liver | Cirrhotic | cellular amino acid metabolic process | 103/4634 | 284/18723 | 8.88e-06 | 1.30e-04 | 103 |
| GO:0046165 | Liver | Cirrhotic | alcohol biosynthetic process | 55/4634 | 140/18723 | 9.74e-05 | 1.03e-03 | 55 |
| Page: 1 2 3 |
| Pathway ID | Tissue | Disease Stage | Description | Gene Ratio | Bg Ratio | pvalue | p.adjust | qvalue | Count |
| hsa012405 | Esophagus | ESCC | Biosynthesis of cofactors | 97/4205 | 153/8465 | 3.88e-04 | 1.35e-03 | 6.94e-04 | 97 |
| hsa0124012 | Esophagus | ESCC | Biosynthesis of cofactors | 97/4205 | 153/8465 | 3.88e-04 | 1.35e-03 | 6.94e-04 | 97 |
| hsa01240 | Liver | Cirrhotic | Biosynthesis of cofactors | 66/2530 | 153/8465 | 3.11e-04 | 1.99e-03 | 1.23e-03 | 66 |
| hsa012401 | Liver | Cirrhotic | Biosynthesis of cofactors | 66/2530 | 153/8465 | 3.11e-04 | 1.99e-03 | 1.23e-03 | 66 |
| hsa012402 | Liver | HCC | Biosynthesis of cofactors | 103/4020 | 153/8465 | 4.67e-07 | 5.05e-06 | 2.81e-06 | 103 |
| hsa012403 | Liver | HCC | Biosynthesis of cofactors | 103/4020 | 153/8465 | 4.67e-07 | 5.05e-06 | 2.81e-06 | 103 |
| hsa012404 | Oral cavity | OSCC | Biosynthesis of cofactors | 88/3704 | 153/8465 | 3.84e-04 | 1.20e-03 | 6.12e-04 | 88 |
| hsa0124011 | Oral cavity | OSCC | Biosynthesis of cofactors | 88/3704 | 153/8465 | 3.84e-04 | 1.20e-03 | 6.12e-04 | 88 |
| hsa0124021 | Oral cavity | LP | Biosynthesis of cofactors | 57/2418 | 153/8465 | 1.17e-02 | 3.91e-02 | 2.52e-02 | 57 |
| hsa0124031 | Oral cavity | LP | Biosynthesis of cofactors | 57/2418 | 153/8465 | 1.17e-02 | 3.91e-02 | 2.52e-02 | 57 |
| Page: 1 |
Top |
Cell-cell communication analysis |
| Identification of potential cell-cell interactions between two cell types and their ligand-receptor pairs for different disease states |
| Ligand | Receptor | LRpair | Pathway | Tissue | Disease Stage |
| Page: 1 |
Top |
Single-cell gene regulatory network inference analysis |
| Find out the significant the regulons (TFs) and the target genes of each regulon across cell types for different disease states |
| TF | Cell Type | Tissue | Disease Stage | Target Gene | RSS | Regulon Activity |
| ∗The dot plots of a searched regulon are shown for all cell subpopulations in each disease state of each tissue based on the regulon specific score inferred using pySCENIC and by calculating the average expression. |
| Page: 1 |
Top |
Somatic mutation of malignant transformation related genes |
| Annotation of somatic variants for genes involved in malignant transformation |
| Hugo Symbol | Variant Class | Variant Classification | dbSNP RS | HGVSc | HGVSp | HGVSp Short | SWISSPROT | BIOTYPE | SIFT | PolyPhen | Tumor Sample Barcode | Tissue | Histology | Sex | Age | Stage | Therapy Types | Drugs | Outcome |
| PTS | SNV | Missense_Mutation | c.100N>A | p.Glu34Lys | p.E34K | Q03393 | protein_coding | deleterious(0.04) | possibly_damaging(0.535) | TCGA-MA-AA41-01 | Cervix | cervical & endocervical cancer | Female | <65 | I/II | Unknown | Unknown | SD | |
| PTS | SNV | Missense_Mutation | rs779681799 | c.400G>A | p.Glu134Lys | p.E134K | Q03393 | protein_coding | deleterious(0.01) | probably_damaging(0.998) | TCGA-AJ-A5DW-01 | Endometrium | uterine corpus endometrioid carcinoma | Female | <65 | I/II | Unknown | Unknown | SD |
| PTS | SNV | Missense_Mutation | rs779681799 | c.400N>A | p.Glu134Lys | p.E134K | Q03393 | protein_coding | deleterious(0.01) | probably_damaging(0.998) | TCGA-BS-A0UV-01 | Endometrium | uterine corpus endometrioid carcinoma | Female | <65 | III/IV | Unknown | Unknown | SD |
| PTS | SNV | Missense_Mutation | novel | c.316A>G | p.Thr106Ala | p.T106A | Q03393 | protein_coding | deleterious(0) | probably_damaging(0.985) | TCGA-D1-A175-01 | Endometrium | uterine corpus endometrioid carcinoma | Female | <65 | I/II | Chemotherapy | paclitaxel | SD |
| PTS | SNV | Missense_Mutation | novel | c.391N>C | p.Lys131Gln | p.K131Q | Q03393 | protein_coding | tolerated(0.06) | benign(0.114) | TCGA-EY-A1GD-01 | Endometrium | uterine corpus endometrioid carcinoma | Female | <65 | I/II | Unknown | Unknown | SD |
| PTS | SNV | Missense_Mutation | novel | c.186G>T | p.Glu62Asp | p.E62D | Q03393 | protein_coding | tolerated(0.17) | benign(0.011) | TCGA-78-7155-01 | Lung | lung adenocarcinoma | Male | >=65 | I/II | Chemotherapy | carboplatin | PD |
| PTS | insertion | Frame_Shift_Ins | novel | c.308_309insGGTGA | p.Ser105ArgfsTer2 | p.S105Rfs*2 | Q03393 | protein_coding | TCGA-39-5027-01 | Lung | lung squamous cell carcinoma | Male | >=65 | I/II | Unknown | Unknown | PD | ||
| PTS | SNV | Missense_Mutation | rs765406631 | c.260N>T | p.Pro87Leu | p.P87L | Q03393 | protein_coding | tolerated(0.18) | benign(0.117) | TCGA-VQ-A91Z-01 | Stomach | stomach adenocarcinoma | Female | >=65 | III/IV | Chemotherapy | fluorouracil | PD |
| Page: 1 |
Top |
Related drugs of malignant transformation related genes |
| Identification of chemicals and drugs interact with genes involved in malignant transfromation |
| (DGIdb 4.0) |
| Entrez ID | Symbol | Category | Interaction Types | Drug Claim Name | Drug Name | PMIDs |
| Page: 1 |

Copyright 2023-Present -The University of Texas Health Science Center at Houston |