
|
|||||
|
 | |
| |
| |
| |
| |
| |
|
Gene: PTPRT |
Gene summary for PTPRT |
| Gene information | Species | Human | Gene symbol | PTPRT | Gene ID | 11122 |
| Gene name | protein tyrosine phosphatase receptor type T | |
| Gene Alias | R-PTP-T | |
| Cytomap | 20q12-q13.11 | |
| Gene Type | protein-coding | GO ID | GO:0001932 | UniProtAcc | O14522 |
Top |
Malignant transformation analysis |
| Identification of the aberrant gene expression in precancerous and cancerous lesions by comparing the gene expression of stem-like cells in diseased tissues with normal stem cells |
| Entrez ID | Symbol | Replicates | Species | Organ | Tissue | Adj P-value | Log2FC | Malignancy |
| 11122 | PTPRT | ATC13 | Human | Thyroid | ATC | 1.15e-38 | 8.93e-01 | 0.34 |
| 11122 | PTPRT | ATC5 | Human | Thyroid | ATC | 1.51e-42 | 9.55e-01 | 0.34 |
| Page: 1 |
| Tissue | Expression Dynamics | Abbreviation |
| Thyroid | 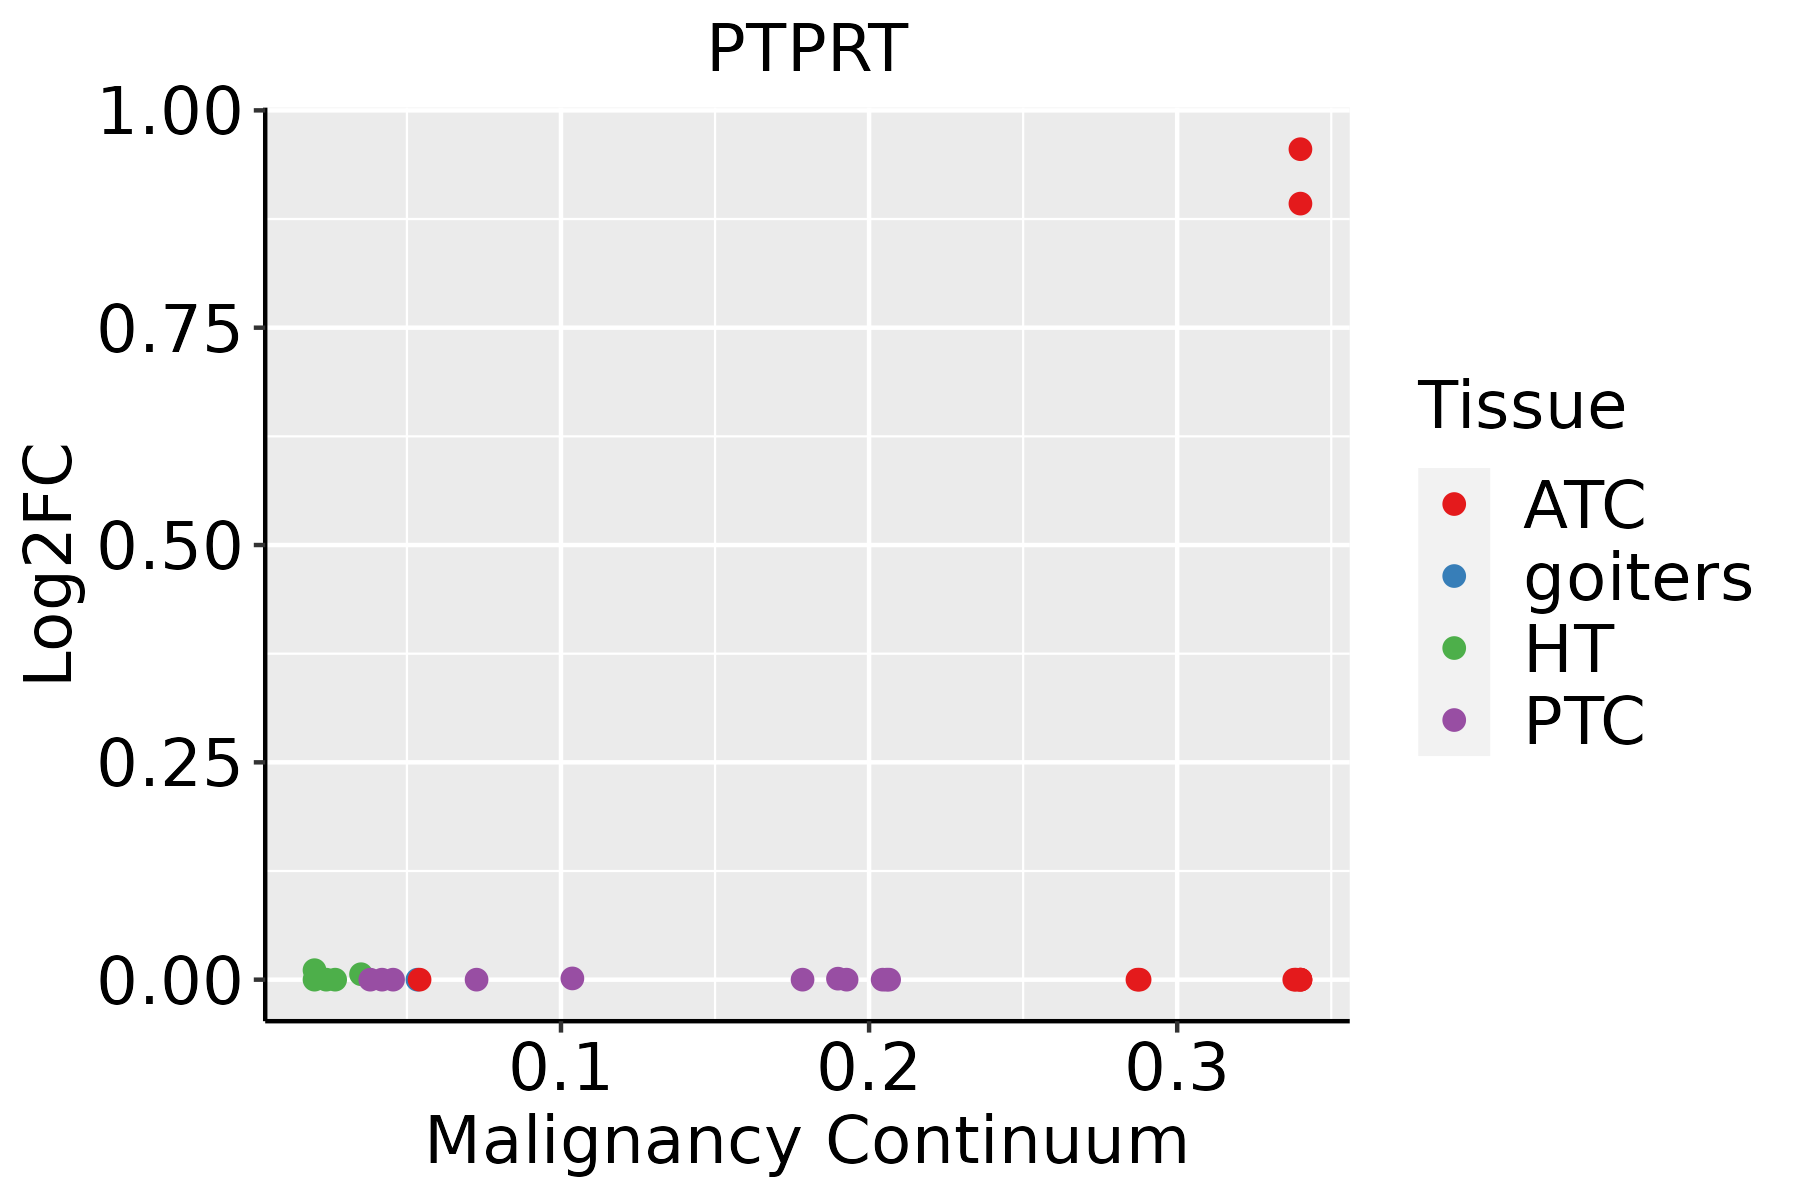 | ATC: Anaplastic thyroid cancer |
| HT: Hashimoto's thyroiditis | ||
| PTC: Papillary thyroid cancer |
| ∗log2FC in expression of this searched gene in stem-like cells from each diseased tissue sample relative to stem-like cells in normal samples in each tissue plotted against the malignancy continuum. Samples are colored based on if they are from different disease stage. |
Top |
Malignant transformation related pathway analysis |
| Find out the enriched GO biological processes and KEGG pathways involved in transition from healthy to precancer to cancer |
| Tissue | Disease Stage | Enriched GO biological Processes |
| Colorectum | AD |  |
| Colorectum | SER |  |
| Colorectum | MSS |  |
| Colorectum | MSI-H |  |
| Colorectum | FAP |  |
| ∗Top 15 enriched GO BP terms are showed in the bar plot of each disease state in each tissue. Each row represents a significant GO biological process which is colored according to the -log10(p.adjust). |
| Page: 1 2 3 4 5 6 7 8 9 |
| GO ID | Tissue | Disease Stage | Description | Gene Ratio | Bg Ratio | pvalue | p.adjust | Count |
| GO:001056334 | Thyroid | ATC | negative regulation of phosphorus metabolic process | 234/6293 | 442/18723 | 2.30e-17 | 2.31e-15 | 234 |
| GO:004593634 | Thyroid | ATC | negative regulation of phosphate metabolic process | 233/6293 | 441/18723 | 3.68e-17 | 3.47e-15 | 233 |
| GO:000193333 | Thyroid | ATC | negative regulation of protein phosphorylation | 186/6293 | 342/18723 | 1.43e-15 | 1.08e-13 | 186 |
| GO:004232634 | Thyroid | ATC | negative regulation of phosphorylation | 203/6293 | 385/18723 | 5.30e-15 | 3.53e-13 | 203 |
| GO:005134834 | Thyroid | ATC | negative regulation of transferase activity | 144/6293 | 268/18723 | 7.63e-12 | 2.91e-10 | 144 |
| GO:000646925 | Thyroid | ATC | negative regulation of protein kinase activity | 114/6293 | 212/18723 | 1.06e-09 | 2.69e-08 | 114 |
| GO:003367325 | Thyroid | ATC | negative regulation of kinase activity | 122/6293 | 237/18723 | 9.19e-09 | 1.94e-07 | 122 |
| GO:0006470111 | Thyroid | ATC | protein dephosphorylation | 129/6293 | 281/18723 | 1.11e-05 | 1.09e-04 | 129 |
| GO:001631117 | Thyroid | ATC | dephosphorylation | 179/6293 | 417/18723 | 3.88e-05 | 3.15e-04 | 179 |
| GO:004001316 | Thyroid | ATC | negative regulation of locomotion | 160/6293 | 391/18723 | 1.36e-03 | 7.07e-03 | 160 |
| GO:003033616 | Thyroid | ATC | negative regulation of cell migration | 142/6293 | 344/18723 | 1.64e-03 | 8.22e-03 | 142 |
| GO:005127117 | Thyroid | ATC | negative regulation of cellular component movement | 150/6293 | 367/18723 | 1.99e-03 | 9.54e-03 | 150 |
| GO:200014617 | Thyroid | ATC | negative regulation of cell motility | 147/6293 | 359/18723 | 2.01e-03 | 9.60e-03 | 147 |
| Page: 1 |
| Pathway ID | Tissue | Disease Stage | Description | Gene Ratio | Bg Ratio | pvalue | p.adjust | qvalue | Count |
| Page: 1 |
Top |
Cell-cell communication analysis |
| Identification of potential cell-cell interactions between two cell types and their ligand-receptor pairs for different disease states |
| Ligand | Receptor | LRpair | Pathway | Tissue | Disease Stage |
| Page: 1 |
Top |
Single-cell gene regulatory network inference analysis |
| Find out the significant the regulons (TFs) and the target genes of each regulon across cell types for different disease states |
| TF | Cell Type | Tissue | Disease Stage | Target Gene | RSS | Regulon Activity |
| ∗The dot plots of a searched regulon are shown for all cell subpopulations in each disease state of each tissue based on the regulon specific score inferred using pySCENIC and by calculating the average expression. |
| Page: 1 |
Top |
Somatic mutation of malignant transformation related genes |
| Annotation of somatic variants for genes involved in malignant transformation |
| Hugo Symbol | Variant Class | Variant Classification | dbSNP RS | HGVSc | HGVSp | HGVSp Short | SWISSPROT | BIOTYPE | SIFT | PolyPhen | Tumor Sample Barcode | Tissue | Histology | Sex | Age | Stage | Therapy Types | Drugs | Outcome |
| PTPRT | SNV | Missense_Mutation | c.2703N>C | p.Lys901Asn | p.K901N | protein_coding | deleterious(0) | probably_damaging(0.992) | TCGA-A1-A0SI-01 | Breast | breast invasive carcinoma | Female | <65 | I/II | Unknown | Unknown | SD | ||
| PTPRT | SNV | Missense_Mutation | novel | c.3436N>T | p.Val1146Leu | p.V1146L | protein_coding | deleterious(0) | probably_damaging(0.917) | TCGA-A8-A09A-01 | Breast | breast invasive carcinoma | Female | <65 | I/II | Hormone Therapy | tamoxiphen | SD | |
| PTPRT | SNV | Missense_Mutation | c.2840N>A | p.Arg947Gln | p.R947Q | protein_coding | deleterious(0.01) | probably_damaging(0.999) | TCGA-A8-A09Q-01 | Breast | breast invasive carcinoma | Female | >=65 | III/IV | Hormone Therapy | anastrozole | SD | ||
| PTPRT | SNV | Missense_Mutation | c.2063N>G | p.Asn688Ser | p.N688S | protein_coding | tolerated(0.31) | probably_damaging(0.984) | TCGA-A8-A09Z-01 | Breast | breast invasive carcinoma | Female | >=65 | I/II | Unknown | Unknown | SD | ||
| PTPRT | SNV | Missense_Mutation | c.2953G>A | p.Glu985Lys | p.E985K | protein_coding | deleterious(0) | probably_damaging(0.984) | TCGA-AC-A23H-01 | Breast | breast invasive carcinoma | Female | >=65 | I/II | Unknown | Unknown | PD | ||
| PTPRT | SNV | Missense_Mutation | rs868295248 | c.541G>A | p.Glu181Lys | p.E181K | protein_coding | deleterious(0) | probably_damaging(0.968) | TCGA-AC-A3W6-01 | Breast | breast invasive carcinoma | Female | >=65 | III/IV | Unknown | Unknown | SD | |
| PTPRT | SNV | Missense_Mutation | c.484N>A | p.Gln162Lys | p.Q162K | protein_coding | tolerated(0.07) | probably_damaging(0.944) | TCGA-AN-A0FF-01 | Breast | breast invasive carcinoma | Female | <65 | I/II | Unknown | Unknown | SD | ||
| PTPRT | SNV | Missense_Mutation | c.218C>G | p.Ser73Cys | p.S73C | protein_coding | deleterious(0) | probably_damaging(0.99) | TCGA-AN-A0FV-01 | Breast | breast invasive carcinoma | Female | <65 | I/II | Unknown | Unknown | SD | ||
| PTPRT | SNV | Missense_Mutation | c.241G>A | p.Gly81Arg | p.G81R | protein_coding | tolerated(0.1) | probably_damaging(0.998) | TCGA-E9-A1RB-01 | Breast | breast invasive carcinoma | Female | <65 | I/II | Chemotherapy | methotrexate | SD | ||
| PTPRT | deletion | Frame_Shift_Del | novel | c.1985delN | p.His662ProfsTer7 | p.H662Pfs*7 | protein_coding | TCGA-D8-A27V-01 | Breast | breast invasive carcinoma | Female | <65 | I/II | Hormone Therapy | tamoxiphen | SD |
| Page: 1 2 3 4 5 6 7 8 9 10 11 12 13 14 15 16 17 18 19 20 21 22 23 24 25 26 27 28 29 30 31 |
Top |
Related drugs of malignant transformation related genes |
| Identification of chemicals and drugs interact with genes involved in malignant transfromation |
| (DGIdb 4.0) |
| Entrez ID | Symbol | Category | Interaction Types | Drug Claim Name | Drug Name | PMIDs |
| Page: 1 |

Copyright 2023-Present -The University of Texas Health Science Center at Houston |