
|
|||||
|
 | |
| |
| |
| |
| |
| |
|
Gene: PTPRS |
Gene summary for PTPRS |
| Gene information | Species | Human | Gene symbol | PTPRS | Gene ID | 5802 |
| Gene name | protein tyrosine phosphatase receptor type S | |
| Gene Alias | PTPSIGMA | |
| Cytomap | 19p13.3 | |
| Gene Type | protein-coding | GO ID | GO:0000902 | UniProtAcc | Q13332 |
Top |
Malignant transformation analysis |
| Identification of the aberrant gene expression in precancerous and cancerous lesions by comparing the gene expression of stem-like cells in diseased tissues with normal stem cells |
| Entrez ID | Symbol | Replicates | Species | Organ | Tissue | Adj P-value | Log2FC | Malignancy |
| 5802 | PTPRS | CCI_1 | Human | Cervix | CC | 2.34e-04 | 4.27e-01 | 0.528 |
| 5802 | PTPRS | CCI_3 | Human | Cervix | CC | 3.62e-12 | 6.63e-01 | 0.516 |
| 5802 | PTPRS | CCII_1 | Human | Cervix | CC | 4.23e-11 | 4.86e-01 | 0.3249 |
| 5802 | PTPRS | Tumor | Human | Cervix | CC | 2.43e-03 | 2.16e-01 | 0.1241 |
| 5802 | PTPRS | LZE7T | Human | Esophagus | ESCC | 2.07e-09 | 3.95e-01 | 0.0667 |
| 5802 | PTPRS | LZE22D1 | Human | Esophagus | HGIN | 5.14e-03 | 1.59e-01 | 0.0595 |
| 5802 | PTPRS | LZE24T | Human | Esophagus | ESCC | 1.09e-06 | 2.08e-01 | 0.0596 |
| 5802 | PTPRS | LZE21T | Human | Esophagus | ESCC | 1.57e-07 | 3.83e-01 | 0.0655 |
| 5802 | PTPRS | P1T-E | Human | Esophagus | ESCC | 2.65e-12 | 4.59e-01 | 0.0875 |
| 5802 | PTPRS | P2T-E | Human | Esophagus | ESCC | 1.30e-15 | 2.90e-01 | 0.1177 |
| 5802 | PTPRS | P4T-E | Human | Esophagus | ESCC | 3.18e-14 | 2.93e-01 | 0.1323 |
| 5802 | PTPRS | P5T-E | Human | Esophagus | ESCC | 1.96e-05 | 1.36e-01 | 0.1327 |
| 5802 | PTPRS | P8T-E | Human | Esophagus | ESCC | 2.51e-33 | 5.07e-01 | 0.0889 |
| 5802 | PTPRS | P9T-E | Human | Esophagus | ESCC | 1.69e-18 | 3.52e-01 | 0.1131 |
| 5802 | PTPRS | P10T-E | Human | Esophagus | ESCC | 2.08e-40 | 7.08e-01 | 0.116 |
| 5802 | PTPRS | P11T-E | Human | Esophagus | ESCC | 9.92e-21 | 6.26e-01 | 0.1426 |
| 5802 | PTPRS | P12T-E | Human | Esophagus | ESCC | 9.86e-34 | 6.04e-01 | 0.1122 |
| 5802 | PTPRS | P15T-E | Human | Esophagus | ESCC | 6.53e-23 | 4.49e-01 | 0.1149 |
| 5802 | PTPRS | P16T-E | Human | Esophagus | ESCC | 3.19e-23 | 3.47e-01 | 0.1153 |
| 5802 | PTPRS | P17T-E | Human | Esophagus | ESCC | 9.15e-12 | 3.97e-01 | 0.1278 |
| Page: 1 2 3 4 5 |
| Tissue | Expression Dynamics | Abbreviation |
| Cervix |  | CC: Cervix cancer |
| HSIL_HPV: HPV-infected high-grade squamous intraepithelial lesions | ||
| N_HPV: HPV-infected normal cervix | ||
| Esophagus |  | ESCC: Esophageal squamous cell carcinoma |
| HGIN: High-grade intraepithelial neoplasias | ||
| LGIN: Low-grade intraepithelial neoplasias | ||
| Oral Cavity | 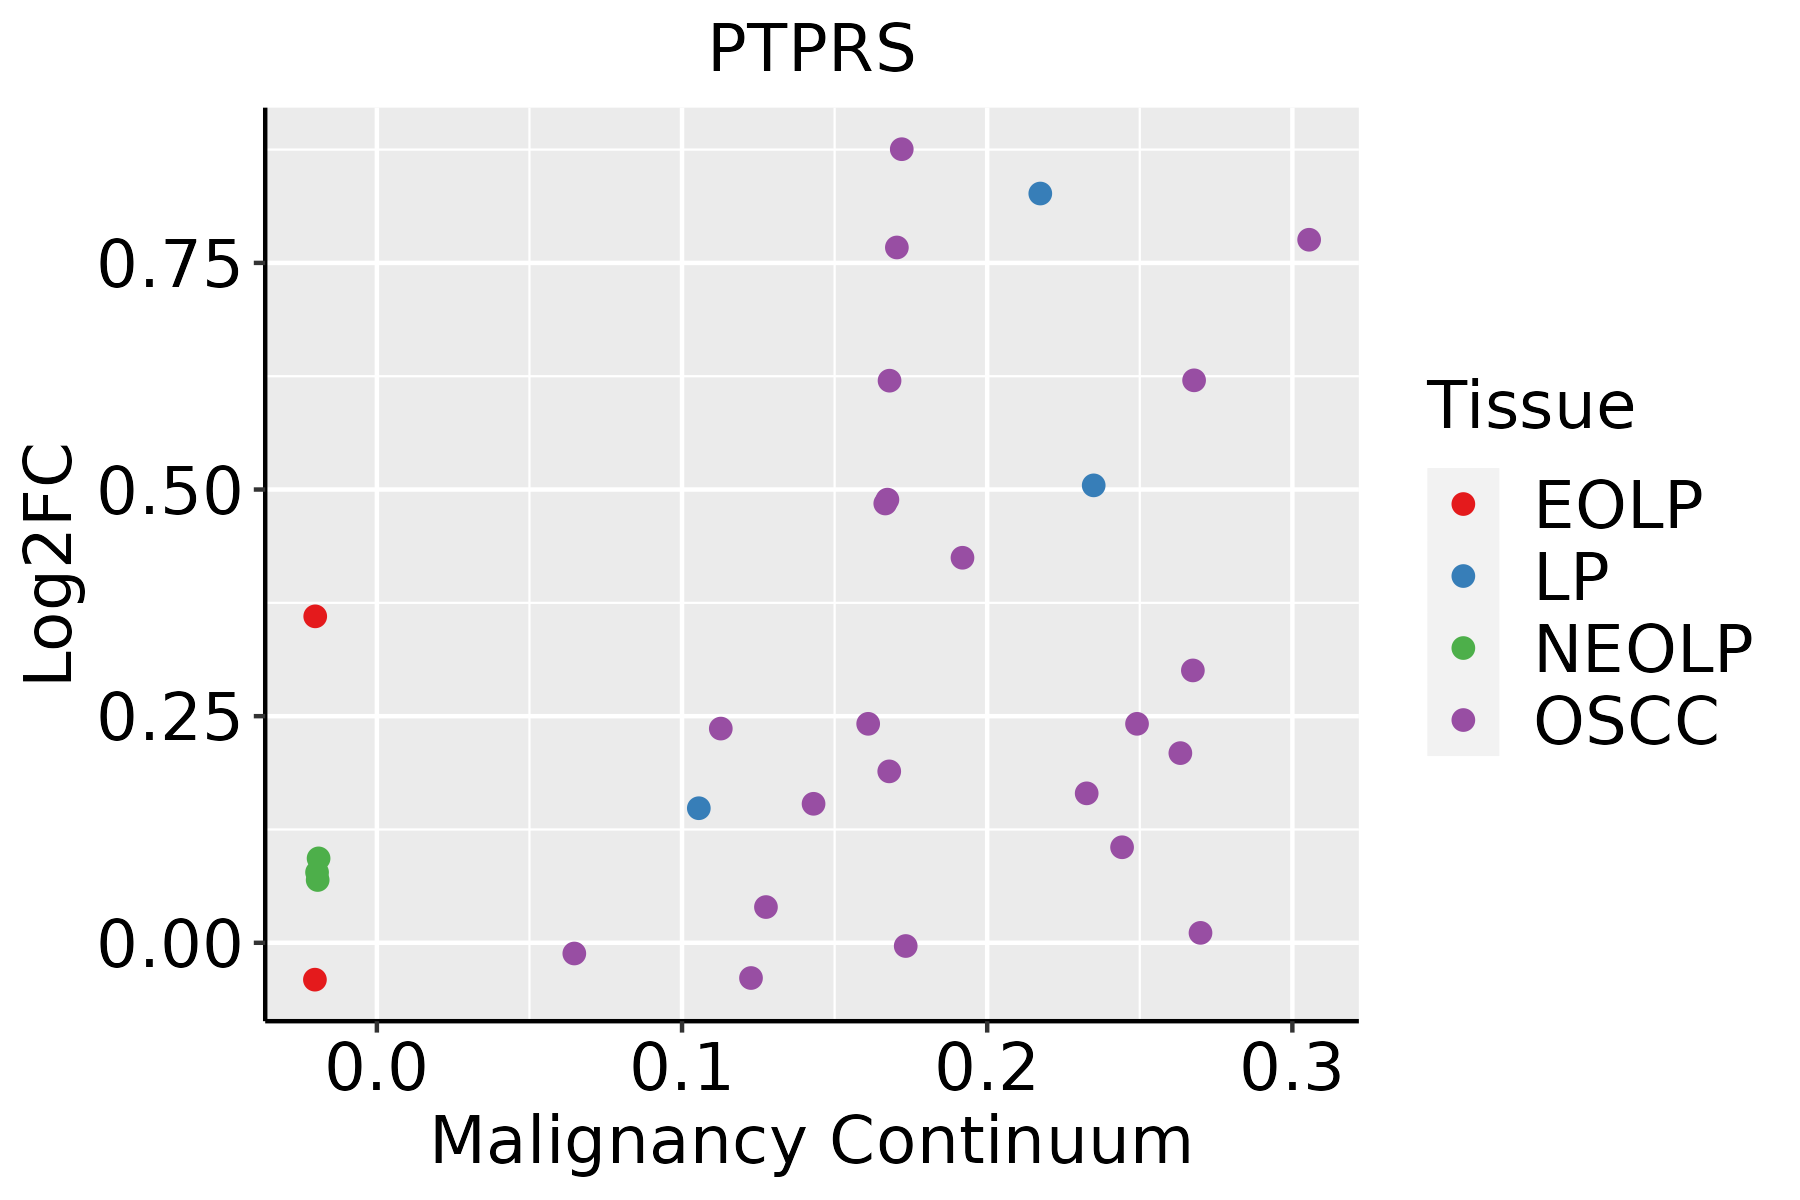 | EOLP: Erosive Oral lichen planus |
| LP: leukoplakia | ||
| NEOLP: Non-erosive oral lichen planus | ||
| OSCC: Oral squamous cell carcinoma | ||
| Prostate | 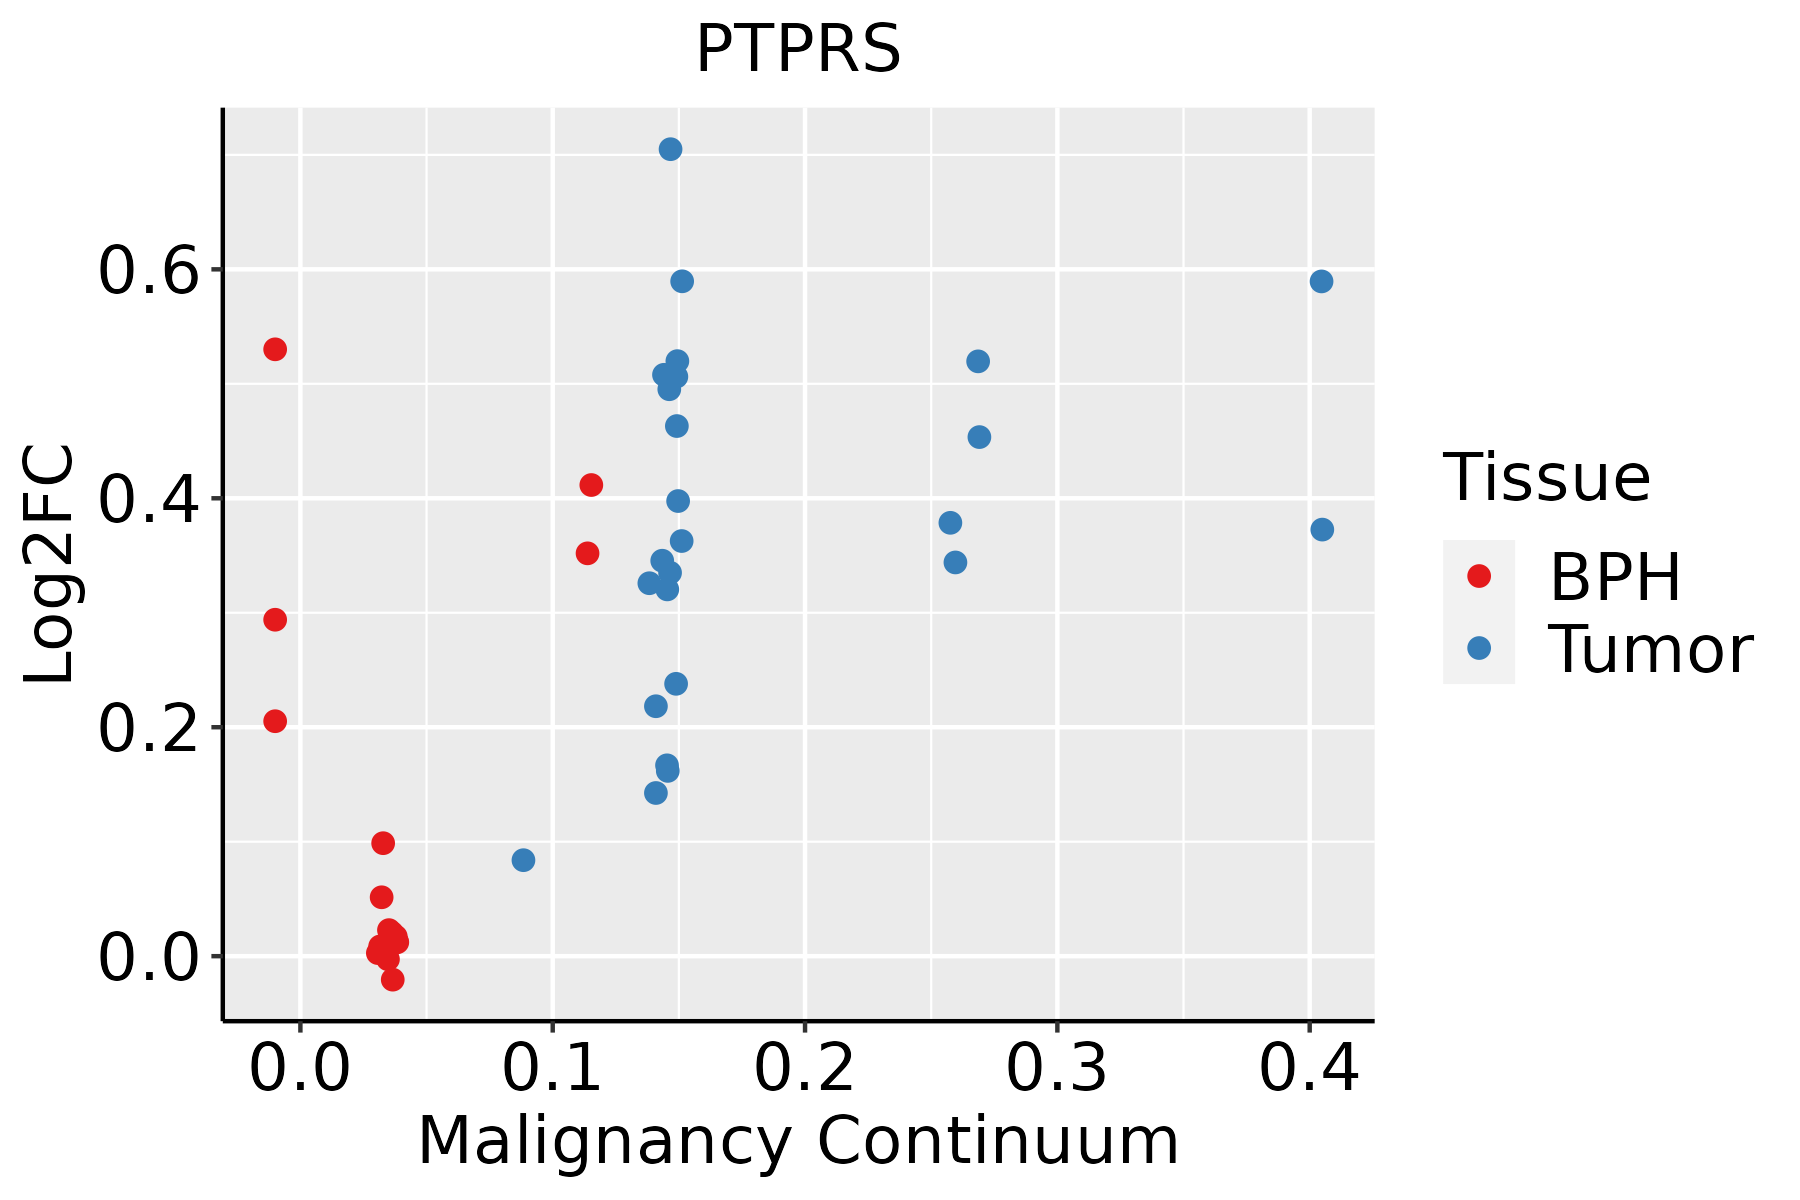 | BPH: Benign Prostatic Hyperplasia |
| Skin |  | AK: Actinic keratosis |
| cSCC: Cutaneous squamous cell carcinoma | ||
| SCCIS:squamous cell carcinoma in situ |
| ∗log2FC in expression of this searched gene in stem-like cells from each diseased tissue sample relative to stem-like cells in normal samples in each tissue plotted against the malignancy continuum. Samples are colored based on if they are from different disease stage. |
Top |
Malignant transformation related pathway analysis |
| Find out the enriched GO biological processes and KEGG pathways involved in transition from healthy to precancer to cancer |
| Tissue | Disease Stage | Enriched GO biological Processes |
| Colorectum | AD |  |
| Colorectum | SER |  |
| Colorectum | MSS |  |
| Colorectum | MSI-H |  |
| Colorectum | FAP |  |
| ∗Top 15 enriched GO BP terms are showed in the bar plot of each disease state in each tissue. Each row represents a significant GO biological process which is colored according to the -log10(p.adjust). |
| Page: 1 2 3 4 5 6 7 8 9 |
| GO ID | Tissue | Disease Stage | Description | Gene Ratio | Bg Ratio | pvalue | p.adjust | Count |
| GO:00027644 | Cervix | CC | immune response-regulating signaling pathway | 97/2311 | 468/18723 | 1.49e-07 | 7.07e-06 | 97 |
| GO:00343298 | Cervix | CC | cell junction assembly | 88/2311 | 420/18723 | 3.42e-07 | 1.38e-05 | 88 |
| GO:00163587 | Cervix | CC | dendrite development | 58/2311 | 243/18723 | 4.52e-07 | 1.76e-05 | 58 |
| GO:19030349 | Cervix | CC | regulation of response to wounding | 44/2311 | 167/18723 | 6.33e-07 | 2.31e-05 | 44 |
| GO:00109757 | Cervix | CC | regulation of neuron projection development | 88/2311 | 445/18723 | 4.26e-06 | 1.09e-04 | 88 |
| GO:00160498 | Cervix | CC | cell growth | 92/2311 | 482/18723 | 1.16e-05 | 2.49e-04 | 92 |
| GO:00064708 | Cervix | CC | protein dephosphorylation | 60/2311 | 281/18723 | 1.33e-05 | 2.68e-04 | 60 |
| GO:00310996 | Cervix | CC | regeneration | 46/2311 | 198/18723 | 1.43e-05 | 2.84e-04 | 46 |
| GO:00609965 | Cervix | CC | dendritic spine development | 28/2311 | 99/18723 | 1.61e-05 | 3.15e-04 | 28 |
| GO:00325359 | Cervix | CC | regulation of cellular component size | 76/2311 | 383/18723 | 1.66e-05 | 3.21e-04 | 76 |
| GO:00615647 | Cervix | CC | axon development | 89/2311 | 467/18723 | 1.71e-05 | 3.27e-04 | 89 |
| GO:00022212 | Cervix | CC | pattern recognition receptor signaling pathway | 39/2311 | 172/18723 | 1.08e-04 | 1.38e-03 | 39 |
| GO:00074097 | Cervix | CC | axonogenesis | 78/2311 | 418/18723 | 1.14e-04 | 1.43e-03 | 78 |
| GO:00622073 | Cervix | CC | regulation of pattern recognition receptor signaling pathway | 27/2311 | 105/18723 | 1.37e-04 | 1.68e-03 | 27 |
| GO:00015588 | Cervix | CC | regulation of cell growth | 77/2311 | 414/18723 | 1.40e-04 | 1.70e-03 | 77 |
| GO:00609984 | Cervix | CC | regulation of dendritic spine development | 18/2311 | 61/18723 | 2.84e-04 | 3.07e-03 | 18 |
| GO:19021153 | Cervix | CC | regulation of organelle assembly | 40/2311 | 186/18723 | 2.92e-04 | 3.15e-03 | 40 |
| GO:000206410 | Cervix | CC | epithelial cell development | 45/2311 | 220/18723 | 4.14e-04 | 4.21e-03 | 45 |
| GO:00507705 | Cervix | CC | regulation of axonogenesis | 34/2311 | 154/18723 | 4.87e-04 | 4.76e-03 | 34 |
| GO:19018886 | Cervix | CC | regulation of cell junction assembly | 42/2311 | 204/18723 | 5.50e-04 | 5.29e-03 | 42 |
| Page: 1 2 3 4 5 6 7 8 9 10 11 12 13 14 15 |
| Pathway ID | Tissue | Disease Stage | Description | Gene Ratio | Bg Ratio | pvalue | p.adjust | qvalue | Count |
| hsa045147 | Cervix | CC | Cell adhesion molecules | 36/1267 | 157/8465 | 4.94e-03 | 1.67e-02 | 9.86e-03 | 36 |
| hsa0451412 | Cervix | CC | Cell adhesion molecules | 36/1267 | 157/8465 | 4.94e-03 | 1.67e-02 | 9.86e-03 | 36 |
| Page: 1 |
Top |
Cell-cell communication analysis |
| Identification of potential cell-cell interactions between two cell types and their ligand-receptor pairs for different disease states |
| Ligand | Receptor | LRpair | Pathway | Tissue | Disease Stage |
| Page: 1 |
Top |
Single-cell gene regulatory network inference analysis |
| Find out the significant the regulons (TFs) and the target genes of each regulon across cell types for different disease states |
| TF | Cell Type | Tissue | Disease Stage | Target Gene | RSS | Regulon Activity |
| ∗The dot plots of a searched regulon are shown for all cell subpopulations in each disease state of each tissue based on the regulon specific score inferred using pySCENIC and by calculating the average expression. |
| Page: 1 |
Top |
Somatic mutation of malignant transformation related genes |
| Annotation of somatic variants for genes involved in malignant transformation |
| Hugo Symbol | Variant Class | Variant Classification | dbSNP RS | HGVSc | HGVSp | HGVSp Short | SWISSPROT | BIOTYPE | SIFT | PolyPhen | Tumor Sample Barcode | Tissue | Histology | Sex | Age | Stage | Therapy Types | Drugs | Outcome |
| PTPRS | SNV | Missense_Mutation | rs758242063 | c.554N>G | p.Lys185Arg | p.K185R | Q13332 | protein_coding | deleterious(0.04) | probably_damaging(0.986) | TCGA-A8-A081-01 | Breast | breast invasive carcinoma | Female | >=65 | I/II | Unknown | Unknown | SD |
| PTPRS | SNV | Missense_Mutation | rs749770933 | c.4976N>A | p.Arg1659His | p.R1659H | Q13332 | protein_coding | deleterious(0.02) | probably_damaging(0.996) | TCGA-AN-A0FT-01 | Breast | breast invasive carcinoma | Female | <65 | I/II | Unknown | Unknown | SD |
| PTPRS | SNV | Missense_Mutation | rs771478606 | c.4886N>G | p.Asn1629Ser | p.N1629S | Q13332 | protein_coding | deleterious(0) | probably_damaging(0.998) | TCGA-E9-A1R6-01 | Breast | breast invasive carcinoma | Female | <65 | I/II | Hormone Therapy | tamoxiphen | SD |
| PTPRS | insertion | In_Frame_Ins | novel | c.3570_3571insACCCAAGGCCAGGCTGGT | p.Arg1190_Leu1191insThrGlnGlyGlnAlaGly | p.R1190_L1191insTQGQAG | Q13332 | protein_coding | TCGA-A2-A0CP-01 | Breast | breast invasive carcinoma | Female | <65 | I/II | Chemotherapy | cytoxan | SD | ||
| PTPRS | insertion | In_Frame_Ins | novel | c.5580_5581insAGAGTC | p.Ile1860_Gly1861insArgVal | p.I1860_G1861insRV | Q13332 | protein_coding | TCGA-A8-A06P-01 | Breast | breast invasive carcinoma | Female | <65 | III/IV | Unspecific | SD | |||
| PTPRS | insertion | Frame_Shift_Ins | novel | c.5578_5579insGCCCCAAGCTTAGGCTGTCCCATCTGGGCTG | p.Ile1860SerfsTer16 | p.I1860Sfs*16 | Q13332 | protein_coding | TCGA-A8-A06P-01 | Breast | breast invasive carcinoma | Female | <65 | III/IV | Unspecific | SD | |||
| PTPRS | insertion | In_Frame_Ins | novel | c.3910_3911insAAG | p.Leu1304delinsGlnVal | p.L1304delinsQV | Q13332 | protein_coding | TCGA-A8-A07U-01 | Breast | breast invasive carcinoma | Female | >=65 | III/IV | Chemotherapy | 5-fluorouracil | SD | ||
| PTPRS | insertion | Frame_Shift_Ins | novel | c.3909_3910insTTCAACTCAG | p.Leu1304PhefsTer13 | p.L1304Ffs*13 | Q13332 | protein_coding | TCGA-A8-A07U-01 | Breast | breast invasive carcinoma | Female | >=65 | III/IV | Chemotherapy | 5-fluorouracil | SD | ||
| PTPRS | deletion | Frame_Shift_Del | novel | c.4210delN | p.Gln1404SerfsTer12 | p.Q1404Sfs*12 | Q13332 | protein_coding | TCGA-D8-A27V-01 | Breast | breast invasive carcinoma | Female | <65 | I/II | Hormone Therapy | tamoxiphen | SD | ||
| PTPRS | deletion | Frame_Shift_Del | novel | c.3363delN | p.Leu1122SerfsTer36 | p.L1122Sfs*36 | Q13332 | protein_coding | TCGA-D8-A27V-01 | Breast | breast invasive carcinoma | Female | <65 | I/II | Hormone Therapy | tamoxiphen | SD |
| Page: 1 2 3 4 5 6 7 8 9 10 11 12 13 14 15 16 17 18 19 20 |
Top |
Related drugs of malignant transformation related genes |
| Identification of chemicals and drugs interact with genes involved in malignant transfromation |
| (DGIdb 4.0) |
| Entrez ID | Symbol | Category | Interaction Types | Drug Claim Name | Drug Name | PMIDs |
| 5802 | PTPRS | DRUGGABLE GENOME, PROTEIN PHOSPHATASE, KINASE, CLINICALLY ACTIONABLE | inhibitor | 252827507 | ||
| 5802 | PTPRS | DRUGGABLE GENOME, PROTEIN PHOSPHATASE, KINASE, CLINICALLY ACTIONABLE | Etidronic acid | |||
| 5802 | PTPRS | DRUGGABLE GENOME, PROTEIN PHOSPHATASE, KINASE, CLINICALLY ACTIONABLE | inhibitor | 381118819 |
| Page: 1 |

Copyright 2023-Present -The University of Texas Health Science Center at Houston |