
|
|||||
|
 | |
| |
| |
| |
| |
| |
|
Gene: PTPRR |
Gene summary for PTPRR |
| Gene information | Species | Human | Gene symbol | PTPRR | Gene ID | 5801 |
| Gene name | protein tyrosine phosphatase receptor type R | |
| Gene Alias | EC-PTP | |
| Cytomap | 12q15 | |
| Gene Type | protein-coding | GO ID | GO:0000165 | UniProtAcc | Q15256 |
Top |
Malignant transformation analysis |
| Identification of the aberrant gene expression in precancerous and cancerous lesions by comparing the gene expression of stem-like cells in diseased tissues with normal stem cells |
| Entrez ID | Symbol | Replicates | Species | Organ | Tissue | Adj P-value | Log2FC | Malignancy |
| 5801 | PTPRR | HTA11_2487_2000001011 | Human | Colorectum | SER | 1.98e-08 | 4.39e-01 | -0.1808 |
| 5801 | PTPRR | HTA11_411_2000001011 | Human | Colorectum | SER | 2.16e-05 | 1.42e+00 | -0.2602 |
| 5801 | PTPRR | HTA11_2112_2000001011 | Human | Colorectum | SER | 2.18e-02 | 5.97e-01 | -0.2196 |
| 5801 | PTPRR | HTA11_3361_2000001011 | Human | Colorectum | AD | 3.25e-02 | 2.29e-01 | -0.1207 |
| 5801 | PTPRR | HTA11_1391_2000001011 | Human | Colorectum | AD | 2.28e-02 | 1.38e-01 | -0.059 |
| 5801 | PTPRR | HTA11_7663_2000001011 | Human | Colorectum | SER | 5.83e-13 | 9.62e-01 | 0.0131 |
| 5801 | PTPRR | HTA11_6818_2000001011 | Human | Colorectum | AD | 7.51e-51 | 2.09e+00 | 0.0112 |
| 5801 | PTPRR | HTA11_6818_2000001021 | Human | Colorectum | AD | 1.01e-54 | 1.52e+00 | 0.0588 |
| 5801 | PTPRR | HTA11_99999965062_69753 | Human | Colorectum | MSI-H | 1.05e-03 | 6.85e-01 | 0.3487 |
| 5801 | PTPRR | ATC09 | Human | Thyroid | ATC | 2.95e-02 | 1.33e-01 | 0.2871 |
| 5801 | PTPRR | ATC13 | Human | Thyroid | ATC | 8.02e-68 | 1.87e+00 | 0.34 |
| 5801 | PTPRR | ATC1 | Human | Thyroid | ATC | 8.56e-03 | 1.56e-01 | 0.2878 |
| 5801 | PTPRR | ATC5 | Human | Thyroid | ATC | 7.60e-77 | 1.96e+00 | 0.34 |
| Page: 1 |
| Tissue | Expression Dynamics | Abbreviation |
| Colorectum (GSE201348) |  | FAP: Familial adenomatous polyposis |
| CRC: Colorectal cancer | ||
| Colorectum (HTA11) |  | AD: Adenomas |
| SER: Sessile serrated lesions | ||
| MSI-H: Microsatellite-high colorectal cancer | ||
| MSS: Microsatellite stable colorectal cancer | ||
| Thyroid | 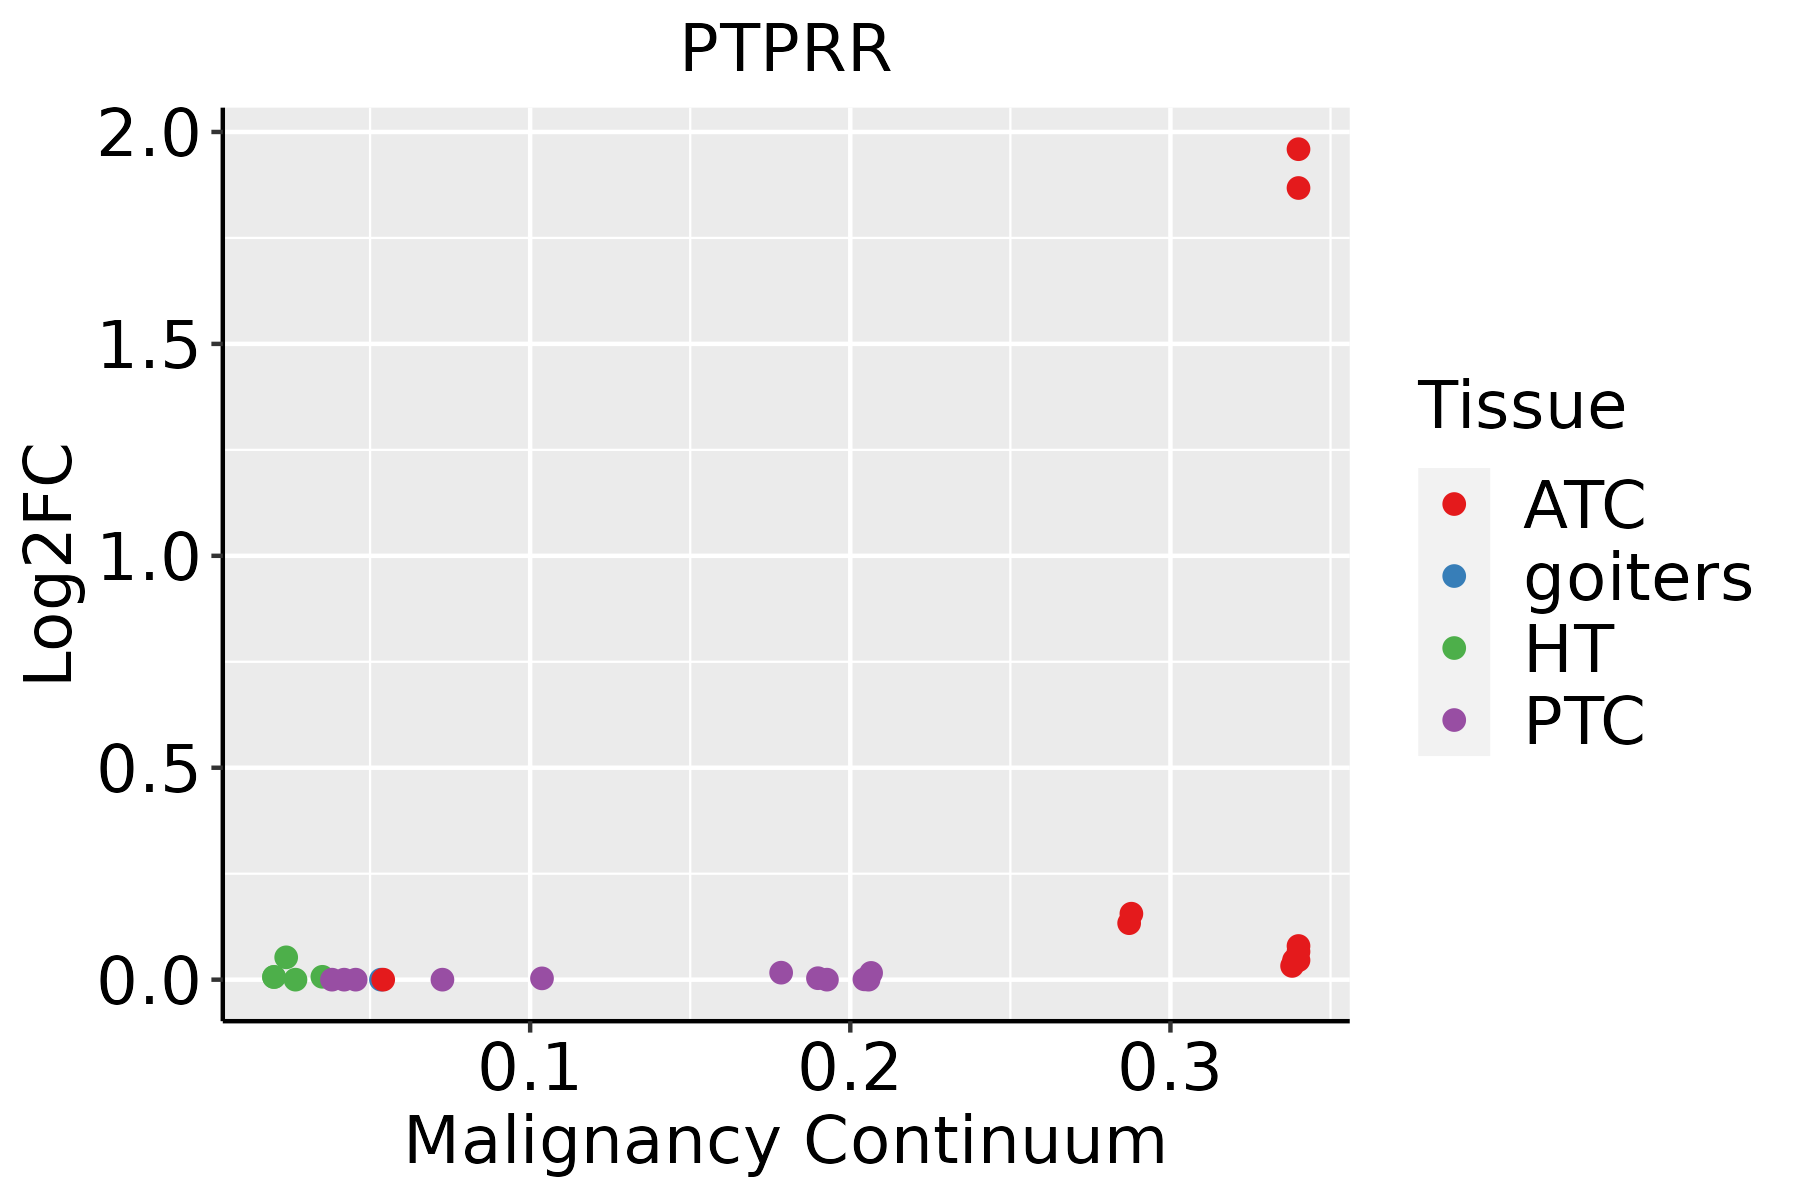 | ATC: Anaplastic thyroid cancer |
| HT: Hashimoto's thyroiditis | ||
| PTC: Papillary thyroid cancer |
| ∗log2FC in expression of this searched gene in stem-like cells from each diseased tissue sample relative to stem-like cells in normal samples in each tissue plotted against the malignancy continuum. Samples are colored based on if they are from different disease stage. |
Top |
Malignant transformation related pathway analysis |
| Find out the enriched GO biological processes and KEGG pathways involved in transition from healthy to precancer to cancer |
| Tissue | Disease Stage | Enriched GO biological Processes |
| Colorectum | AD |  |
| Colorectum | SER |  |
| Colorectum | MSS |  |
| Colorectum | MSI-H |  |
| Colorectum | FAP |  |
| ∗Top 15 enriched GO BP terms are showed in the bar plot of each disease state in each tissue. Each row represents a significant GO biological process which is colored according to the -log10(p.adjust). |
| Page: 1 2 3 4 5 6 7 8 9 |
| GO ID | Tissue | Disease Stage | Description | Gene Ratio | Bg Ratio | pvalue | p.adjust | Count |
| GO:0038127 | Colorectum | AD | ERBB signaling pathway | 55/3918 | 121/18723 | 1.19e-09 | 8.85e-08 | 55 |
| GO:0016311 | Colorectum | AD | dephosphorylation | 123/3918 | 417/18723 | 1.84e-05 | 3.82e-04 | 123 |
| GO:0001667 | Colorectum | AD | ameboidal-type cell migration | 137/3918 | 475/18723 | 2.17e-05 | 4.33e-04 | 137 |
| GO:0001701 | Colorectum | AD | in utero embryonic development | 110/3918 | 367/18723 | 2.36e-05 | 4.62e-04 | 110 |
| GO:0006470 | Colorectum | AD | protein dephosphorylation | 88/3918 | 281/18723 | 2.56e-05 | 4.89e-04 | 88 |
| GO:0090132 | Colorectum | AD | epithelium migration | 105/3918 | 360/18723 | 1.18e-04 | 1.73e-03 | 105 |
| GO:0010632 | Colorectum | AD | regulation of epithelial cell migration | 88/3918 | 292/18723 | 1.19e-04 | 1.75e-03 | 88 |
| GO:0010631 | Colorectum | AD | epithelial cell migration | 104/3918 | 357/18723 | 1.33e-04 | 1.90e-03 | 104 |
| GO:0090130 | Colorectum | AD | tissue migration | 105/3918 | 365/18723 | 2.10e-04 | 2.77e-03 | 105 |
| GO:0043409 | Colorectum | AD | negative regulation of MAPK cascade | 57/3918 | 180/18723 | 4.61e-04 | 5.14e-03 | 57 |
| GO:00016671 | Colorectum | SER | ameboidal-type cell migration | 105/2897 | 475/18723 | 6.97e-05 | 1.59e-03 | 105 |
| GO:00381271 | Colorectum | SER | ERBB signaling pathway | 35/2897 | 121/18723 | 1.21e-04 | 2.49e-03 | 35 |
| GO:00901321 | Colorectum | SER | epithelium migration | 82/2897 | 360/18723 | 1.50e-04 | 2.93e-03 | 82 |
| GO:00106311 | Colorectum | SER | epithelial cell migration | 81/2897 | 357/18723 | 1.87e-04 | 3.44e-03 | 81 |
| GO:00901301 | Colorectum | SER | tissue migration | 82/2897 | 365/18723 | 2.40e-04 | 4.12e-03 | 82 |
| GO:00106321 | Colorectum | SER | regulation of epithelial cell migration | 68/2897 | 292/18723 | 2.72e-04 | 4.53e-03 | 68 |
| GO:00064701 | Colorectum | SER | protein dephosphorylation | 65/2897 | 281/18723 | 4.44e-04 | 6.51e-03 | 65 |
| GO:00434091 | Colorectum | SER | negative regulation of MAPK cascade | 45/2897 | 180/18723 | 5.81e-04 | 7.98e-03 | 45 |
| GO:00163111 | Colorectum | SER | dephosphorylation | 86/2897 | 417/18723 | 2.73e-03 | 2.46e-02 | 86 |
| GO:00017011 | Colorectum | SER | in utero embryonic development | 77/2897 | 367/18723 | 2.77e-03 | 2.48e-02 | 77 |
| Page: 1 2 3 |
| Pathway ID | Tissue | Disease Stage | Description | Gene Ratio | Bg Ratio | pvalue | p.adjust | qvalue | Count |
| Page: 1 |
Top |
Cell-cell communication analysis |
| Identification of potential cell-cell interactions between two cell types and their ligand-receptor pairs for different disease states |
| Ligand | Receptor | LRpair | Pathway | Tissue | Disease Stage |
| Page: 1 |
Top |
Single-cell gene regulatory network inference analysis |
| Find out the significant the regulons (TFs) and the target genes of each regulon across cell types for different disease states |
| TF | Cell Type | Tissue | Disease Stage | Target Gene | RSS | Regulon Activity |
| ∗The dot plots of a searched regulon are shown for all cell subpopulations in each disease state of each tissue based on the regulon specific score inferred using pySCENIC and by calculating the average expression. |
| Page: 1 |
Top |
Somatic mutation of malignant transformation related genes |
| Annotation of somatic variants for genes involved in malignant transformation |
| Hugo Symbol | Variant Class | Variant Classification | dbSNP RS | HGVSc | HGVSp | HGVSp Short | SWISSPROT | BIOTYPE | SIFT | PolyPhen | Tumor Sample Barcode | Tissue | Histology | Sex | Age | Stage | Therapy Types | Drugs | Outcome |
| PTPRR | SNV | Missense_Mutation | rs144153905 | c.1238C>T | p.Pro413Leu | p.P413L | Q15256 | protein_coding | deleterious(0) | probably_damaging(0.998) | TCGA-AN-A0AK-01 | Breast | breast invasive carcinoma | Female | >=65 | I/II | Unknown | Unknown | SD |
| PTPRR | SNV | Missense_Mutation | c.1748C>A | p.Pro583His | p.P583H | Q15256 | protein_coding | deleterious(0) | probably_damaging(1) | TCGA-BH-A0AV-01 | Breast | breast invasive carcinoma | Female | <65 | I/II | Chemotherapy | taxotere | CR | |
| PTPRR | SNV | Missense_Mutation | novel | c.1733C>T | p.Ser578Phe | p.S578F | Q15256 | protein_coding | tolerated(0.08) | possibly_damaging(0.837) | TCGA-PE-A5DE-01 | Breast | breast invasive carcinoma | Female | <65 | I/II | Chemotherapy | taxotere | CR |
| PTPRR | insertion | In_Frame_Ins | novel | c.1797_1798insTCACTTAGCATAATATCCTCAAGGTTCATCTATGTTGTA | p.Ile599_Ala600insSerLeuSerIleIleSerSerArgPheIleTyrValVal | p.I599_A600insSLSIISSRFIYVV | Q15256 | protein_coding | TCGA-A8-A07U-01 | Breast | breast invasive carcinoma | Female | >=65 | III/IV | Chemotherapy | 5-fluorouracil | SD | ||
| PTPRR | SNV | Missense_Mutation | novel | c.1609N>A | p.Gln537Lys | p.Q537K | Q15256 | protein_coding | tolerated(0.36) | benign(0.049) | TCGA-C5-A1BF-01 | Cervix | cervical & endocervical cancer | Female | <65 | I/II | Chemotherapy | cisplatin | PD |
| PTPRR | SNV | Missense_Mutation | rs779525997 | c.742N>A | p.Leu248Ile | p.L248I | Q15256 | protein_coding | tolerated(0.09) | benign(0.012) | TCGA-A6-6141-01 | Colorectum | colon adenocarcinoma | Male | <65 | I/II | Chemotherapy | 5-fu | SD |
| PTPRR | SNV | Missense_Mutation | rs752997522 | c.1259N>A | p.Arg420His | p.R420H | Q15256 | protein_coding | deleterious(0) | probably_damaging(0.999) | TCGA-AA-3949-01 | Colorectum | colon adenocarcinoma | Female | >=65 | III/IV | Unknown | Unknown | SD |
| PTPRR | SNV | Missense_Mutation | c.1592N>A | p.Arg531Gln | p.R531Q | Q15256 | protein_coding | deleterious(0) | probably_damaging(0.998) | TCGA-AA-3984-01 | Colorectum | colon adenocarcinoma | Female | <65 | I/II | Unknown | Unknown | SD | |
| PTPRR | SNV | Missense_Mutation | rs777721053 | c.1127N>A | p.Arg376Gln | p.R376Q | Q15256 | protein_coding | deleterious(0.01) | probably_damaging(0.981) | TCGA-AA-A00N-01 | Colorectum | colon adenocarcinoma | Male | >=65 | I/II | Unknown | Unknown | PD |
| PTPRR | SNV | Missense_Mutation | c.1592N>A | p.Arg531Gln | p.R531Q | Q15256 | protein_coding | deleterious(0) | probably_damaging(0.998) | TCGA-AZ-4315-01 | Colorectum | colon adenocarcinoma | Male | <65 | I/II | Unknown | Unknown | SD |
| Page: 1 2 3 4 5 6 7 8 9 10 11 12 |
Top |
Related drugs of malignant transformation related genes |
| Identification of chemicals and drugs interact with genes involved in malignant transfromation |
| (DGIdb 4.0) |
| Entrez ID | Symbol | Category | Interaction Types | Drug Claim Name | Drug Name | PMIDs |
| Page: 1 |

Copyright 2023-Present -The University of Texas Health Science Center at Houston |