
|
|||||
|
 | |
| |
| |
| |
| |
| |
|
Gene: PTPRM |
Gene summary for PTPRM |
| Gene information | Species | Human | Gene symbol | PTPRM | Gene ID | 5797 |
| Gene name | protein tyrosine phosphatase receptor type M | |
| Gene Alias | PTPRL1 | |
| Cytomap | 18p11.23 | |
| Gene Type | protein-coding | GO ID | GO:0000902 | UniProtAcc | P28827 |
Top |
Malignant transformation analysis |
| Identification of the aberrant gene expression in precancerous and cancerous lesions by comparing the gene expression of stem-like cells in diseased tissues with normal stem cells |
| Entrez ID | Symbol | Replicates | Species | Organ | Tissue | Adj P-value | Log2FC | Malignancy |
| 5797 | PTPRM | AEH-subject1 | Human | Endometrium | AEH | 1.75e-60 | 1.11e+00 | -0.3059 |
| 5797 | PTPRM | AEH-subject2 | Human | Endometrium | AEH | 8.56e-44 | 1.01e+00 | -0.2525 |
| 5797 | PTPRM | AEH-subject3 | Human | Endometrium | AEH | 3.71e-40 | 9.59e-01 | -0.2576 |
| 5797 | PTPRM | AEH-subject4 | Human | Endometrium | AEH | 1.13e-45 | 1.14e+00 | -0.2657 |
| 5797 | PTPRM | AEH-subject5 | Human | Endometrium | AEH | 1.36e-52 | 1.12e+00 | -0.2953 |
| 5797 | PTPRM | EEC-subject1 | Human | Endometrium | EEC | 4.75e-66 | 1.26e+00 | -0.2682 |
| 5797 | PTPRM | EEC-subject2 | Human | Endometrium | EEC | 3.40e-80 | 1.32e+00 | -0.2607 |
| 5797 | PTPRM | EEC-subject3 | Human | Endometrium | EEC | 1.25e-08 | 4.17e-01 | -0.2525 |
| 5797 | PTPRM | EEC-subject4 | Human | Endometrium | EEC | 1.57e-21 | 7.71e-01 | -0.2571 |
| 5797 | PTPRM | EEC-subject5 | Human | Endometrium | EEC | 2.08e-31 | 9.15e-01 | -0.249 |
| 5797 | PTPRM | GSM5276935 | Human | Endometrium | EEC | 1.56e-02 | -1.16e-01 | -0.123 |
| 5797 | PTPRM | GSM6177620_NYU_UCEC1_lib3_lib3 | Human | Endometrium | EEC | 1.64e-03 | -1.35e-02 | -0.1883 |
| 5797 | PTPRM | GSM6177621_NYU_UCEC2_lib1_lib1 | Human | Endometrium | EEC | 1.10e-04 | -1.12e-01 | -0.1934 |
| 5797 | PTPRM | GSM6177622_NYU_UCEC3_lib1_lib1 | Human | Endometrium | EEC | 2.35e-04 | -8.05e-03 | -0.1917 |
| 5797 | PTPRM | GSM6177622_NYU_UCEC3_lib2_lib2 | Human | Endometrium | EEC | 4.44e-02 | 2.48e-02 | -0.1916 |
| 5797 | PTPRM | GSM6177623_NYU_UCEC3_Vis | Human | Endometrium | EEC | 3.19e-13 | 5.29e-01 | -0.1269 |
| 5797 | PTPRM | RNA-P10T2-P10T2-1 | Human | Lung | AAH | 4.42e-02 | 7.73e-01 | -0.1271 |
| 5797 | PTPRM | RNA-P10T2-P10T2-2 | Human | Lung | AAH | 5.82e-05 | 9.09e-01 | -0.1406 |
| 5797 | PTPRM | RNA-P10T2-P10T2-3 | Human | Lung | AAH | 1.29e-05 | 1.01e+00 | -0.1408 |
| 5797 | PTPRM | RNA-P10T2-P10T2-4 | Human | Lung | AAH | 8.57e-09 | 1.17e+00 | -0.138 |
| Page: 1 2 3 4 |
| Tissue | Expression Dynamics | Abbreviation |
| Endometrium |  | AEH: Atypical endometrial hyperplasia |
| EEC: Endometrioid Cancer | ||
| Lung | 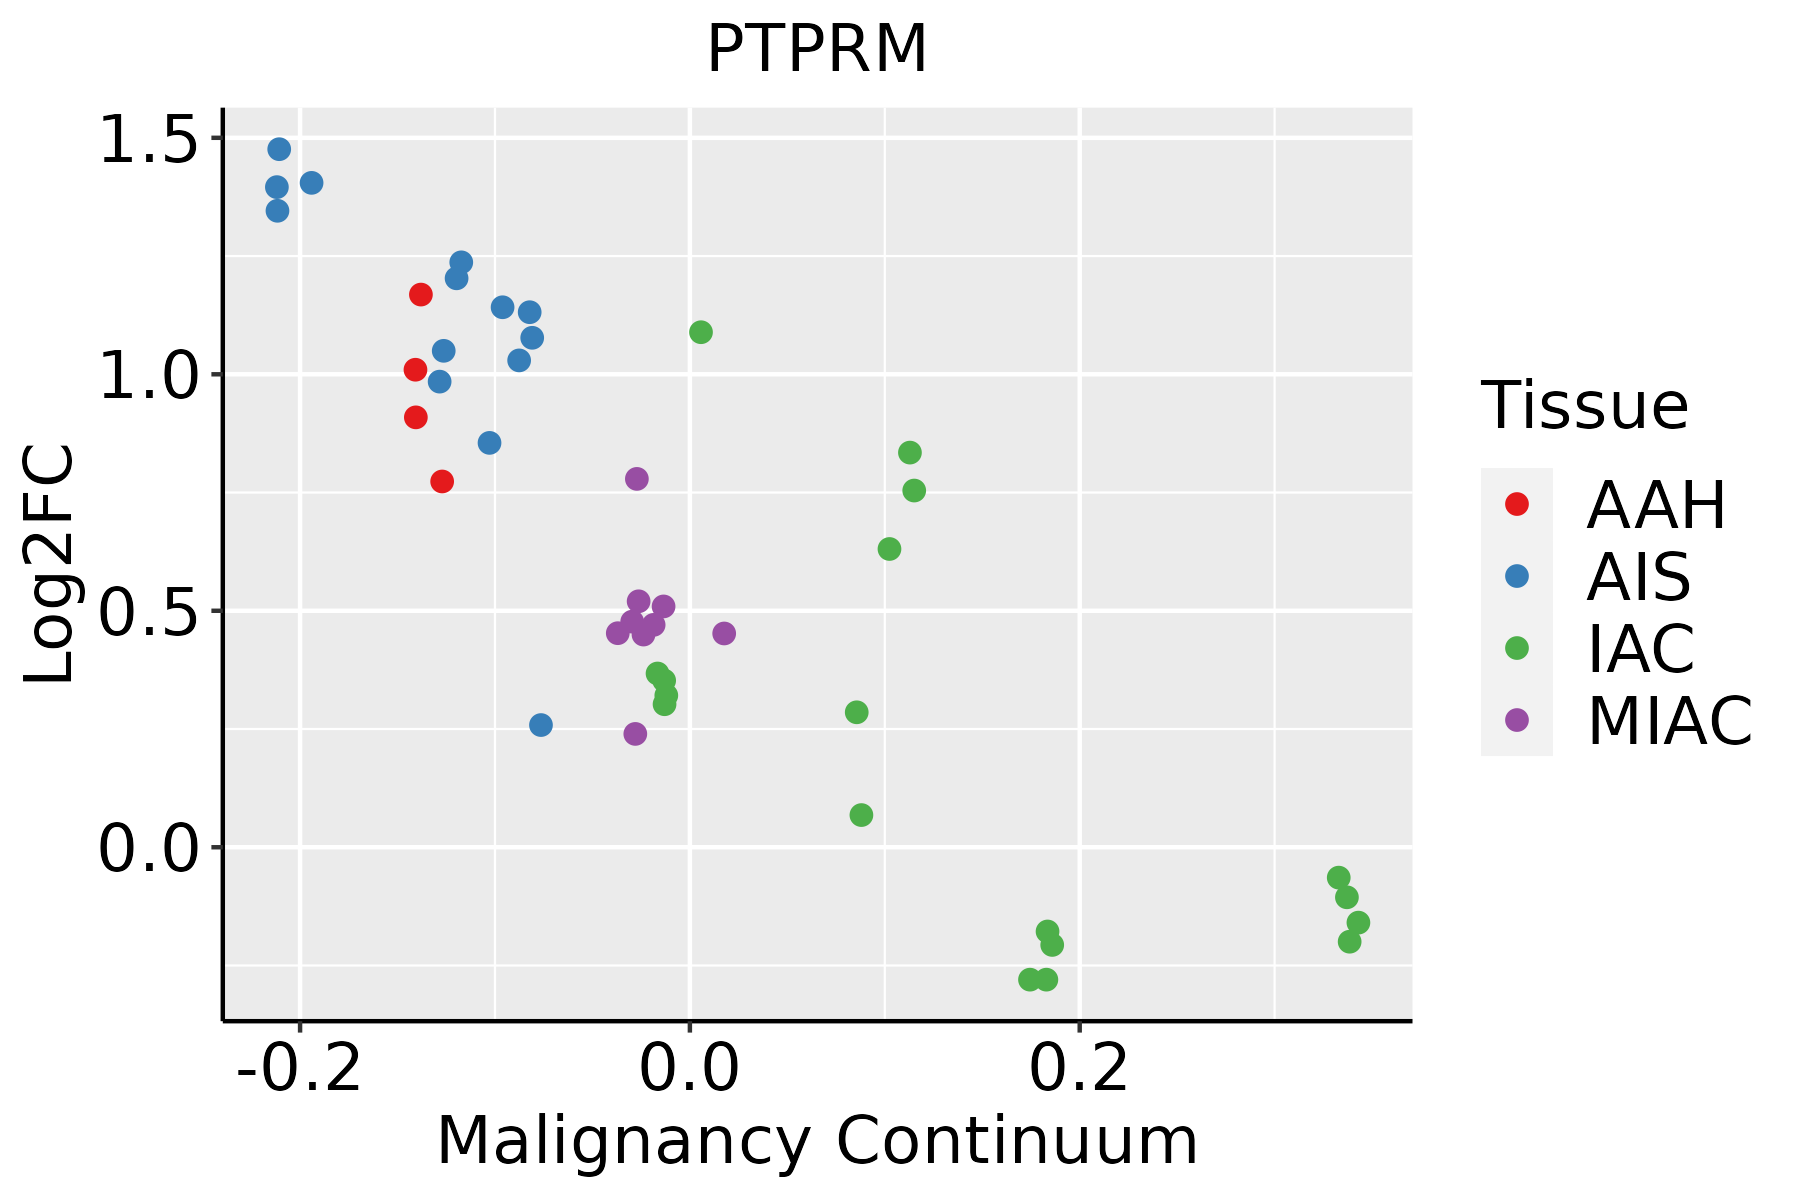 | AAH: Atypical adenomatous hyperplasia |
| AIS: Adenocarcinoma in situ | ||
| IAC: Invasive lung adenocarcinoma | ||
| MIA: Minimally invasive adenocarcinoma | ||
| Prostate |  | BPH: Benign Prostatic Hyperplasia |
| Thyroid |  | ATC: Anaplastic thyroid cancer |
| HT: Hashimoto's thyroiditis | ||
| PTC: Papillary thyroid cancer |
| ∗log2FC in expression of this searched gene in stem-like cells from each diseased tissue sample relative to stem-like cells in normal samples in each tissue plotted against the malignancy continuum. Samples are colored based on if they are from different disease stage. |
Top |
Malignant transformation related pathway analysis |
| Find out the enriched GO biological processes and KEGG pathways involved in transition from healthy to precancer to cancer |
| Tissue | Disease Stage | Enriched GO biological Processes |
| Colorectum | AD |  |
| Colorectum | SER |  |
| Colorectum | MSS |  |
| Colorectum | MSI-H |  |
| Colorectum | FAP |  |
| ∗Top 15 enriched GO BP terms are showed in the bar plot of each disease state in each tissue. Each row represents a significant GO biological process which is colored according to the -log10(p.adjust). |
| Page: 1 2 3 4 5 6 7 8 9 |
| GO ID | Tissue | Disease Stage | Description | Gene Ratio | Bg Ratio | pvalue | p.adjust | Count |
| GO:000166710 | Endometrium | AEH | ameboidal-type cell migration | 90/2100 | 475/18723 | 3.73e-07 | 1.57e-05 | 90 |
| GO:00506738 | Endometrium | AEH | epithelial cell proliferation | 84/2100 | 437/18723 | 4.88e-07 | 1.94e-05 | 84 |
| GO:00074098 | Endometrium | AEH | axonogenesis | 81/2100 | 418/18723 | 5.54e-07 | 2.12e-05 | 81 |
| GO:009013014 | Endometrium | AEH | tissue migration | 73/2100 | 365/18723 | 5.79e-07 | 2.20e-05 | 73 |
| GO:00615648 | Endometrium | AEH | axon development | 88/2100 | 467/18723 | 6.39e-07 | 2.38e-05 | 88 |
| GO:009013214 | Endometrium | AEH | epithelium migration | 72/2100 | 360/18723 | 6.90e-07 | 2.55e-05 | 72 |
| GO:001063114 | Endometrium | AEH | epithelial cell migration | 71/2100 | 357/18723 | 1.02e-06 | 3.52e-05 | 71 |
| GO:001063214 | Endometrium | AEH | regulation of epithelial cell migration | 60/2100 | 292/18723 | 2.31e-06 | 6.77e-05 | 60 |
| GO:00506788 | Endometrium | AEH | regulation of epithelial cell proliferation | 73/2100 | 381/18723 | 3.04e-06 | 8.44e-05 | 73 |
| GO:00303364 | Endometrium | AEH | negative regulation of cell migration | 65/2100 | 344/18723 | 1.65e-05 | 3.42e-04 | 65 |
| GO:20001464 | Endometrium | AEH | negative regulation of cell motility | 67/2100 | 359/18723 | 1.86e-05 | 3.77e-04 | 67 |
| GO:00512714 | Endometrium | AEH | negative regulation of cellular component movement | 68/2100 | 367/18723 | 2.06e-05 | 4.11e-04 | 68 |
| GO:00435428 | Endometrium | AEH | endothelial cell migration | 55/2100 | 279/18723 | 2.11e-05 | 4.15e-04 | 55 |
| GO:00105945 | Endometrium | AEH | regulation of endothelial cell migration | 47/2100 | 232/18723 | 4.02e-05 | 6.91e-04 | 47 |
| GO:00400134 | Endometrium | AEH | negative regulation of locomotion | 70/2100 | 391/18723 | 4.95e-05 | 8.05e-04 | 70 |
| GO:00064709 | Endometrium | AEH | protein dephosphorylation | 50/2100 | 281/18723 | 6.41e-04 | 6.23e-03 | 50 |
| GO:00312902 | Endometrium | AEH | retinal ganglion cell axon guidance | 7/2100 | 19/18723 | 3.28e-03 | 2.30e-02 | 7 |
| GO:000941010 | Endometrium | AEH | response to xenobiotic stimulus | 71/2100 | 462/18723 | 3.66e-03 | 2.50e-02 | 71 |
| GO:0001935 | Endometrium | AEH | endothelial cell proliferation | 33/2100 | 193/18723 | 8.99e-03 | 4.87e-02 | 33 |
| GO:006156412 | Endometrium | EEC | axon development | 93/2168 | 467/18723 | 9.60e-08 | 4.69e-06 | 93 |
| Page: 1 2 3 4 5 6 7 8 9 |
| Pathway ID | Tissue | Disease Stage | Description | Gene Ratio | Bg Ratio | pvalue | p.adjust | qvalue | Count |
| hsa0452025 | Endometrium | AEH | Adherens junction | 36/1197 | 93/8465 | 3.49e-09 | 5.98e-08 | 4.37e-08 | 36 |
| hsa04520111 | Endometrium | AEH | Adherens junction | 36/1197 | 93/8465 | 3.49e-09 | 5.98e-08 | 4.37e-08 | 36 |
| hsa0452026 | Endometrium | EEC | Adherens junction | 36/1237 | 93/8465 | 8.57e-09 | 1.48e-07 | 1.11e-07 | 36 |
| hsa0452035 | Endometrium | EEC | Adherens junction | 36/1237 | 93/8465 | 8.57e-09 | 1.48e-07 | 1.11e-07 | 36 |
| hsa0452016 | Lung | IAC | Adherens junction | 37/1053 | 93/8465 | 1.99e-11 | 2.16e-09 | 1.43e-09 | 37 |
| hsa045146 | Lung | IAC | Cell adhesion molecules | 30/1053 | 157/8465 | 1.03e-02 | 3.83e-02 | 2.54e-02 | 30 |
| hsa0452017 | Lung | IAC | Adherens junction | 37/1053 | 93/8465 | 1.99e-11 | 2.16e-09 | 1.43e-09 | 37 |
| hsa0451411 | Lung | IAC | Cell adhesion molecules | 30/1053 | 157/8465 | 1.03e-02 | 3.83e-02 | 2.54e-02 | 30 |
| hsa0452023 | Lung | AIS | Adherens junction | 34/961 | 93/8465 | 1.59e-10 | 1.29e-08 | 8.26e-09 | 34 |
| hsa0452033 | Lung | AIS | Adherens junction | 34/961 | 93/8465 | 1.59e-10 | 1.29e-08 | 8.26e-09 | 34 |
| hsa0452043 | Lung | AAH | Adherens junction | 16/348 | 93/8465 | 9.99e-07 | 9.29e-05 | 7.47e-05 | 16 |
| hsa0452053 | Lung | AAH | Adherens junction | 16/348 | 93/8465 | 9.99e-07 | 9.29e-05 | 7.47e-05 | 16 |
| hsa0452062 | Lung | MIAC | Adherens junction | 27/507 | 93/8465 | 2.36e-12 | 2.29e-10 | 1.66e-10 | 27 |
| hsa0452072 | Lung | MIAC | Adherens junction | 27/507 | 93/8465 | 2.36e-12 | 2.29e-10 | 1.66e-10 | 27 |
| hsa0452027 | Prostate | BPH | Adherens junction | 55/1718 | 93/8465 | 1.90e-16 | 4.18e-15 | 2.59e-15 | 55 |
| hsa04520112 | Prostate | BPH | Adherens junction | 55/1718 | 93/8465 | 1.90e-16 | 4.18e-15 | 2.59e-15 | 55 |
| Page: 1 |
Top |
Cell-cell communication analysis |
| Identification of potential cell-cell interactions between two cell types and their ligand-receptor pairs for different disease states |
| Ligand | Receptor | LRpair | Pathway | Tissue | Disease Stage |
| PTPRM | PTPRM | PTPRM_PTPRM | PTPRM | Breast | Healthy |
| PTPRM | PTPRM | PTPRM_PTPRM | PTPRM | Cervix | ADJ |
| PTPRM | PTPRM | PTPRM_PTPRM | PTPRM | Cervix | CC |
| PTPRM | PTPRM | PTPRM_PTPRM | PTPRM | CRC | AD |
| PTPRM | PTPRM | PTPRM_PTPRM | PTPRM | CRC | ADJ |
| PTPRM | PTPRM | PTPRM_PTPRM | PTPRM | CRC | CRC |
| PTPRM | PTPRM | PTPRM_PTPRM | PTPRM | CRC | FAP |
| PTPRM | PTPRM | PTPRM_PTPRM | PTPRM | CRC | MSI-H |
| PTPRM | PTPRM | PTPRM_PTPRM | PTPRM | CRC | MSS |
| PTPRM | PTPRM | PTPRM_PTPRM | PTPRM | CRC | SER |
| PTPRM | PTPRM | PTPRM_PTPRM | PTPRM | Endometrium | ADJ |
| PTPRM | PTPRM | PTPRM_PTPRM | PTPRM | Endometrium | AEH |
| PTPRM | PTPRM | PTPRM_PTPRM | PTPRM | Endometrium | EEC |
| PTPRM | PTPRM | PTPRM_PTPRM | PTPRM | Endometrium | Healthy |
| PTPRM | PTPRM | PTPRM_PTPRM | PTPRM | Esophagus | ESCC |
| PTPRM | PTPRM | PTPRM_PTPRM | PTPRM | Esophagus | Healthy |
| PTPRM | PTPRM | PTPRM_PTPRM | PTPRM | GC | ADJ |
| PTPRM | PTPRM | PTPRM_PTPRM | PTPRM | GC | GC |
| PTPRM | PTPRM | PTPRM_PTPRM | PTPRM | GC | Precancer |
| PTPRM | PTPRM | PTPRM_PTPRM | PTPRM | HNSCC | ADJ |
| Page: 1 2 3 |
Top |
Single-cell gene regulatory network inference analysis |
| Find out the significant the regulons (TFs) and the target genes of each regulon across cell types for different disease states |
| TF | Cell Type | Tissue | Disease Stage | Target Gene | RSS | Regulon Activity |
| ∗The dot plots of a searched regulon are shown for all cell subpopulations in each disease state of each tissue based on the regulon specific score inferred using pySCENIC and by calculating the average expression. |
| Page: 1 |
Top |
Somatic mutation of malignant transformation related genes |
| Annotation of somatic variants for genes involved in malignant transformation |
| Hugo Symbol | Variant Class | Variant Classification | dbSNP RS | HGVSc | HGVSp | HGVSp Short | SWISSPROT | BIOTYPE | SIFT | PolyPhen | Tumor Sample Barcode | Tissue | Histology | Sex | Age | Stage | Therapy Types | Drugs | Outcome |
| PTPRM | SNV | Missense_Mutation | c.1421N>C | p.Ile474Thr | p.I474T | P28827 | protein_coding | tolerated(0.54) | benign(0.127) | TCGA-A8-A09Z-01 | Breast | breast invasive carcinoma | Female | >=65 | I/II | Unknown | Unknown | SD | |
| PTPRM | SNV | Missense_Mutation | novel | c.1591N>T | p.Asp531Tyr | p.D531Y | P28827 | protein_coding | deleterious(0) | probably_damaging(0.999) | TCGA-AN-A046-01 | Breast | breast invasive carcinoma | Female | >=65 | I/II | Unknown | Unknown | SD |
| PTPRM | SNV | Missense_Mutation | c.2346N>T | p.Gln782His | p.Q782H | P28827 | protein_coding | tolerated(0.11) | possibly_damaging(0.789) | TCGA-AN-A0AK-01 | Breast | breast invasive carcinoma | Female | >=65 | I/II | Unknown | Unknown | SD | |
| PTPRM | SNV | Missense_Mutation | rs761396528 | c.3418N>A | p.Val1140Ile | p.V1140I | P28827 | protein_coding | tolerated(0.11) | probably_damaging(0.94) | TCGA-C8-A138-01 | Breast | breast invasive carcinoma | Female | <65 | III/IV | Unknown | Unknown | SD |
| PTPRM | SNV | Missense_Mutation | rs145737173 | c.4145N>A | p.Arg1382His | p.R1382H | P28827 | protein_coding | tolerated(0.16) | possibly_damaging(0.636) | TCGA-E2-A14P-01 | Breast | breast invasive carcinoma | Female | >=65 | III/IV | Targeted Molecular therapy | trastuzumab | SD |
| PTPRM | SNV | Missense_Mutation | novel | c.2879N>C | p.Gly960Ala | p.G960A | P28827 | protein_coding | tolerated(0.14) | benign(0.093) | TCGA-EW-A6SA-01 | Breast | breast invasive carcinoma | Male | <65 | I/II | Unknown | Unknown | SD |
| PTPRM | SNV | Missense_Mutation | c.2796G>C | p.Lys932Asn | p.K932N | P28827 | protein_coding | deleterious(0) | probably_damaging(0.996) | TCGA-GM-A2DL-01 | Breast | breast invasive carcinoma | Female | <65 | I/II | Hormone Therapy | tamoxiphen | CR | |
| PTPRM | SNV | Missense_Mutation | rs765809357 | c.4275G>C | p.Gln1425His | p.Q1425H | P28827 | protein_coding | tolerated(0.3) | possibly_damaging(0.575) | TCGA-JL-A3YX-01 | Breast | breast invasive carcinoma | Female | <65 | I/II | Unknown | Unknown | SD |
| PTPRM | SNV | Missense_Mutation | rs779665748 | c.3661G>A | p.Ala1221Thr | p.A1221T | P28827 | protein_coding | deleterious(0) | probably_damaging(0.997) | TCGA-LL-A9Q3-01 | Breast | breast invasive carcinoma | Female | >=65 | III/IV | Immunotherapy | herceptin | CR |
| PTPRM | insertion | Frame_Shift_Ins | novel | c.352_353insGGTACTGGTGC | p.Val118GlyfsTer5 | p.V118Gfs*5 | P28827 | protein_coding | TCGA-A2-A0CU-01 | Breast | breast invasive carcinoma | Female | >=65 | I/II | Hormone Therapy | tamoxiphen | SD |
| Page: 1 2 3 4 5 6 7 8 9 10 11 12 13 14 15 16 17 18 19 20 21 22 23 24 |
Top |
Related drugs of malignant transformation related genes |
| Identification of chemicals and drugs interact with genes involved in malignant transfromation |
| (DGIdb 4.0) |
| Entrez ID | Symbol | Category | Interaction Types | Drug Claim Name | Drug Name | PMIDs |
| 5797 | PTPRM | DRUGGABLE GENOME, PROTEIN PHOSPHATASE | methotrexate | METHOTREXATE | 24583629 | |
| 5797 | PTPRM | DRUGGABLE GENOME, PROTEIN PHOSPHATASE | inhibitor | 252827513 |
| Page: 1 |

Copyright 2023-Present -The University of Texas Health Science Center at Houston |