Schematic overview of the cellular and molecular mechanisms involved in the cancer progression, including the proposed cellular and molecular mechanisms in cancer cells trajectory. AT1: alveolar type 1 cells; AT2: alveolar type 2 cells; AAH: atypical adenomatous hyperplasia; AIS: adenocarcinoma in situ; MIA: minimally invasive adenocarcinoma; IA: invasive adenocarcinoma; EMT: epithelial-mesenchymal transition

Home

Download

Statistics

Help

Contact

Center for Computational Systems Medicine
leaf

Gene summary

leaf

Malignant transformation analysis

leaf

Malignant transformation related pathway analysis

leaf

Cell-cell communication analysis

leaf

Single-cell gene regulatory network inference analysis

leaf

Somatic mutation of malignant transformation related genes

leaf

Related drugs of malignant transformation related genes

Gene: PTPRH

Gene summary for PTPRH

check button Gene summary.

Gene informationSpeciesHuman
Gene symbol

PTPRH

Gene ID

5794

Gene nameprotein tyrosine phosphatase receptor type H
Gene AliasR-PTP-H
Cytomap19q13.42
Gene Typeprotein-coding
GO ID

GO:0001932

UniProtAcc

NA


Top

Malignant transformation analysis

check button Identification of the aberrant gene expression in precancerous and cancerous lesions by comparing the gene expression of stem-like cells in diseased tissues with normal stem cells
check button Malignant transformation involving gene list.
Entrez IDSymbolReplicatesSpeciesOrganTissueAdj P-valueLog2FCMalignancy
5794PTPRHHTA11_2487_2000001011HumanColorectumSER7.50e-125.20e-01-0.1808
5794PTPRHHTA11_1938_2000001011HumanColorectumAD5.89e-052.75e-01-0.0811
5794PTPRHHTA11_347_2000001011HumanColorectumAD1.80e-134.99e-01-0.1954
5794PTPRHHTA11_411_2000001011HumanColorectumSER5.36e-091.36e+00-0.2602
5794PTPRHHTA11_2112_2000001011HumanColorectumSER1.01e-026.06e-01-0.2196
5794PTPRHHTA11_696_2000001011HumanColorectumAD3.10e-074.25e-01-0.1464
5794PTPRHHTA11_1391_2000001011HumanColorectumAD1.02e-022.74e-01-0.059
5794PTPRHHTA11_5212_2000001011HumanColorectumAD3.27e-044.04e-01-0.2061
5794PTPRHLZE24THumanEsophagusESCC4.15e-029.96e-020.0596
5794PTPRHP1T-EHumanEsophagusESCC2.97e-023.41e-010.0875
5794PTPRHP8T-EHumanEsophagusESCC4.17e-051.57e-010.0889
5794PTPRHP23T-EHumanEsophagusESCC6.53e-092.36e-010.108
5794PTPRHP26T-EHumanEsophagusESCC4.41e-071.91e-010.1276
5794PTPRHP37T-EHumanEsophagusESCC4.27e-061.53e-010.1371
5794PTPRHP75T-EHumanEsophagusESCC1.62e-132.75e-010.1125
5794PTPRHP82T-EHumanEsophagusESCC1.51e-115.56e-010.1072
5794PTPRHP94T-EHumanEsophagusESCC1.38e-054.88e-010.0879
5794PTPRHP104T-EHumanEsophagusESCC3.26e-145.71e-010.0931
5794PTPRHP127T-EHumanEsophagusESCC7.76e-041.09e-010.0826
5794PTPRHP128T-EHumanEsophagusESCC1.29e-093.46e-010.1241
Page: 1 2 

check button Transcriptomic changes along malignancy continuum.
TissueExpression DynamicsAbbreviation
Colorectum (GSE201348)The image shows the transcriptomic changes along malignancy continuum.log2FC in expression of this searched gene in stem-like cells from each diseased tissue sample relative to stem-like cells in normal samples in each tissue plotted against the malignancy continuum. Samples are colored based on if they are from different disease stage.FAP: Familial adenomatous polyposis
CRC: Colorectal cancer
Colorectum (HTA11)The image shows the transcriptomic changes along malignancy continuum.log2FC in expression of this searched gene in stem-like cells from each diseased tissue sample relative to stem-like cells in normal samples in each tissue plotted against the malignancy continuum. Samples are colored based on if they are from different disease stage.AD: Adenomas
SER: Sessile serrated lesions
MSI-H: Microsatellite-high colorectal cancer
MSS: Microsatellite stable colorectal cancer
EsophagusThe image shows the transcriptomic changes along malignancy continuum.log2FC in expression of this searched gene in stem-like cells from each diseased tissue sample relative to stem-like cells in normal samples in each tissue plotted against the malignancy continuum. Samples are colored based on if they are from different disease stage.
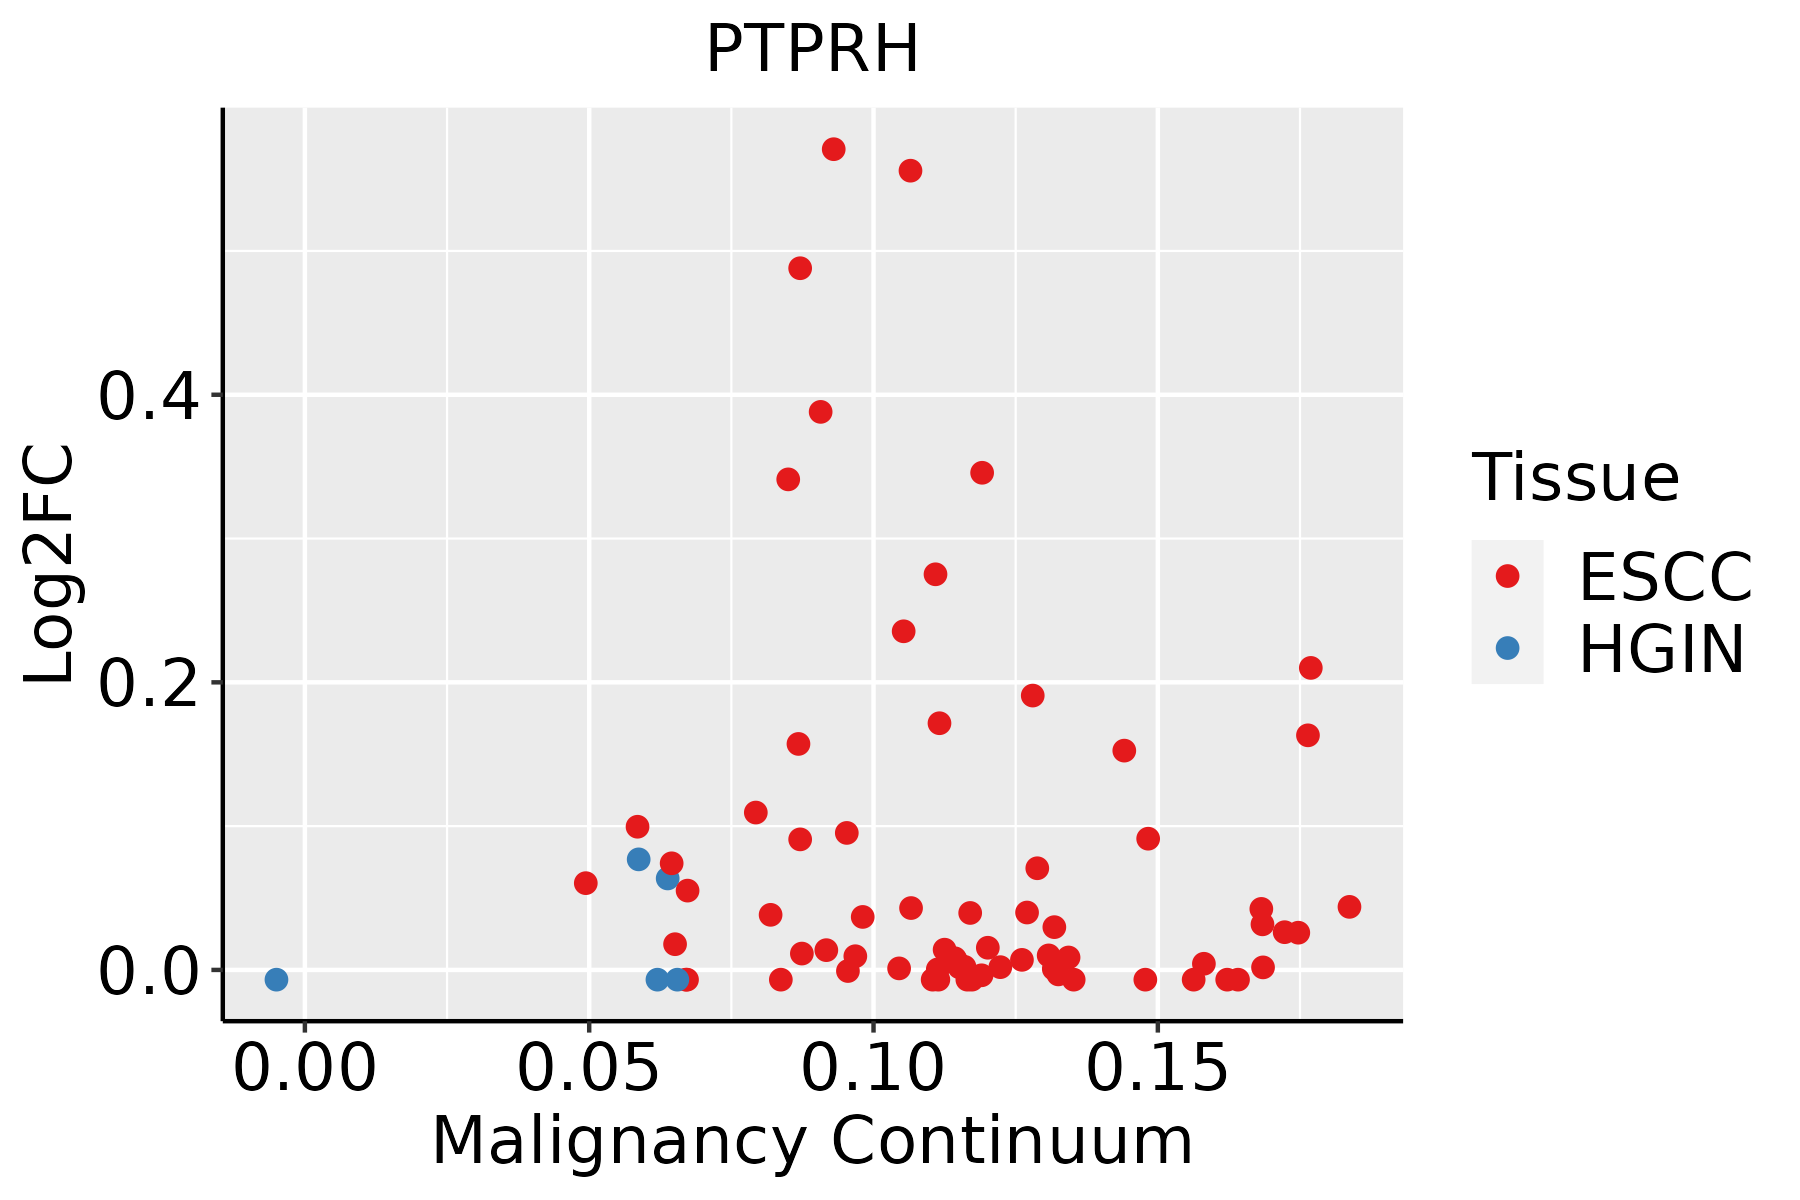
ESCC: Esophageal squamous cell carcinoma
HGIN: High-grade intraepithelial neoplasias
LGIN: Low-grade intraepithelial neoplasias
GCThe image shows the transcriptomic changes along malignancy continuum.log2FC in expression of this searched gene in stem-like cells from each diseased tissue sample relative to stem-like cells in normal samples in each tissue plotted against the malignancy continuum. Samples are colored based on if they are from different disease stage.
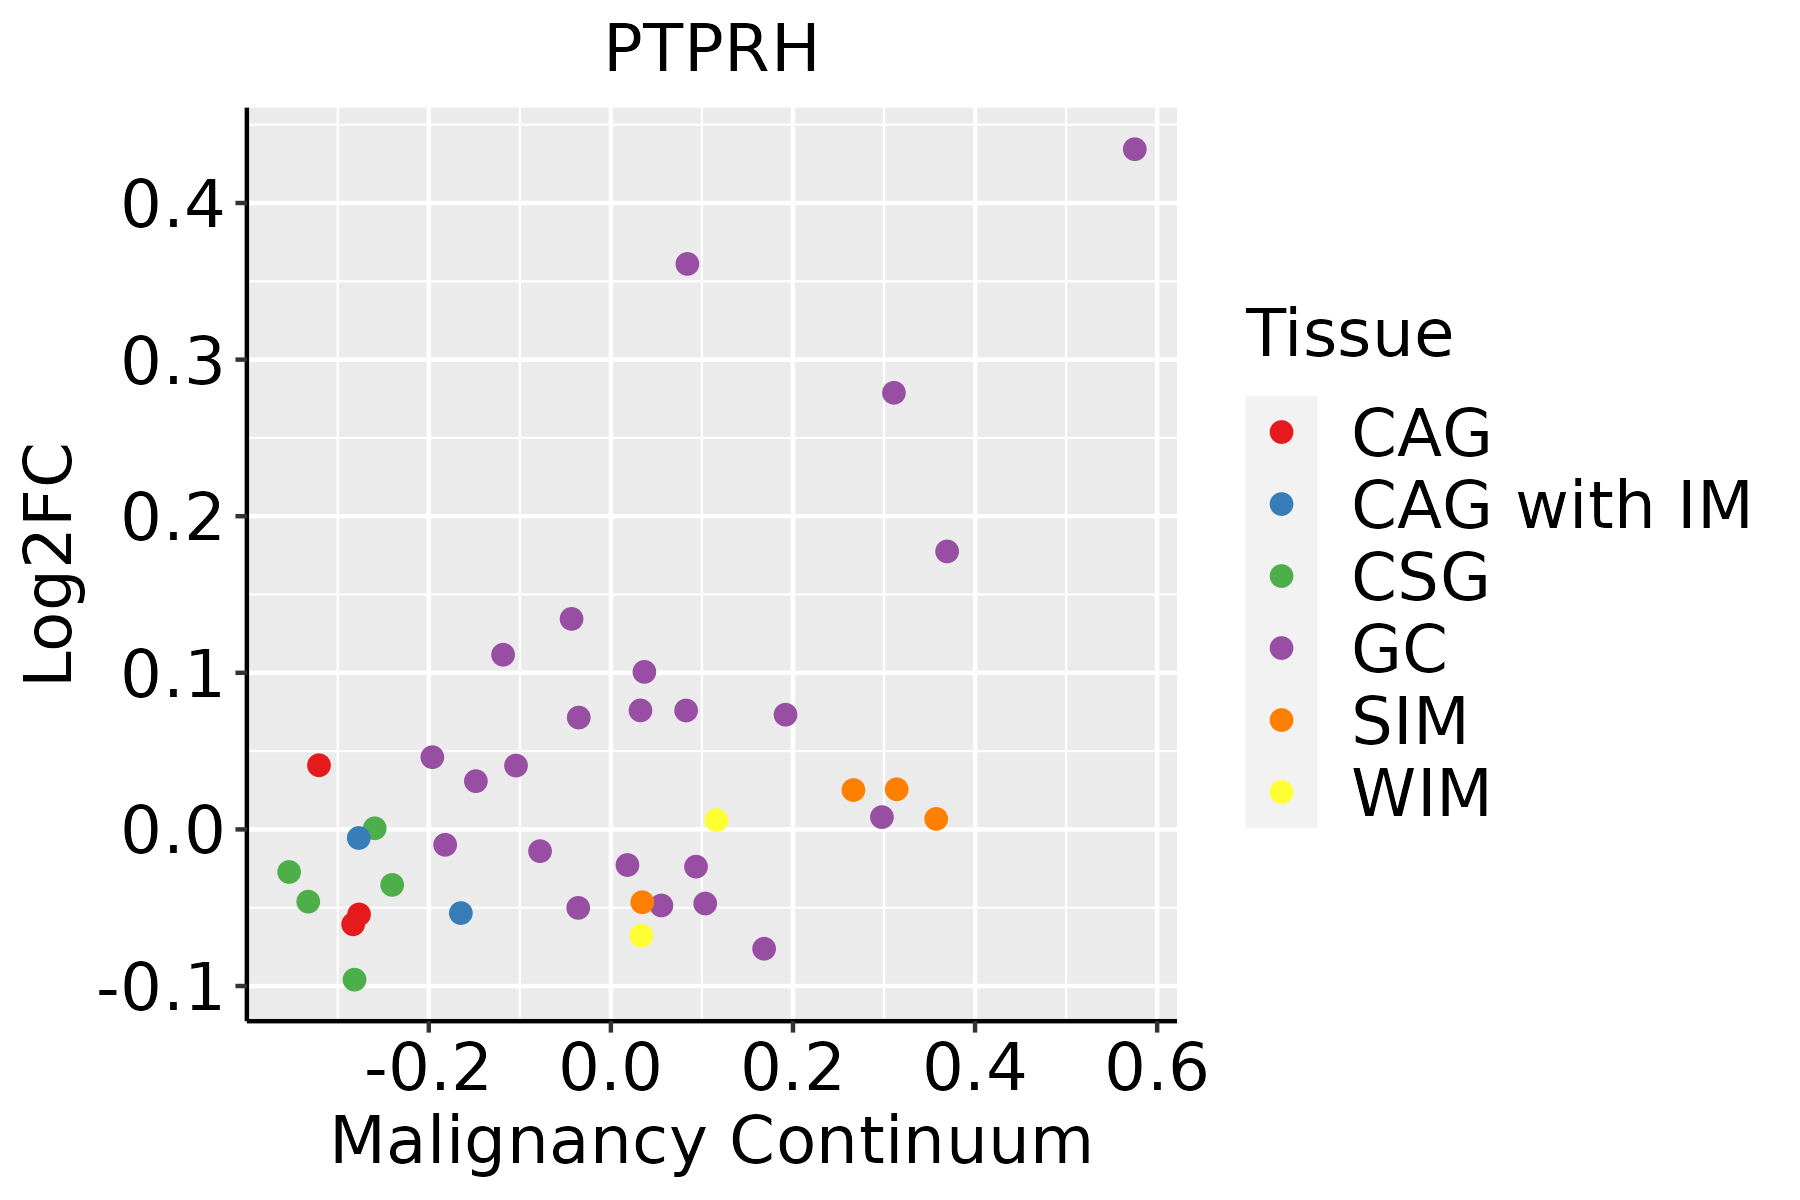
CAG: Chronic atrophic gastritis
CAG with IM: Chronic atrophic gastritis with intestinal metaplasia
CSG: Chronic superficial gastritis
GC: Gastric cancer
SIM: Severe intestinal metaplasia
WIM: Wild intestinal metaplasia
∗log2FC in expression of this searched gene in stem-like cells from each diseased tissue sample relative to stem-like cells in normal samples in each tissue plotted against the malignancy continuum. Samples are colored based on if they are from different disease stage.

Top

Malignant transformation related pathway analysis

check buttonFind out the enriched GO biological processes and KEGG pathways involved in transition from healthy to precancer to cancer
check button Figure of enriched GO biological processes.
TissueDisease StageEnriched GO biological Processes
ColorectumADGO analysis - Figure of enriched GO biological processes: Top 15 enriched GO BP terms are showed in the bar plot of each disease state in each tissue. Each row represents a significant GO biological process which is colored according to the -log10(p.adjust).
ColorectumSERGO analysis - Figure of enriched GO biological processes: Top 15 enriched GO BP terms are showed in the bar plot of each disease state in each tissue. Each row represents a significant GO biological process which is colored according to the -log10(p.adjust).
ColorectumMSSGO analysis - Figure of enriched GO biological processes: Top 15 enriched GO BP terms are showed in the bar plot of each disease state in each tissue. Each row represents a significant GO biological process which is colored according to the -log10(p.adjust).
ColorectumMSI-HGO analysis - Figure of enriched GO biological processes: Top 15 enriched GO BP terms are showed in the bar plot of each disease state in each tissue. Each row represents a significant GO biological process which is colored according to the -log10(p.adjust).
ColorectumFAPGO analysis - Figure of enriched GO biological processes: Top 15 enriched GO BP terms are showed in the bar plot of each disease state in each tissue. Each row represents a significant GO biological process which is colored according to the -log10(p.adjust).
∗Top 15 enriched GO BP terms are showed in the bar plot of each disease state in each tissue. Each row represents a significant GO biological process which is colored according to the -log10(p.adjust).
Page: 1 2 3 4 5 6 7 8 9 

check button Enriched GO biological processes.
GO IDTissueDisease StageDescriptionGene RatioBg Ratiopvaluep.adjustCount
GO:0010563ColorectumADnegative regulation of phosphorus metabolic process130/3918442/187231.26e-052.76e-04130
GO:0045936ColorectumADnegative regulation of phosphate metabolic process129/3918441/187231.81e-053.76e-04129
GO:0016311ColorectumADdephosphorylation123/3918417/187231.84e-053.82e-04123
GO:0051348ColorectumADnegative regulation of transferase activity85/3918268/187232.07e-054.19e-0485
GO:0006470ColorectumADprotein dephosphorylation88/3918281/187232.56e-054.89e-0488
GO:0042326ColorectumADnegative regulation of phosphorylation112/3918385/187238.02e-051.27e-03112
GO:0001933ColorectumADnegative regulation of protein phosphorylation101/3918342/187239.39e-051.42e-03101
GO:0006469ColorectumADnegative regulation of protein kinase activity65/3918212/187235.21e-045.62e-0365
GO:0033673ColorectumADnegative regulation of kinase activity71/3918237/187236.18e-046.47e-0371
GO:00513481ColorectumSERnegative regulation of transferase activity70/2897268/187234.27e-061.62e-0470
GO:00105631ColorectumSERnegative regulation of phosphorus metabolic process101/2897442/187232.39e-056.70e-04101
GO:00459361ColorectumSERnegative regulation of phosphate metabolic process100/2897441/187233.62e-059.39e-04100
GO:00019331ColorectumSERnegative regulation of protein phosphorylation79/2897342/187231.21e-042.49e-0379
GO:00423261ColorectumSERnegative regulation of phosphorylation86/2897385/187232.10e-043.78e-0386
GO:00336731ColorectumSERnegative regulation of kinase activity57/2897237/187233.48e-045.46e-0357
GO:00064691ColorectumSERnegative regulation of protein kinase activity52/2897212/187233.75e-045.74e-0352
GO:00064701ColorectumSERprotein dephosphorylation65/2897281/187234.44e-046.51e-0365
GO:00163111ColorectumSERdephosphorylation86/2897417/187232.73e-032.46e-0286
GO:0010563111EsophagusESCCnegative regulation of phosphorus metabolic process274/8552442/187232.32e-129.41e-11274
GO:0045936111EsophagusESCCnegative regulation of phosphate metabolic process273/8552441/187233.18e-121.25e-10273
Page: 1 2 

check button Enriched KEGG pathways.
Pathway IDTissueDisease StageDescriptionGene RatioBg Ratiopvaluep.adjustqvalueCount
Page: 1 

Top

Cell-cell communication analysis

check buttonIdentification of potential cell-cell interactions between two cell types and their ligand-receptor pairs for different disease states
LigandReceptorLRpairPathwayTissueDisease Stage
Page: 1 

Top

Single-cell gene regulatory network inference analysis

check buttonFind out the significant the regulons (TFs) and the target genes of each regulon across cell types for different disease states
TFCell TypeTissueDisease StageTarget GeneRSSRegulon Activity
∗The dot plots of a searched regulon are shown for all cell subpopulations in each disease state of each tissue based on the regulon specific score inferred using pySCENIC and by calculating the average expression.
Page: 1 

Top

Somatic mutation of malignant transformation related genes

check buttonAnnotation of somatic variants for genes involved in malignant transformation
Hugo SymbolVariant ClassVariant ClassificationdbSNP RSHGVScHGVSpHGVSp ShortSWISSPROTBIOTYPESIFTPolyPhenTumor Sample BarcodeTissueHistologySexAgeStageTherapy TypesDrugsOutcome
PTPRHSNVMissense_Mutationc.2158G>Cp.Gly720Argp.G720RQ9HD43protein_codingdeleterious(0.04)probably_damaging(0.909)TCGA-A1-A0SQ-01Breastbreast invasive carcinomaFemale<65I/IIChemotherapyacSD
PTPRHSNVMissense_Mutationnovelc.2322N>Gp.Phe774Leup.F774LQ9HD43protein_codingtolerated(0.12)benign(0.105)TCGA-AC-A3W6-01Breastbreast invasive carcinomaFemale>=65III/IVUnknownUnknownSD
PTPRHSNVMissense_Mutationc.824N>Tp.Cys275Phep.C275FQ9HD43protein_codingtolerated(1)benign(0.001)TCGA-AO-A12D-01Breastbreast invasive carcinomaFemale<65I/IIChemotherapycyclophosphamideSD
PTPRHSNVMissense_Mutationnovelc.1672N>Cp.Thr558Prop.T558PQ9HD43protein_codingtolerated(0.09)benign(0.106)TCGA-B6-A1KI-01Breastbreast invasive carcinomaFemale<65I/IIUnknownUnknownSD
PTPRHSNVMissense_Mutationrs749839076c.530N>Ap.Gly177Glup.G177EQ9HD43protein_codingtolerated(0.12)probably_damaging(0.954)TCGA-E2-A159-01Breastbreast invasive carcinomaFemale<65I/IIChemotherapycyclophosphamideSD
PTPRHSNVMissense_Mutationc.1772C>Gp.Pro591Argp.P591RQ9HD43protein_codingdeleterious(0.04)possibly_damaging(0.461)TCGA-E9-A1NE-01Breastbreast invasive carcinomaFemale<65I/IIChemotherapydoxorubicinCR
PTPRHSNVMissense_Mutationrs374566236c.2416N>Ap.Ala806Thrp.A806TQ9HD43protein_codingtolerated(0.1)possibly_damaging(0.79)TCGA-EW-A1OX-01Breastbreast invasive carcinomaFemale<65I/IIChemotherapytaxotereSD
PTPRHinsertionIn_Frame_Insnovelc.1802_1803insATCTGCATATAACAGCCGp.Gln601_Trp602insSerAlaTyrAsnSerArgp.Q601_W602insSAYNSRQ9HD43protein_codingTCGA-A2-A0EV-01Breastbreast invasive carcinomaFemale>=65I/IIUnknownUnknownSD
PTPRHinsertionNonsense_Mutationnovelc.551_552insGTGCAGTCTCTCAGCTCCATCCTAGCCCTGCTGAGTGAGAACCTGCp.Tyr184Terp.Y184*Q9HD43protein_codingTCGA-BH-A0BM-01Breastbreast invasive carcinomaFemale<65I/IIChemotherapyadriamycinSD
PTPRHSNVMissense_Mutationnovelc.1639N>Ap.Ala547Thrp.A547TQ9HD43protein_codingtolerated(0.05)possibly_damaging(0.477)TCGA-2W-A8YY-01Cervixcervical & endocervical cancerFemale<65I/IIChemotherapycisplatinCR
Page: 1 2 3 4 5 6 7 8 9 10 11 12 13 14 15 

Top

Related drugs of malignant transformation related genes

check buttonIdentification of chemicals and drugs interact with genes involved in malignant transfromation
(DGIdb 4.0)
Entrez IDSymbolCategoryInteraction TypesDrug Claim NameDrug NamePMIDs
Page: 1