Schematic overview of the cellular and molecular mechanisms involved in the cancer progression, including the proposed cellular and molecular mechanisms in cancer cells trajectory. AT1: alveolar type 1 cells; AT2: alveolar type 2 cells; AAH: atypical adenomatous hyperplasia; AIS: adenocarcinoma in situ; MIA: minimally invasive adenocarcinoma; IA: invasive adenocarcinoma; EMT: epithelial-mesenchymal transition

Home

Download

Statistics

Help

Contact

Center for Computational Systems Medicine
leaf

Gene summary

leaf

Malignant transformation analysis

leaf

Malignant transformation related pathway analysis

leaf

Cell-cell communication analysis

leaf

Single-cell gene regulatory network inference analysis

leaf

Somatic mutation of malignant transformation related genes

leaf

Related drugs of malignant transformation related genes

Gene: PTPRG

Gene summary for PTPRG

check button Gene summary.

Gene informationSpeciesHuman
Gene symbol

PTPRG

Gene ID

5793

Gene nameprotein tyrosine phosphatase receptor type G
Gene AliasHPTPG
Cytomap3p14.2
Gene Typeprotein-coding
GO ID

GO:0001667

UniProtAcc

P23470


Top

Malignant transformation analysis

check button Identification of the aberrant gene expression in precancerous and cancerous lesions by comparing the gene expression of stem-like cells in diseased tissues with normal stem cells
check button Malignant transformation involving gene list.
Entrez IDSymbolReplicatesSpeciesOrganTissueAdj P-valueLog2FCMalignancy
5793PTPRGCCI_1HumanCervixCC2.73e-091.54e+000.528
5793PTPRGCCI_2HumanCervixCC7.17e-035.95e-020.5249
5793PTPRGHTA11_347_2000001011HumanColorectumAD2.21e-044.75e-01-0.1954
5793PTPRGHTA11_1391_2000001011HumanColorectumAD3.20e-101.01e+00-0.059
5793PTPRGHTA11_5212_2000001011HumanColorectumAD7.90e-07-5.79e-01-0.2061
5793PTPRGHTA11_4255_2000001011HumanColorectumSER2.45e-056.13e-010.0446
5793PTPRGHTA11_9408_2000001011HumanColorectumAD2.69e-04-5.67e-010.0451
5793PTPRGHTA11_99999970781_79442HumanColorectumMSS3.09e-065.68e-010.294
5793PTPRGHTA11_99999965062_69753HumanColorectumMSI-H4.84e-271.41e+000.3487
5793PTPRGHTA11_99999965104_69814HumanColorectumMSS3.64e-231.42e+000.281
5793PTPRGA002-C-010HumanColorectumFAP1.18e-101.94e-010.242
5793PTPRGA001-C-207HumanColorectumFAP7.38e-036.20e-020.1278
5793PTPRGA015-C-203HumanColorectumFAP6.28e-38-5.88e-01-0.1294
5793PTPRGA015-C-204HumanColorectumFAP4.24e-05-2.66e-01-0.0228
5793PTPRGA014-C-040HumanColorectumFAP6.84e-03-3.22e-01-0.1184
5793PTPRGA002-C-201HumanColorectumFAP5.35e-13-2.67e-010.0324
5793PTPRGA001-C-119HumanColorectumFAP1.65e-13-6.36e-01-0.1557
5793PTPRGA001-C-108HumanColorectumFAP1.81e-19-4.67e-01-0.0272
5793PTPRGA002-C-205HumanColorectumFAP6.31e-30-6.61e-01-0.1236
5793PTPRGA001-C-104HumanColorectumFAP2.54e-02-2.10e-010.0184
Page: 1 2 3 4 5 6 7 

check button Transcriptomic changes along malignancy continuum.
TissueExpression DynamicsAbbreviation
CervixThe image shows the transcriptomic changes along malignancy continuum.log2FC in expression of this searched gene in stem-like cells from each diseased tissue sample relative to stem-like cells in normal samples in each tissue plotted against the malignancy continuum. Samples are colored based on if they are from different disease stage.CC: Cervix cancer
HSIL_HPV: HPV-infected high-grade squamous intraepithelial lesions
N_HPV: HPV-infected normal cervix
Colorectum (GSE201348)The image shows the transcriptomic changes along malignancy continuum.log2FC in expression of this searched gene in stem-like cells from each diseased tissue sample relative to stem-like cells in normal samples in each tissue plotted against the malignancy continuum. Samples are colored based on if they are from different disease stage.
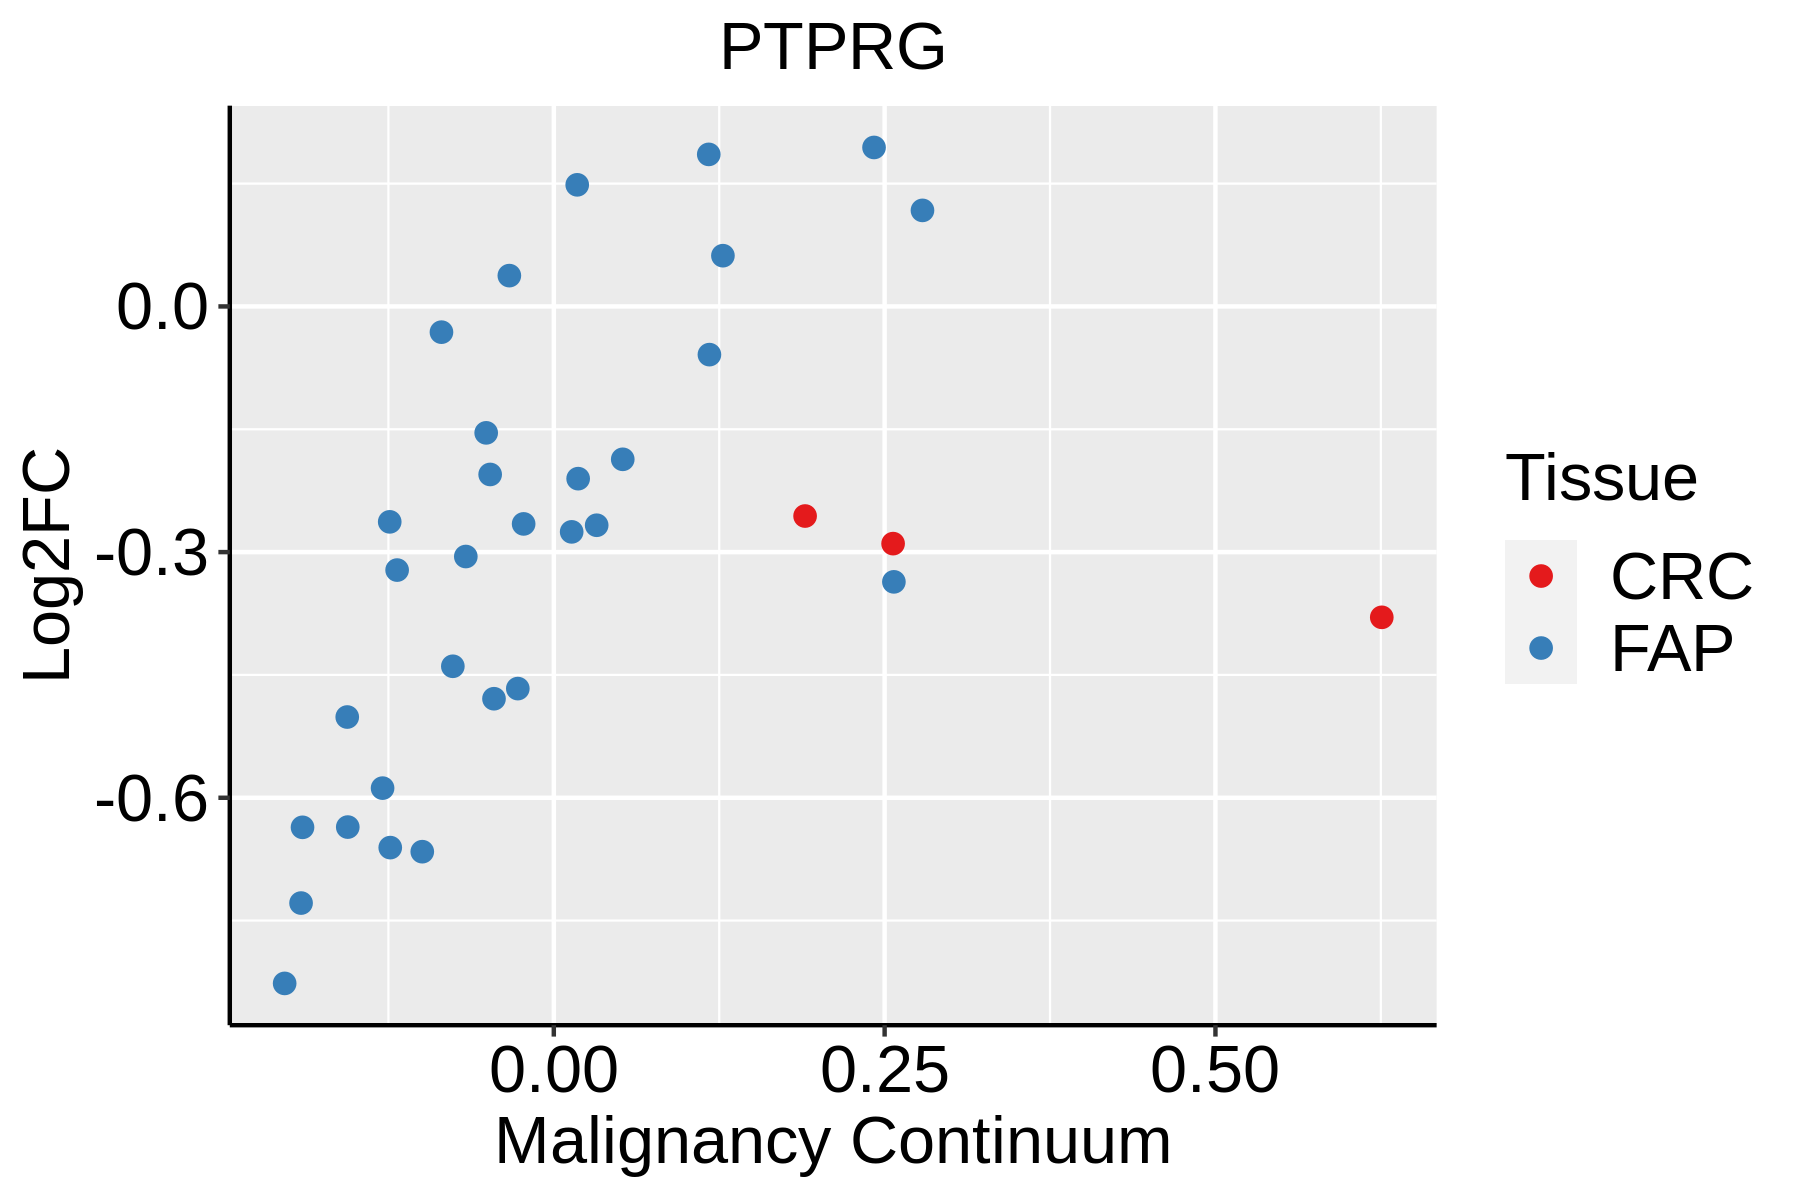
FAP: Familial adenomatous polyposis
CRC: Colorectal cancer
Colorectum (HTA11)The image shows the transcriptomic changes along malignancy continuum.log2FC in expression of this searched gene in stem-like cells from each diseased tissue sample relative to stem-like cells in normal samples in each tissue plotted against the malignancy continuum. Samples are colored based on if they are from different disease stage.AD: Adenomas
SER: Sessile serrated lesions
MSI-H: Microsatellite-high colorectal cancer
MSS: Microsatellite stable colorectal cancer
EndometriumThe image shows the transcriptomic changes along malignancy continuum.log2FC in expression of this searched gene in stem-like cells from each diseased tissue sample relative to stem-like cells in normal samples in each tissue plotted against the malignancy continuum. Samples are colored based on if they are from different disease stage.
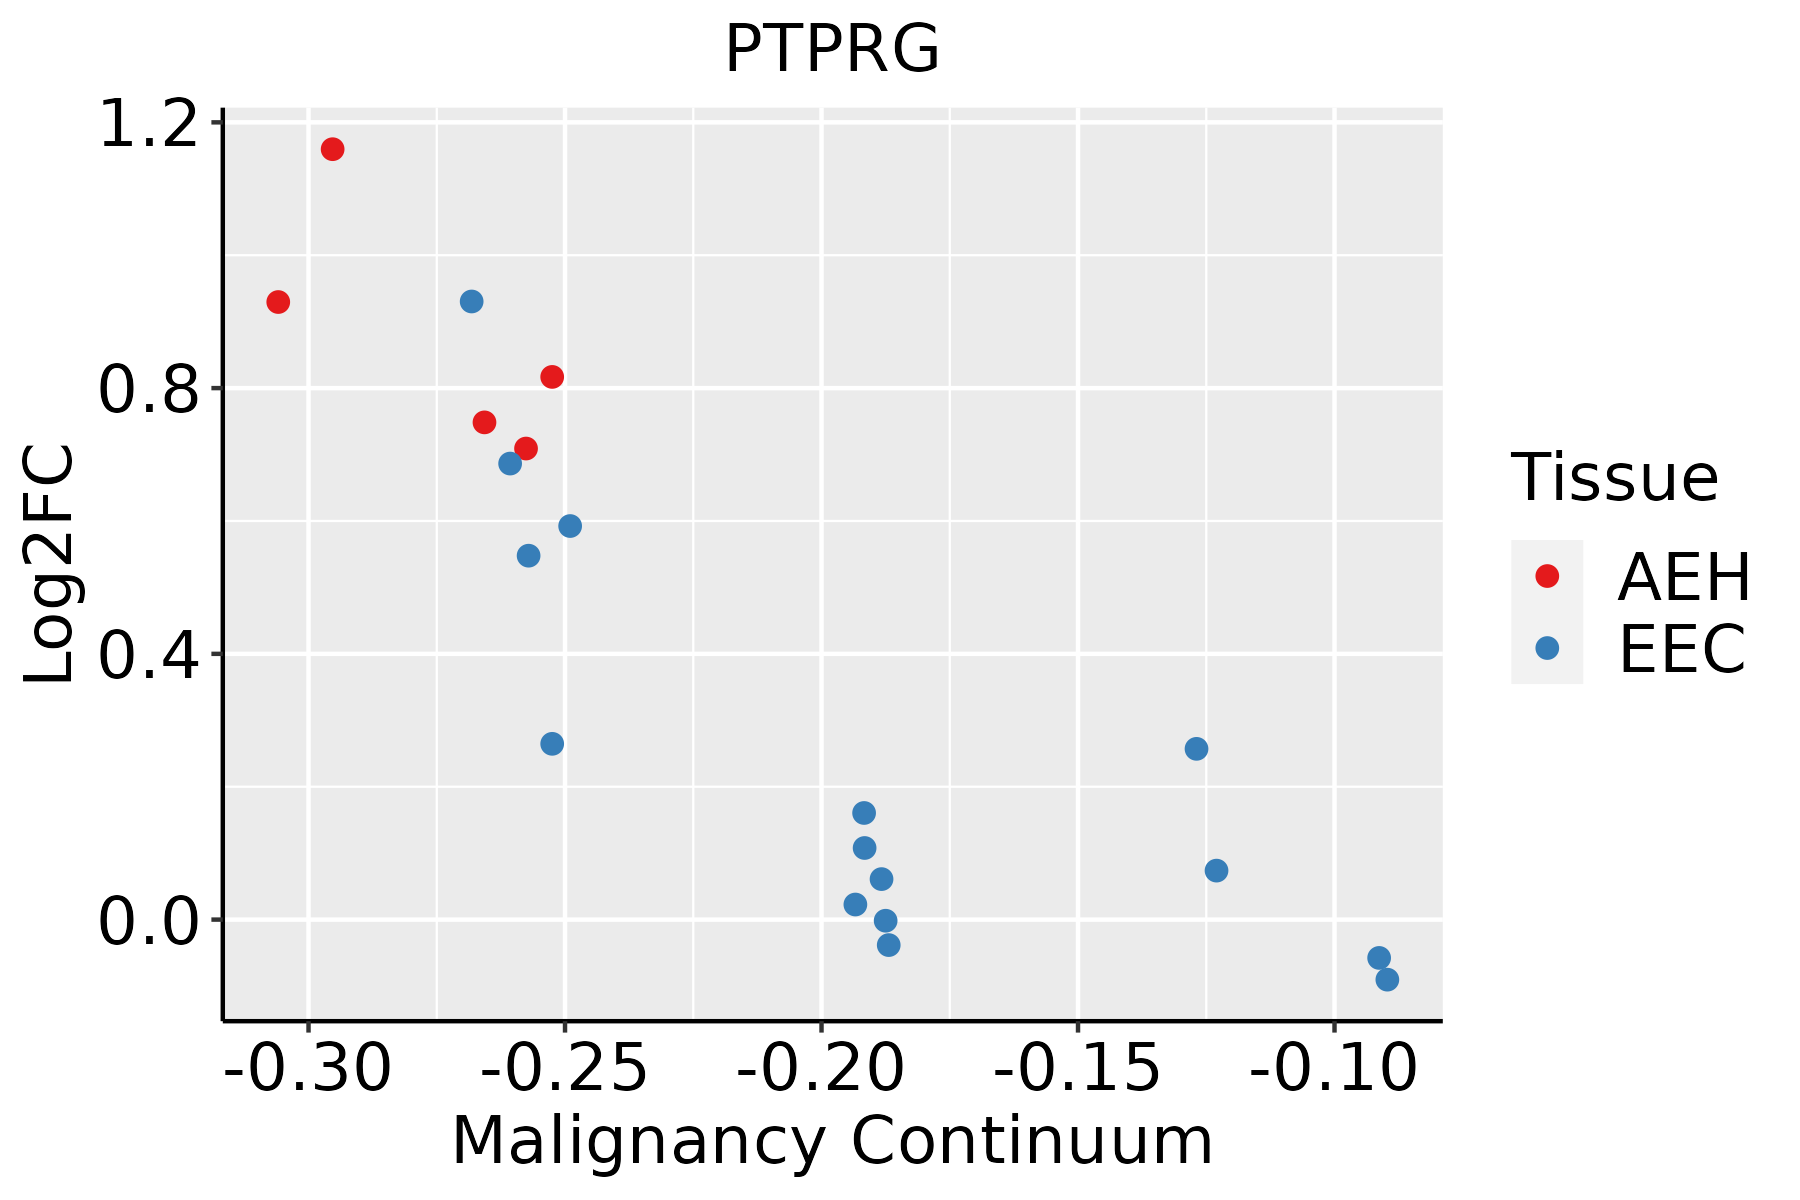
AEH: Atypical endometrial hyperplasia
EEC: Endometrioid Cancer
LiverThe image shows the transcriptomic changes along malignancy continuum.log2FC in expression of this searched gene in stem-like cells from each diseased tissue sample relative to stem-like cells in normal samples in each tissue plotted against the malignancy continuum. Samples are colored based on if they are from different disease stage.
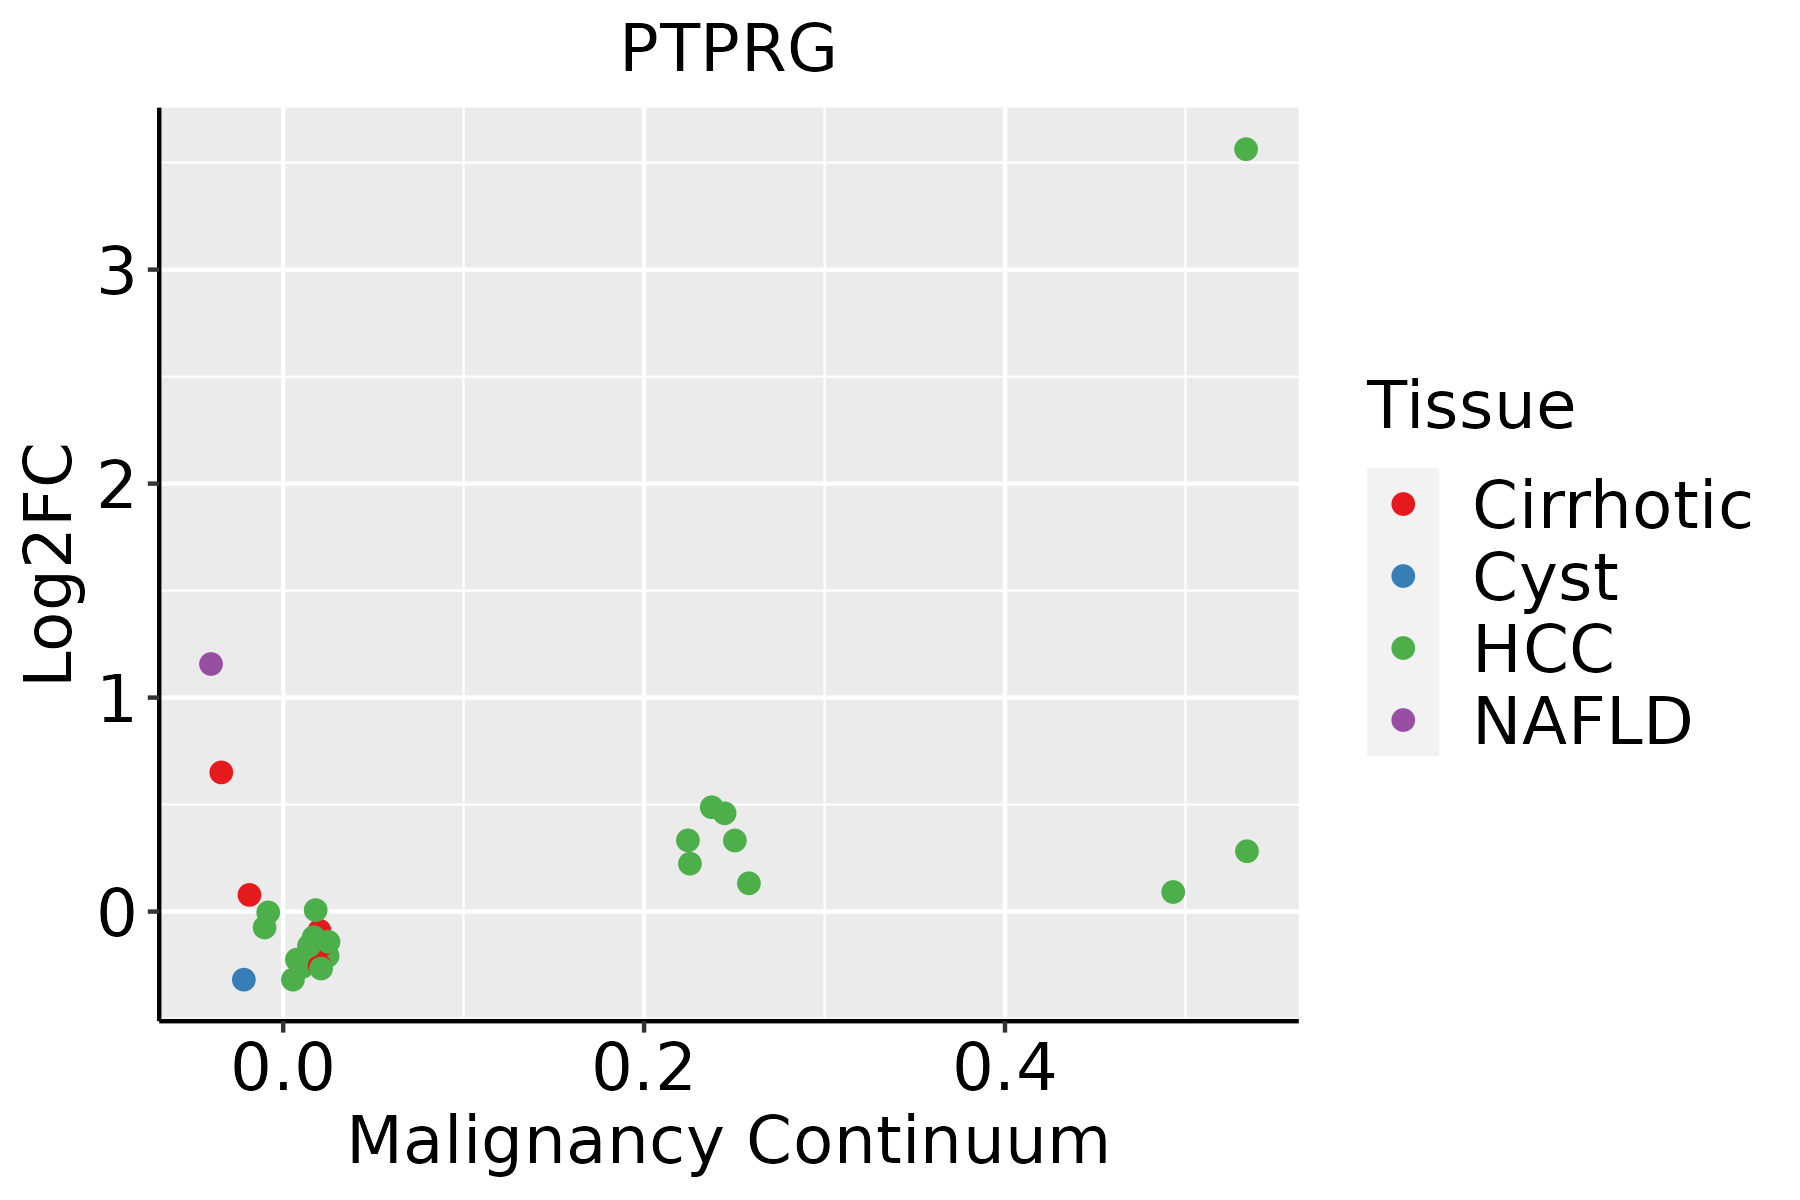
HCC: Hepatocellular carcinoma
NAFLD: Non-alcoholic fatty liver disease
LungThe image shows the transcriptomic changes along malignancy continuum.log2FC in expression of this searched gene in stem-like cells from each diseased tissue sample relative to stem-like cells in normal samples in each tissue plotted against the malignancy continuum. Samples are colored based on if they are from different disease stage.AAH: Atypical adenomatous hyperplasia
AIS: Adenocarcinoma in situ
IAC: Invasive lung adenocarcinoma
MIA: Minimally invasive adenocarcinoma
Oral CavityThe image shows the transcriptomic changes along malignancy continuum.log2FC in expression of this searched gene in stem-like cells from each diseased tissue sample relative to stem-like cells in normal samples in each tissue plotted against the malignancy continuum. Samples are colored based on if they are from different disease stage.
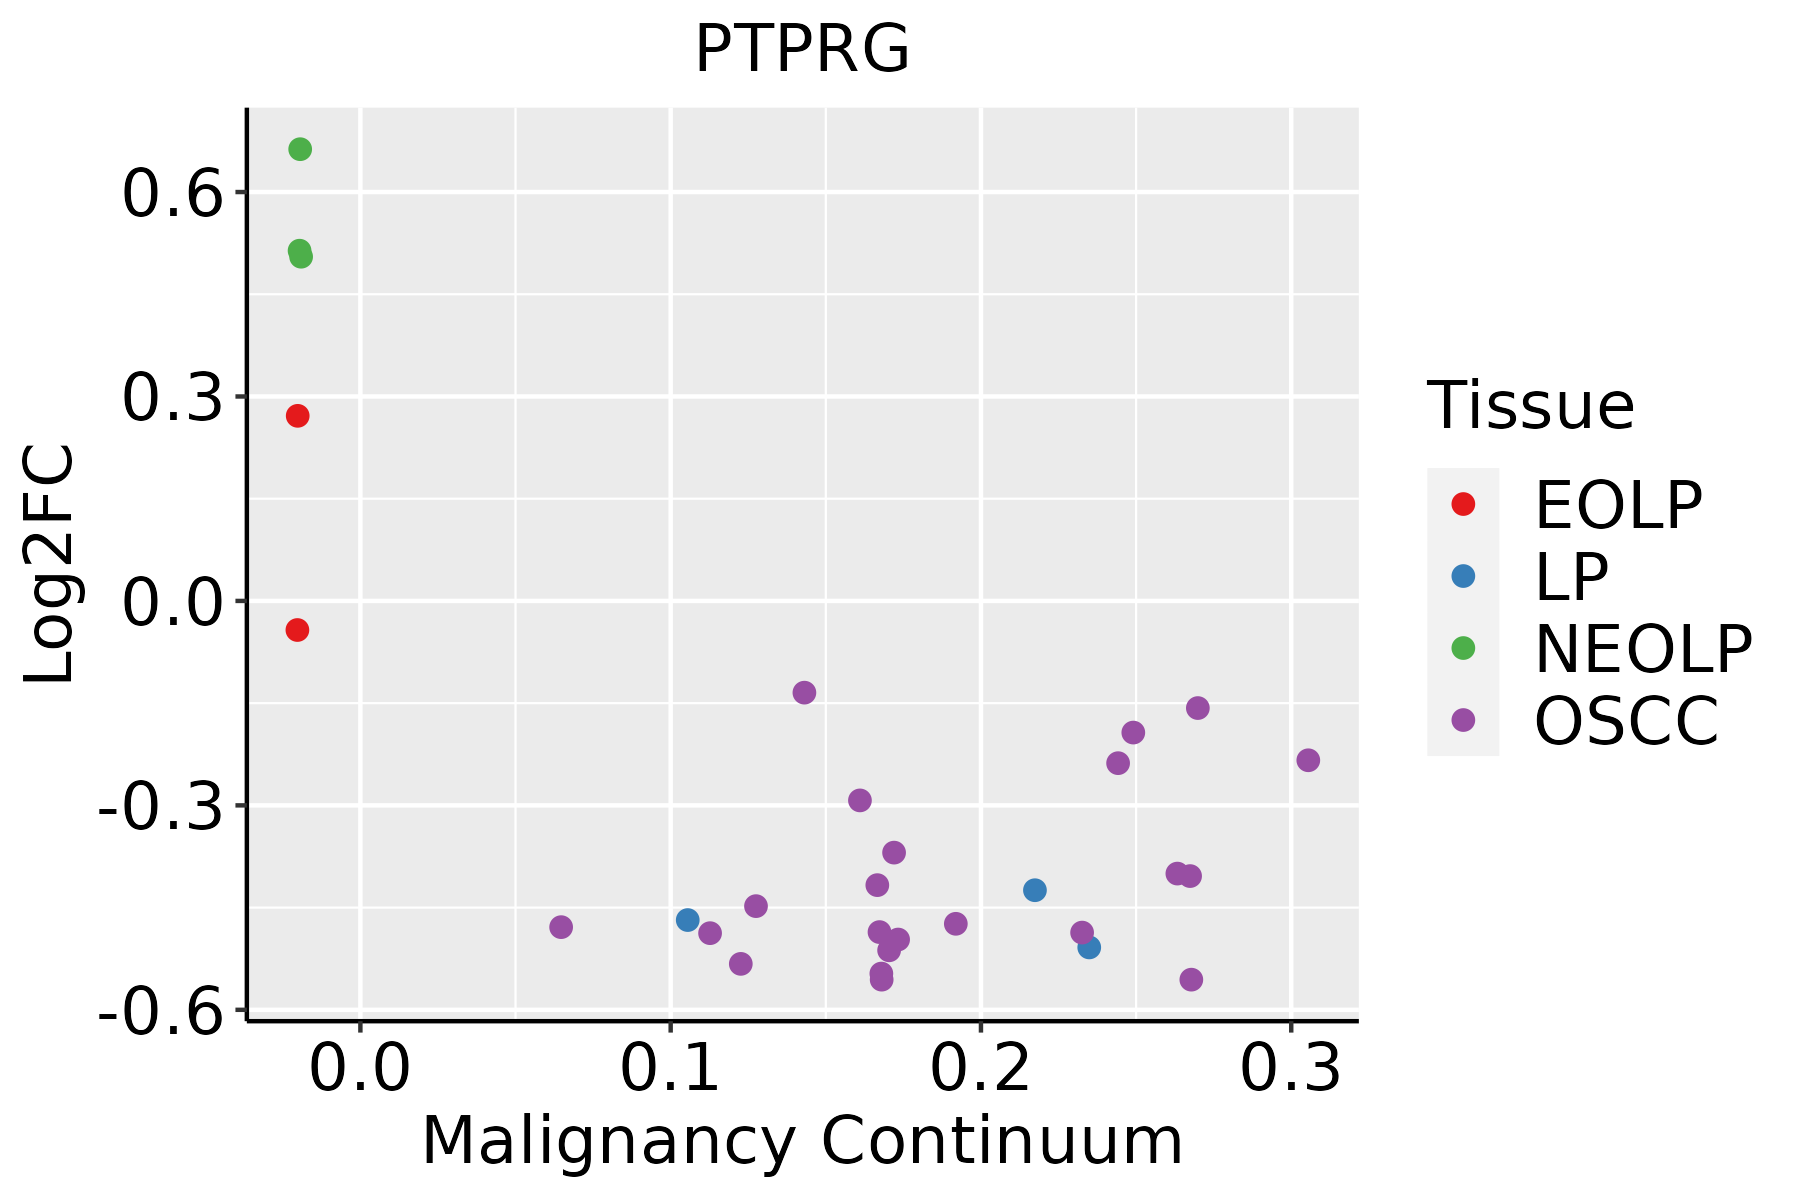
EOLP: Erosive Oral lichen planus
LP: leukoplakia
NEOLP: Non-erosive oral lichen planus
OSCC: Oral squamous cell carcinoma
ProstateThe image shows the transcriptomic changes along malignancy continuum.log2FC in expression of this searched gene in stem-like cells from each diseased tissue sample relative to stem-like cells in normal samples in each tissue plotted against the malignancy continuum. Samples are colored based on if they are from different disease stage.BPH: Benign Prostatic Hyperplasia
ThyroidThe image shows the transcriptomic changes along malignancy continuum.log2FC in expression of this searched gene in stem-like cells from each diseased tissue sample relative to stem-like cells in normal samples in each tissue plotted against the malignancy continuum. Samples are colored based on if they are from different disease stage.ATC: Anaplastic thyroid cancer
HT: Hashimoto's thyroiditis
PTC: Papillary thyroid cancer
∗log2FC in expression of this searched gene in stem-like cells from each diseased tissue sample relative to stem-like cells in normal samples in each tissue plotted against the malignancy continuum. Samples are colored based on if they are from different disease stage.

Top

Malignant transformation related pathway analysis

check buttonFind out the enriched GO biological processes and KEGG pathways involved in transition from healthy to precancer to cancer
check button Figure of enriched GO biological processes.
TissueDisease StageEnriched GO biological Processes
ColorectumADGO analysis - Figure of enriched GO biological processes: Top 15 enriched GO BP terms are showed in the bar plot of each disease state in each tissue. Each row represents a significant GO biological process which is colored according to the -log10(p.adjust).
ColorectumSERGO analysis - Figure of enriched GO biological processes: Top 15 enriched GO BP terms are showed in the bar plot of each disease state in each tissue. Each row represents a significant GO biological process which is colored according to the -log10(p.adjust).
ColorectumMSSGO analysis - Figure of enriched GO biological processes: Top 15 enriched GO BP terms are showed in the bar plot of each disease state in each tissue. Each row represents a significant GO biological process which is colored according to the -log10(p.adjust).
ColorectumMSI-HGO analysis - Figure of enriched GO biological processes: Top 15 enriched GO BP terms are showed in the bar plot of each disease state in each tissue. Each row represents a significant GO biological process which is colored according to the -log10(p.adjust).
ColorectumFAPGO analysis - Figure of enriched GO biological processes: Top 15 enriched GO BP terms are showed in the bar plot of each disease state in each tissue. Each row represents a significant GO biological process which is colored according to the -log10(p.adjust).
∗Top 15 enriched GO BP terms are showed in the bar plot of each disease state in each tissue. Each row represents a significant GO biological process which is colored according to the -log10(p.adjust).
Page: 1 2 3 4 5 6 7 8 9 

check button Enriched GO biological processes.
GO IDTissueDisease StageDescriptionGene RatioBg Ratiopvaluep.adjustCount
GO:009013210CervixCCepithelium migration90/2311360/187232.45e-116.11e-0990
GO:00016679CervixCCameboidal-type cell migration110/2311475/187232.66e-116.36e-09110
GO:001063110CervixCCepithelial cell migration89/2311357/187233.72e-118.54e-0989
GO:009013010CervixCCtissue migration90/2311365/187235.42e-111.05e-0890
GO:001063210CervixCCregulation of epithelial cell migration72/2311292/187234.52e-094.43e-0772
GO:00109757CervixCCregulation of neuron projection development88/2311445/187234.26e-061.09e-0488
GO:00064708CervixCCprotein dephosphorylation60/2311281/187231.33e-052.68e-0460
GO:00512713CervixCCnegative regulation of cellular component movement73/2311367/187232.22e-053.95e-0473
GO:00400133CervixCCnegative regulation of locomotion76/2311391/187233.47e-055.60e-0476
GO:20001463CervixCCnegative regulation of cell motility71/2311359/187233.47e-055.60e-0471
GO:00303363CervixCCnegative regulation of cell migration68/2311344/187235.11e-057.70e-0468
GO:00313456CervixCCnegative regulation of cell projection organization39/2311186/187235.86e-045.57e-0339
GO:00163117CervixCCdephosphorylation73/2311417/187231.23e-039.87e-0373
GO:00109775CervixCCnegative regulation of neuron projection development28/2311137/187234.74e-032.83e-0228
GO:0016311ColorectumADdephosphorylation123/3918417/187231.84e-053.82e-04123
GO:0001667ColorectumADameboidal-type cell migration137/3918475/187232.17e-054.33e-04137
GO:0006470ColorectumADprotein dephosphorylation88/3918281/187232.56e-054.89e-0488
GO:0010975ColorectumADregulation of neuron projection development129/3918445/187232.88e-055.37e-04129
GO:0090132ColorectumADepithelium migration105/3918360/187231.18e-041.73e-03105
GO:0010632ColorectumADregulation of epithelial cell migration88/3918292/187231.19e-041.75e-0388
Page: 1 2 3 4 5 6 7 8 9 10 

check button Enriched KEGG pathways.
Pathway IDTissueDisease StageDescriptionGene RatioBg Ratiopvaluep.adjustqvalueCount
Page: 1 

Top

Cell-cell communication analysis

check buttonIdentification of potential cell-cell interactions between two cell types and their ligand-receptor pairs for different disease states
LigandReceptorLRpairPathwayTissueDisease Stage
Page: 1 

Top

Single-cell gene regulatory network inference analysis

check buttonFind out the significant the regulons (TFs) and the target genes of each regulon across cell types for different disease states
TFCell TypeTissueDisease StageTarget GeneRSSRegulon Activity
∗The dot plots of a searched regulon are shown for all cell subpopulations in each disease state of each tissue based on the regulon specific score inferred using pySCENIC and by calculating the average expression.
Page: 1 

Top

Somatic mutation of malignant transformation related genes

check buttonAnnotation of somatic variants for genes involved in malignant transformation
Hugo SymbolVariant ClassVariant ClassificationdbSNP RSHGVScHGVSpHGVSp ShortSWISSPROTBIOTYPESIFTPolyPhenTumor Sample BarcodeTissueHistologySexAgeStageTherapy TypesDrugsOutcome
PTPRGSNVMissense_Mutationc.253C>Gp.Pro85Alap.P85AP23470protein_codingdeleterious(0)probably_damaging(0.998)TCGA-A2-A0YH-01Breastbreast invasive carcinomaFemale<65III/IVChemotherapyadriamycinSD
PTPRGSNVMissense_Mutationrs768919412c.3137N>Tp.Ser1046Leup.S1046LP23470protein_codingdeleterious(0)probably_damaging(0.947)TCGA-AN-A0XW-01Breastbreast invasive carcinomaFemale<65III/IVUnknownUnknownSD
PTPRGSNVMissense_Mutationnovelc.1472N>Tp.Ser491Phep.S491FP23470protein_codingdeleterious(0)probably_damaging(0.996)TCGA-AO-A03L-01Breastbreast invasive carcinomaFemale<65III/IVChemotherapycyclophosphamideSD
PTPRGSNVMissense_Mutationc.391N>Cp.Asp131Hisp.D131HP23470protein_codingdeleterious(0)probably_damaging(0.941)TCGA-AR-A0TV-01Breastbreast invasive carcinomaFemale>=65I/IIUnknownUnknownSD
PTPRGSNVMissense_Mutationc.3364N>Ap.Gly1122Argp.G1122RP23470protein_codingdeleterious(0.05)benign(0.019)TCGA-B6-A0I8-01Breastbreast invasive carcinomaFemale<65I/IIUnknownUnknownPD
PTPRGSNVMissense_Mutationc.3943N>Gp.Gln1315Glup.Q1315EP23470protein_codingdeleterious(0.02)benign(0.098)TCGA-D8-A1JA-01Breastbreast invasive carcinomaFemale<65III/IVChemotherapyadriamycinPD
PTPRGSNVMissense_Mutationc.2241N>Cp.Leu747Phep.L747FP23470protein_codingdeleterious(0)probably_damaging(0.986)TCGA-E9-A22E-01Breastbreast invasive carcinomaFemale<65III/IVChemotherapycyclophosphaneSD
PTPRGSNVMissense_Mutationnovelc.47T>Gp.Ile16Serp.I16SP23470protein_codingdeleterious_low_confidence(0)possibly_damaging(0.84)TCGA-EW-A6SA-01Breastbreast invasive carcinomaMale<65I/IIUnknownUnknownSD
PTPRGSNVMissense_Mutationnovelc.522N>Tp.Met174Ilep.M174IP23470protein_codingdeleterious(0.01)benign(0.027)TCGA-OL-A66N-01Breastbreast invasive carcinomaFemale<65III/IVUnknownUnknownSD
PTPRGSNVMissense_Mutationnovelc.663N>Cp.Leu221Phep.L221FP23470protein_codingdeleterious(0)probably_damaging(0.939)TCGA-PE-A5DE-01Breastbreast invasive carcinomaFemale<65I/IIChemotherapytaxotereCR
Page: 1 2 3 4 5 6 7 8 9 10 11 12 13 14 15 16 17 18 

Top

Related drugs of malignant transformation related genes

check buttonIdentification of chemicals and drugs interact with genes involved in malignant transfromation
(DGIdb 4.0)
Entrez IDSymbolCategoryInteraction TypesDrug Claim NameDrug NamePMIDs
5793PTPRGPROTEIN PHOSPHATASE, DRUGGABLE GENOMEinhibitor252827488
Page: 1