
|
|||||
|
 | |
| |
| |
| |
| |
| |
|
Gene: PTPRF |
Gene summary for PTPRF |
| Gene information | Species | Human | Gene symbol | PTPRF | Gene ID | 5792 |
| Gene name | protein tyrosine phosphatase receptor type F | |
| Gene Alias | BNAH2 | |
| Cytomap | 1p34.2 | |
| Gene Type | protein-coding | GO ID | GO:0006464 | UniProtAcc | G1UI20 |
Top |
Malignant transformation analysis |
| Identification of the aberrant gene expression in precancerous and cancerous lesions by comparing the gene expression of stem-like cells in diseased tissues with normal stem cells |
| Entrez ID | Symbol | Replicates | Species | Organ | Tissue | Adj P-value | Log2FC | Malignancy |
| 5792 | PTPRF | GSM4909280 | Human | Breast | Precancer | 1.25e-02 | -3.81e-01 | 0.0305 |
| 5792 | PTPRF | GSM4909281 | Human | Breast | IDC | 1.06e-27 | 6.70e-01 | 0.21 |
| 5792 | PTPRF | GSM4909285 | Human | Breast | IDC | 1.04e-17 | 5.20e-01 | 0.21 |
| 5792 | PTPRF | GSM4909286 | Human | Breast | IDC | 7.78e-25 | 5.34e-01 | 0.1081 |
| 5792 | PTPRF | GSM4909292 | Human | Breast | IDC | 4.79e-04 | 7.03e-01 | 0.1236 |
| 5792 | PTPRF | GSM4909293 | Human | Breast | IDC | 2.02e-03 | 2.51e-01 | 0.1581 |
| 5792 | PTPRF | GSM4909296 | Human | Breast | IDC | 1.30e-06 | 1.26e-01 | 0.1524 |
| 5792 | PTPRF | GSM4909297 | Human | Breast | IDC | 7.94e-06 | -1.34e-01 | 0.1517 |
| 5792 | PTPRF | GSM4909298 | Human | Breast | IDC | 8.73e-09 | 4.12e-01 | 0.1551 |
| 5792 | PTPRF | GSM4909307 | Human | Breast | IDC | 1.56e-02 | 3.17e-01 | 0.1569 |
| 5792 | PTPRF | GSM4909311 | Human | Breast | IDC | 3.87e-25 | 1.36e-01 | 0.1534 |
| 5792 | PTPRF | GSM4909312 | Human | Breast | IDC | 1.40e-04 | 9.65e-02 | 0.1552 |
| 5792 | PTPRF | GSM4909319 | Human | Breast | IDC | 9.55e-29 | -2.22e-01 | 0.1563 |
| 5792 | PTPRF | GSM4909320 | Human | Breast | IDC | 5.03e-04 | -1.97e-01 | 0.1575 |
| 5792 | PTPRF | GSM4909321 | Human | Breast | IDC | 8.48e-07 | -1.79e-01 | 0.1559 |
| 5792 | PTPRF | NCCBC14 | Human | Breast | DCIS | 2.92e-13 | 1.19e-01 | 0.2021 |
| 5792 | PTPRF | NCCBC2 | Human | Breast | DCIS | 3.01e-03 | 4.39e-01 | 0.1554 |
| 5792 | PTPRF | NCCBC5 | Human | Breast | DCIS | 4.69e-09 | 1.81e-03 | 0.2046 |
| 5792 | PTPRF | P1 | Human | Breast | IDC | 4.90e-12 | -4.59e-02 | 0.1527 |
| 5792 | PTPRF | DCIS2 | Human | Breast | DCIS | 4.21e-53 | 3.53e-01 | 0.0085 |
| Page: 1 2 3 4 5 6 7 8 9 10 11 12 13 14 |
| Tissue | Expression Dynamics | Abbreviation |
| Breast |  | IDC: Invasive ductal carcinoma |
| DCIS: Ductal carcinoma in situ | ||
| Precancer(BRCA1-mut): Precancerous lesion from BRCA1 mutation carriers | ||
| Cervix | 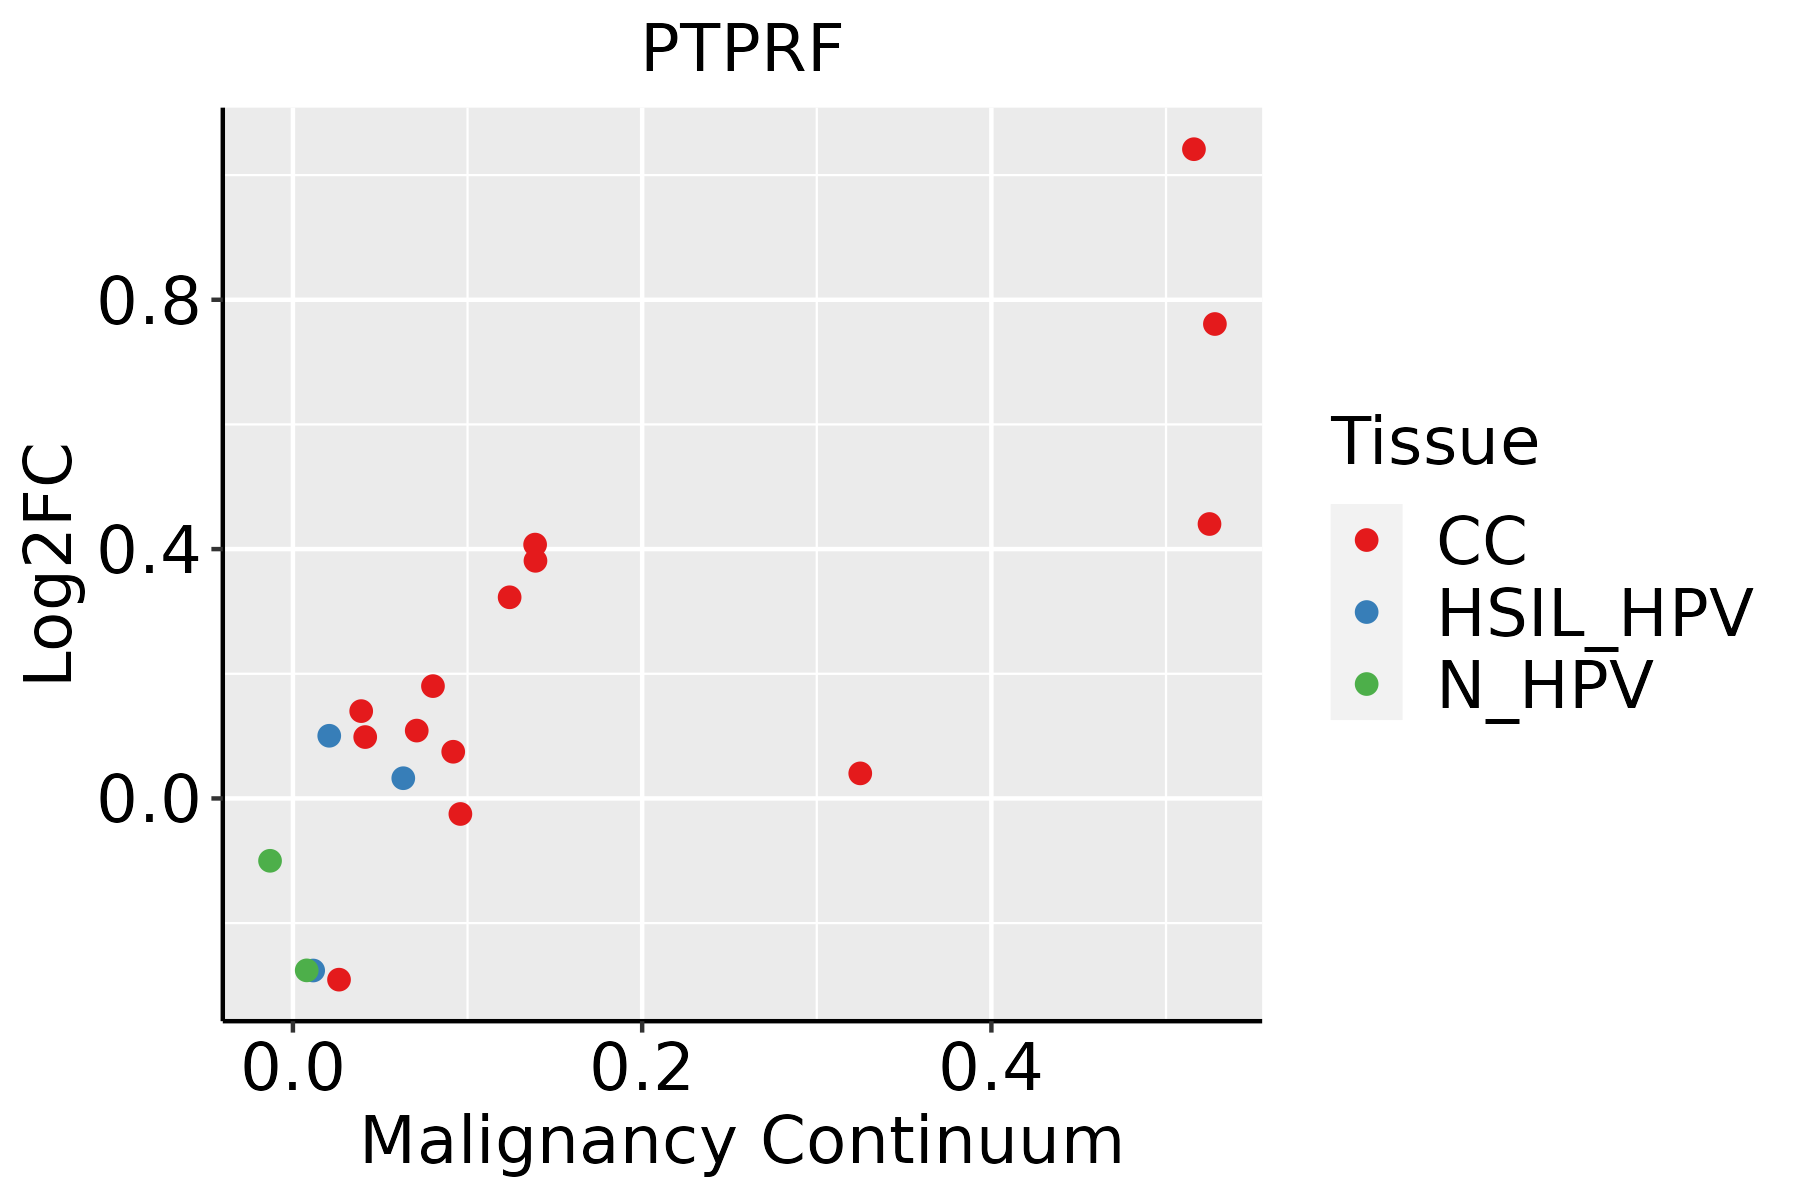 | CC: Cervix cancer |
| HSIL_HPV: HPV-infected high-grade squamous intraepithelial lesions | ||
| N_HPV: HPV-infected normal cervix | ||
| Colorectum (GSE201348) |  | FAP: Familial adenomatous polyposis |
| CRC: Colorectal cancer | ||
| Colorectum (HTA11) |  | AD: Adenomas |
| SER: Sessile serrated lesions | ||
| MSI-H: Microsatellite-high colorectal cancer | ||
| MSS: Microsatellite stable colorectal cancer | ||
| Endometrium | 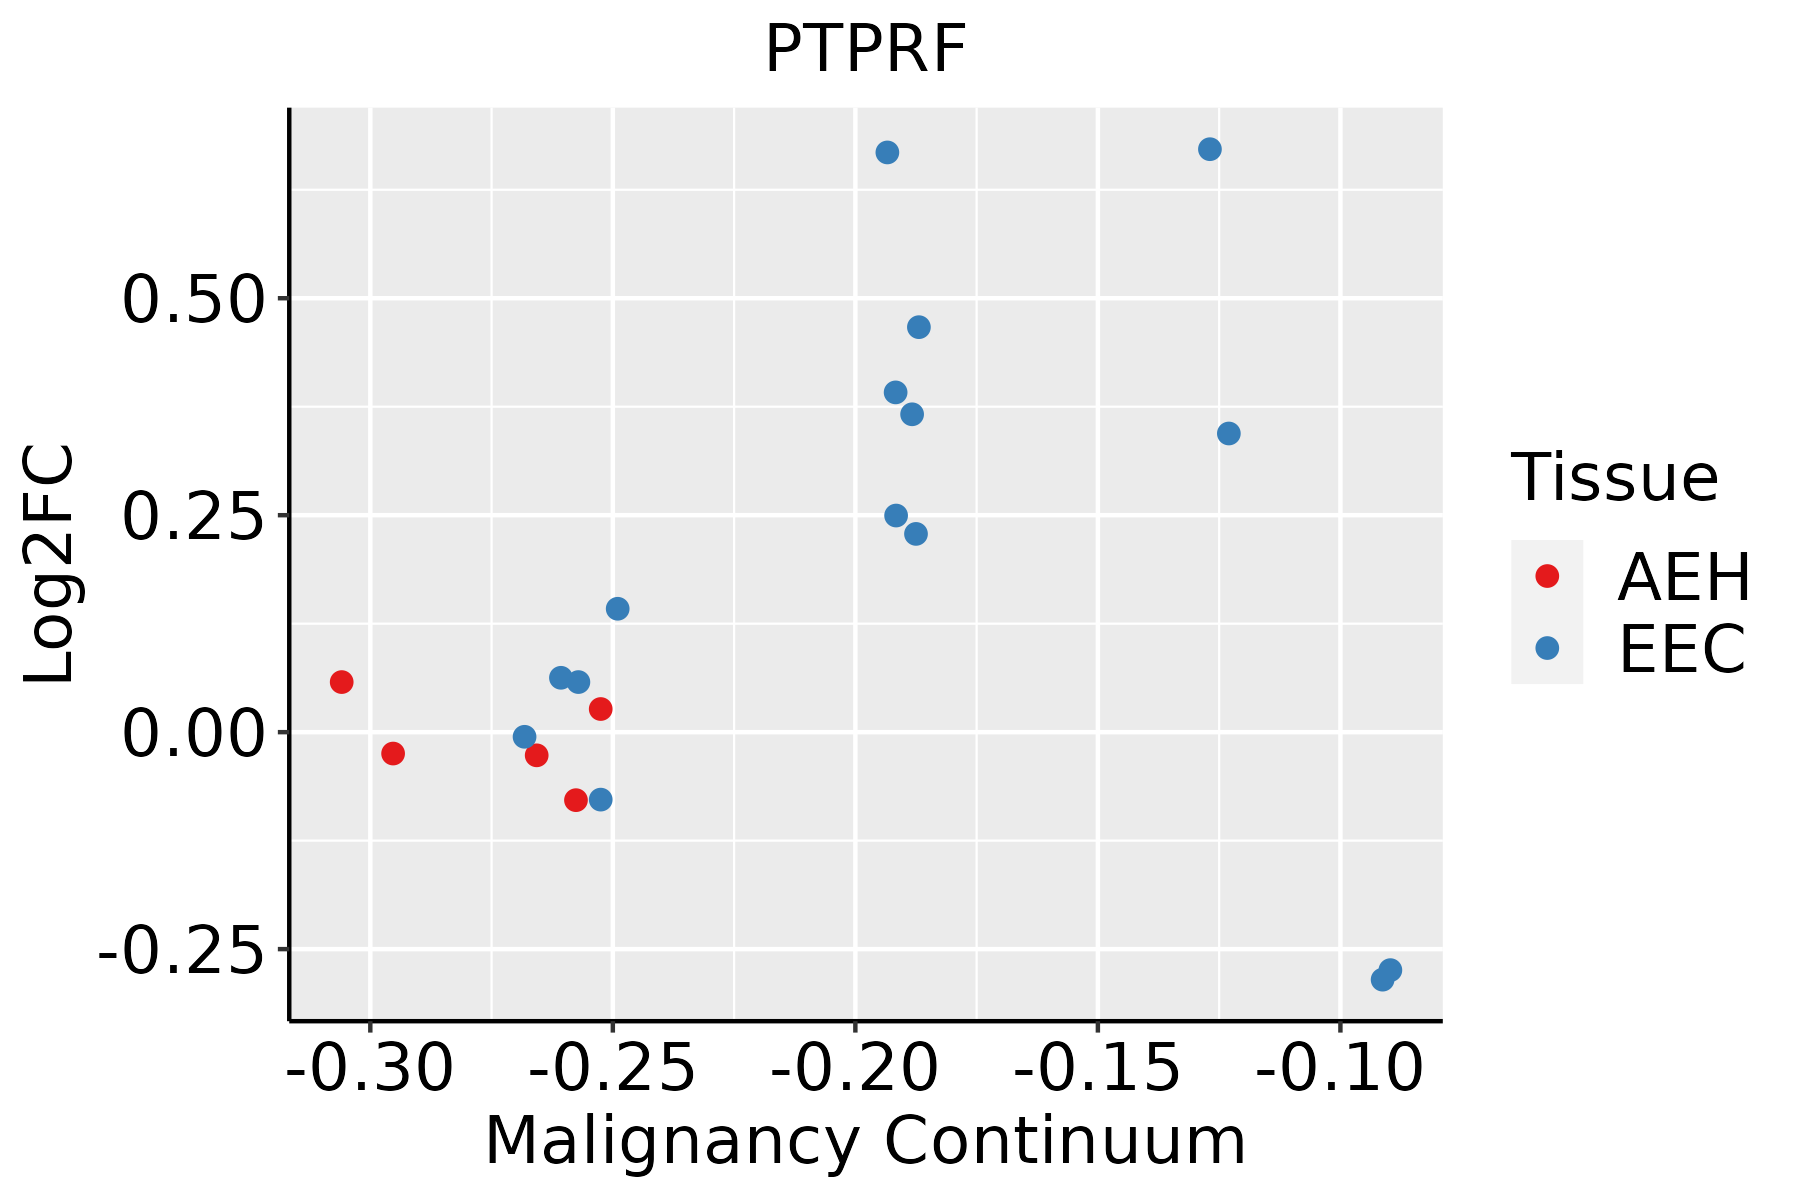 | AEH: Atypical endometrial hyperplasia |
| EEC: Endometrioid Cancer | ||
| Esophagus | 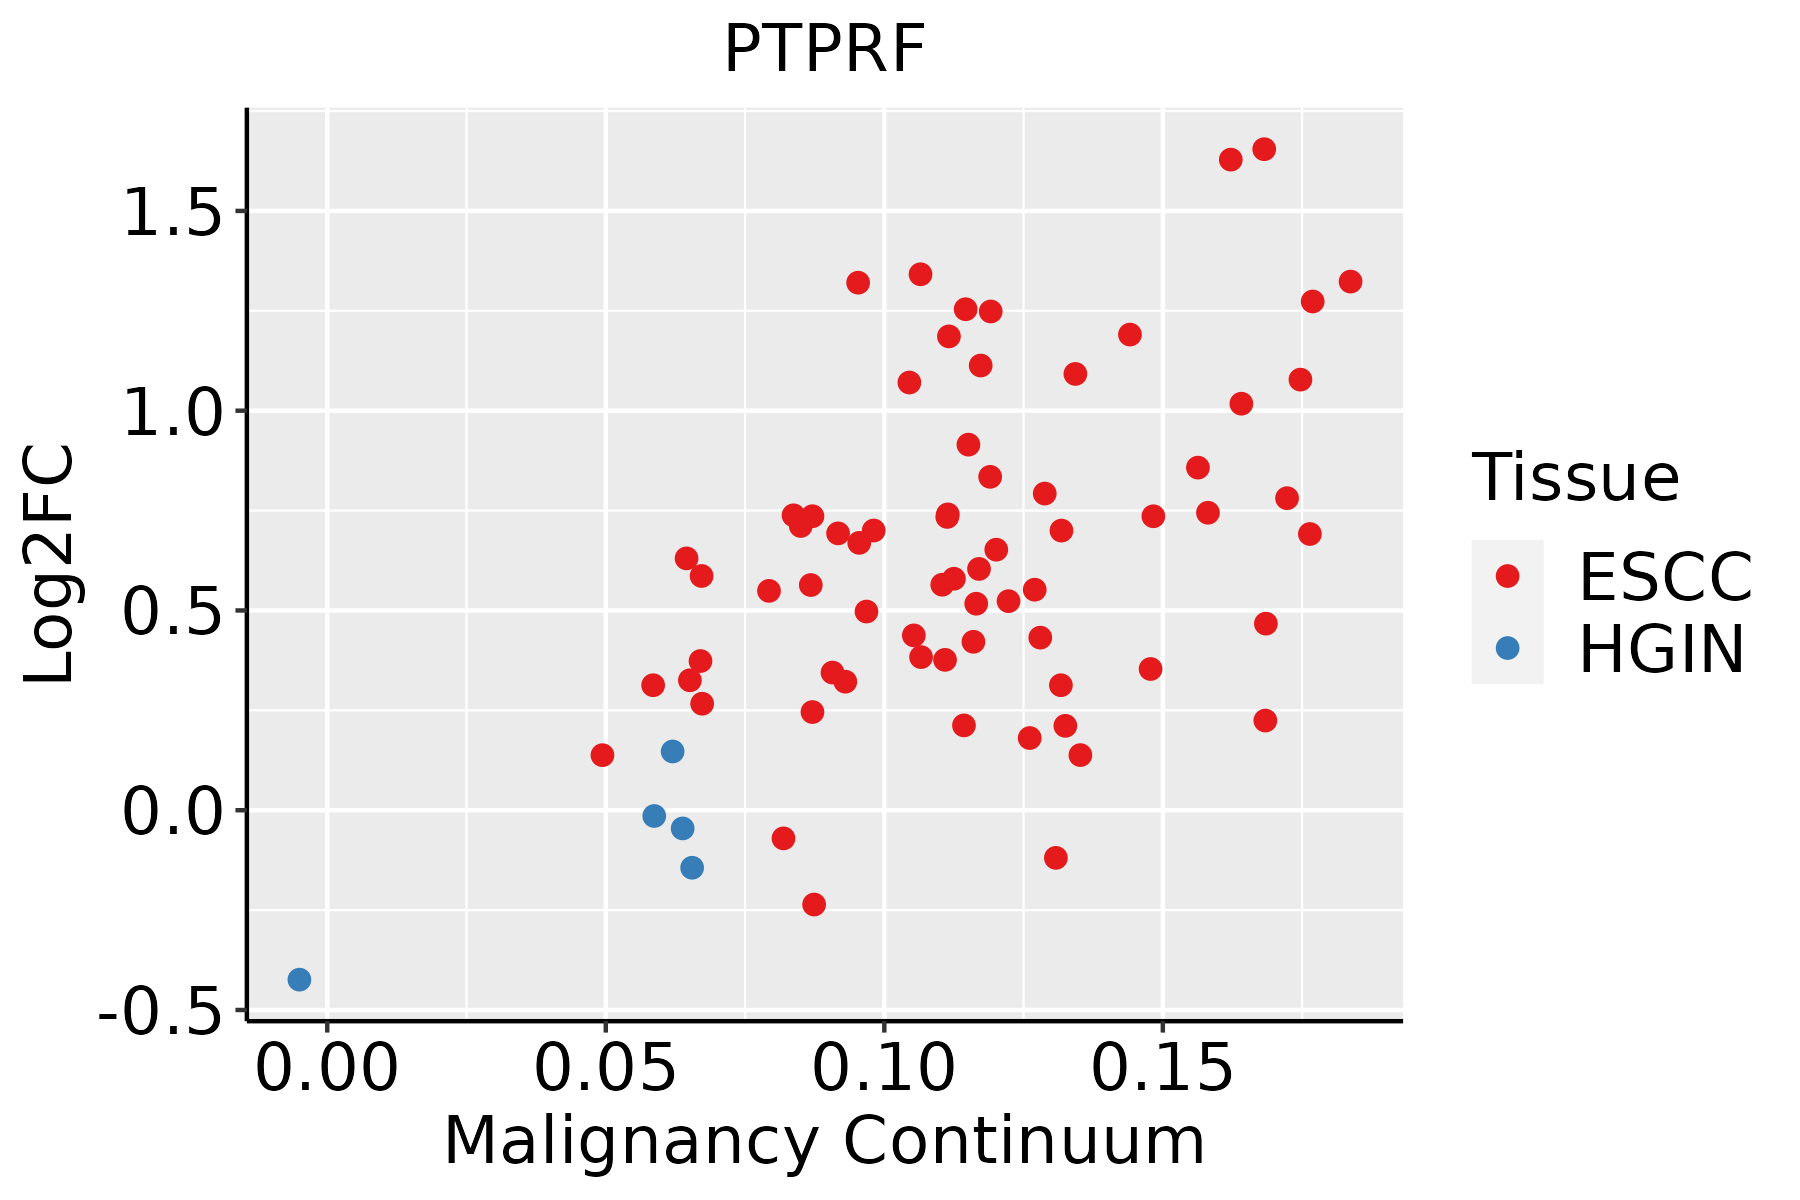 | ESCC: Esophageal squamous cell carcinoma |
| HGIN: High-grade intraepithelial neoplasias | ||
| LGIN: Low-grade intraepithelial neoplasias | ||
| GC | 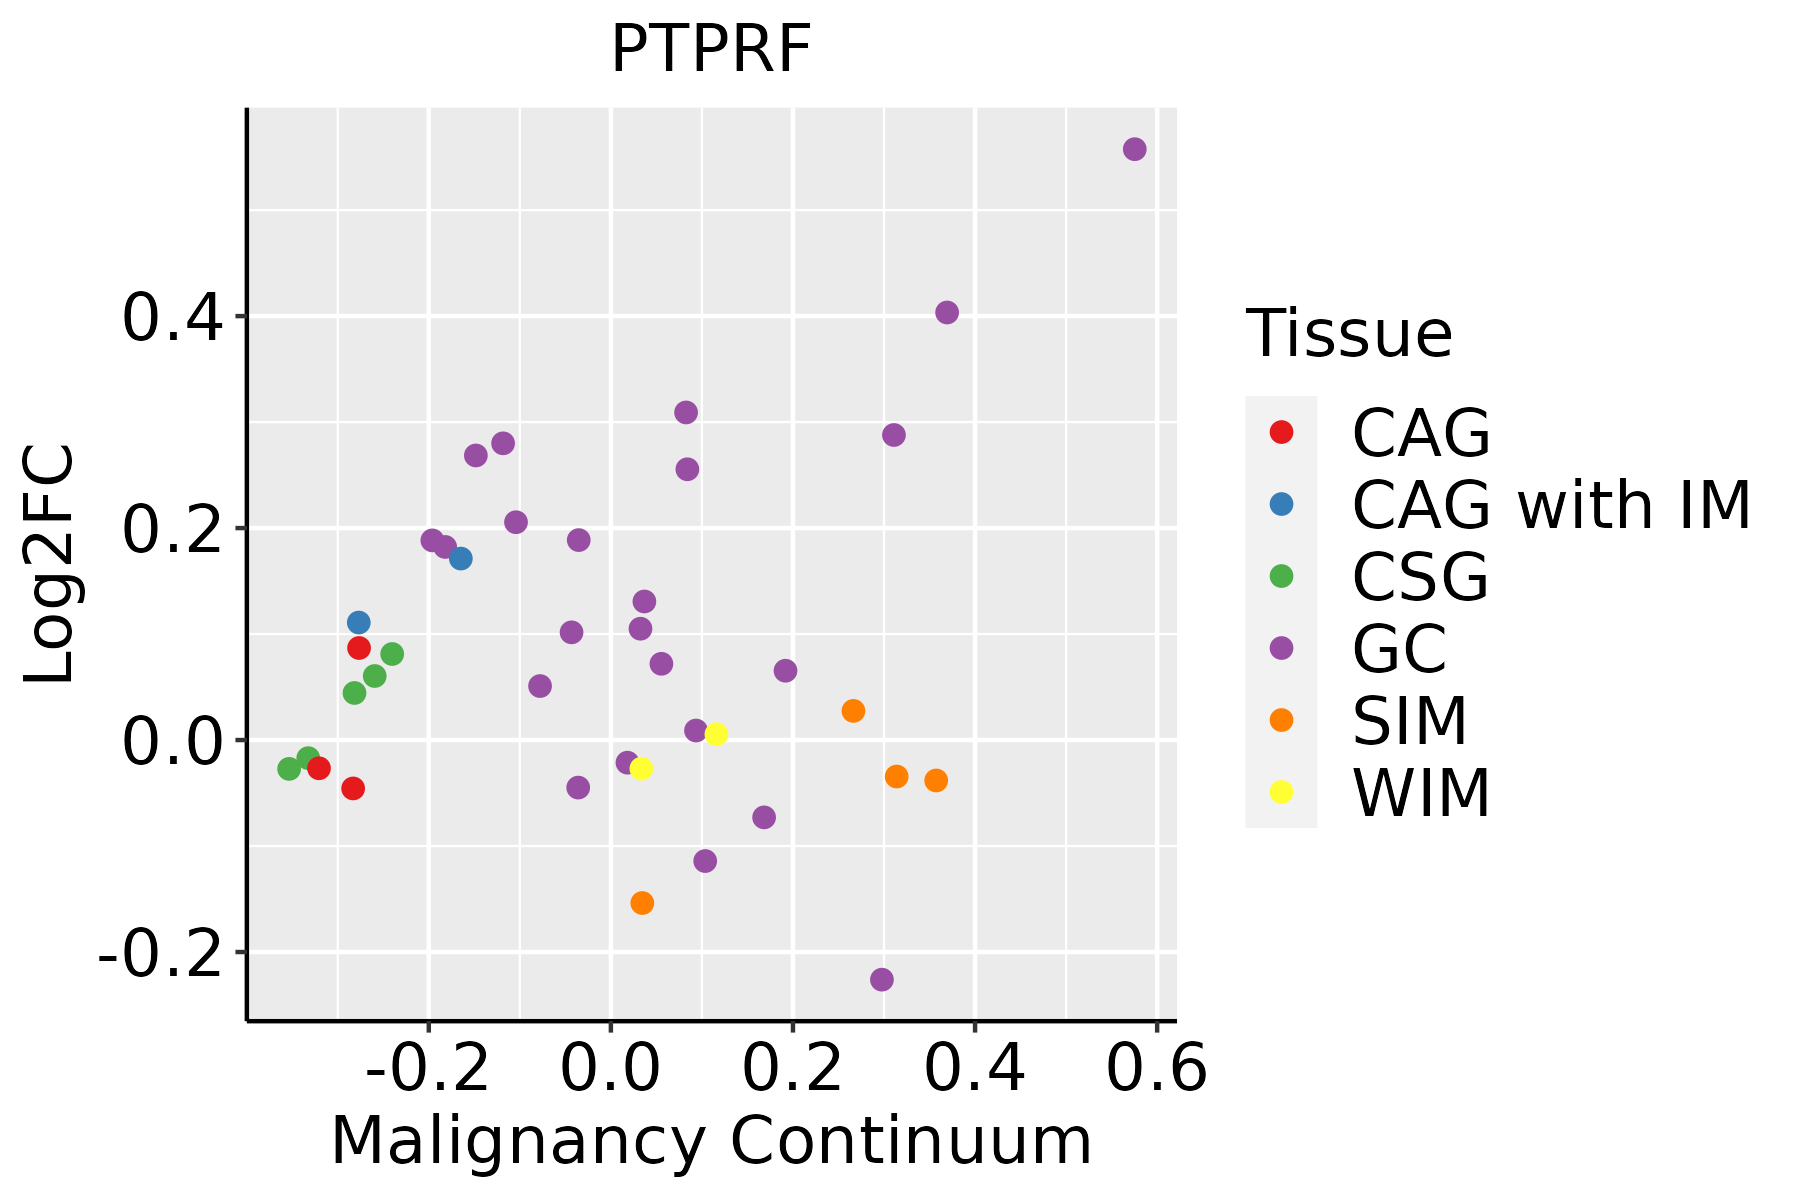 | CAG: Chronic atrophic gastritis |
| CAG with IM: Chronic atrophic gastritis with intestinal metaplasia | ||
| CSG: Chronic superficial gastritis | ||
| GC: Gastric cancer | ||
| SIM: Severe intestinal metaplasia | ||
| WIM: Wild intestinal metaplasia | ||
| Liver | 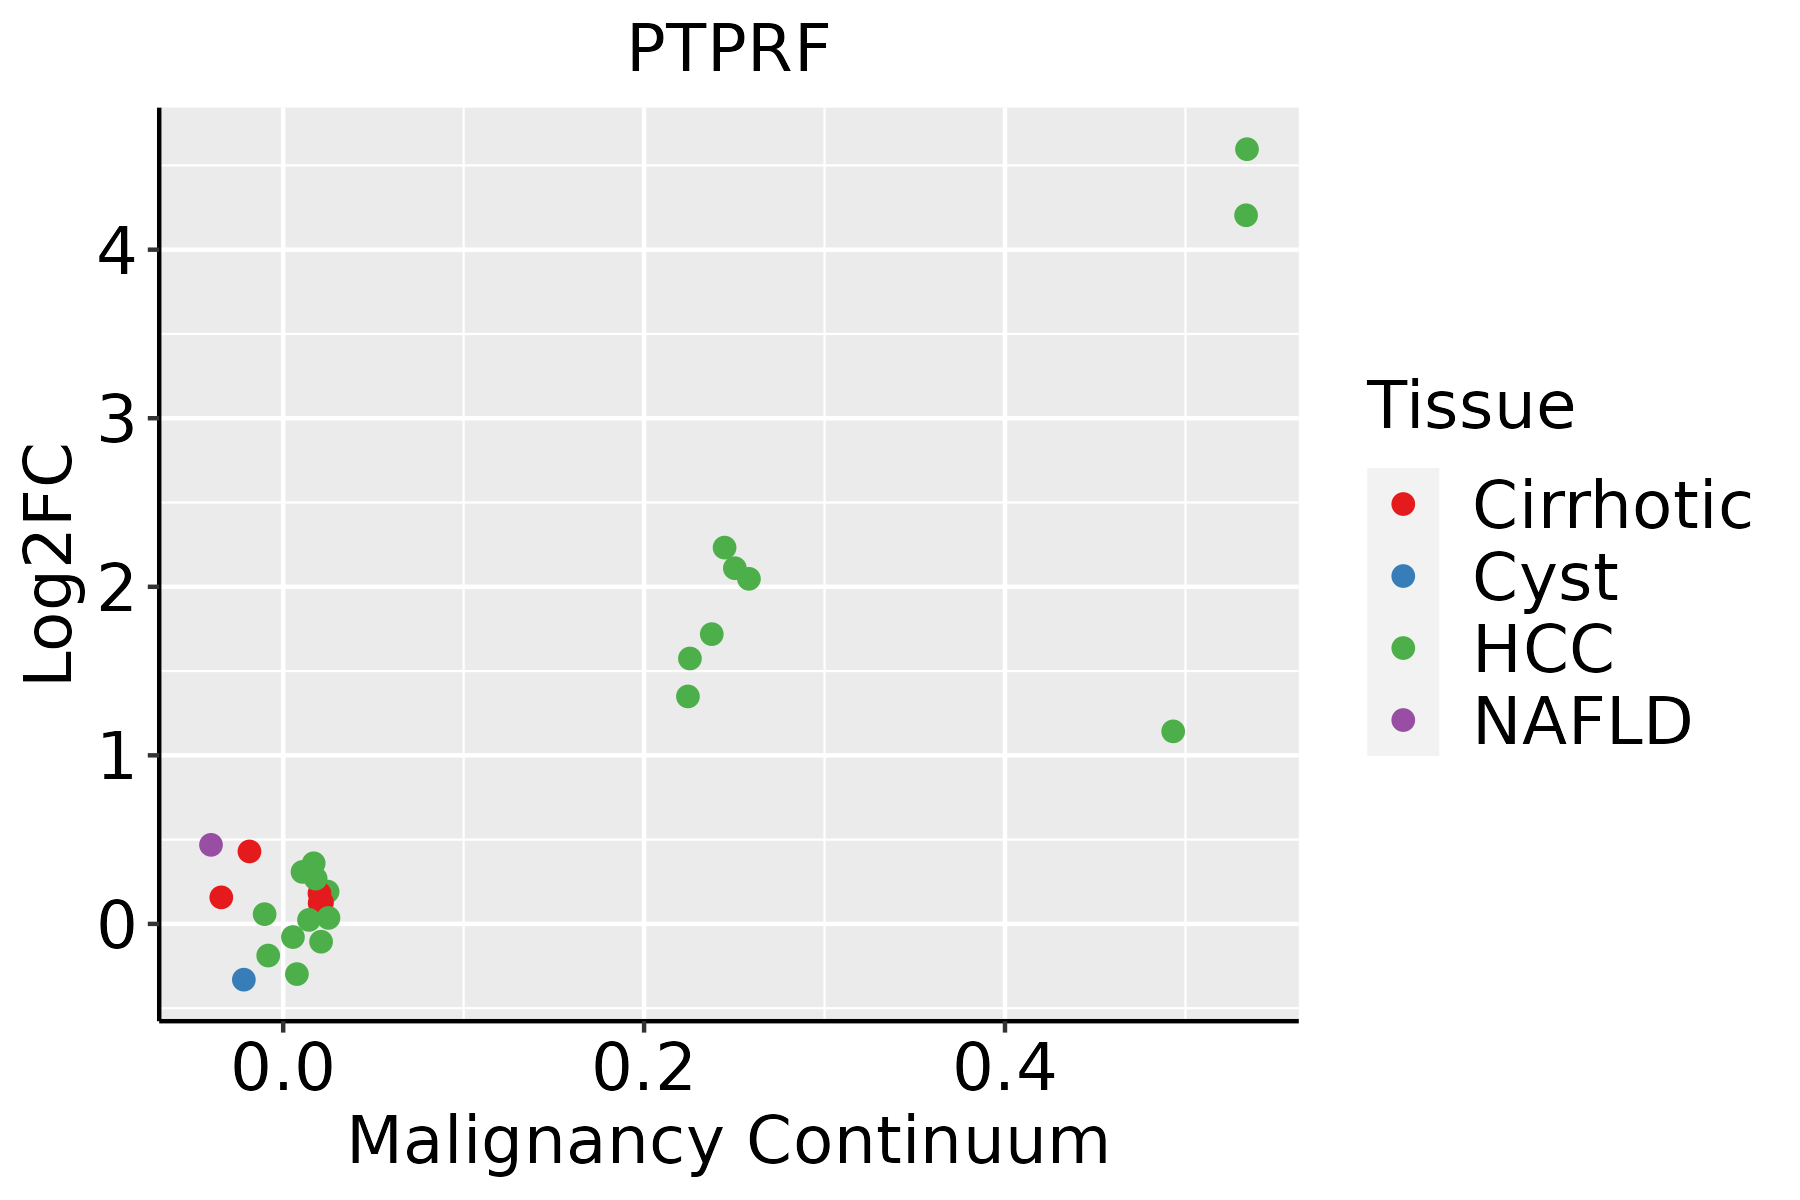 | HCC: Hepatocellular carcinoma |
| NAFLD: Non-alcoholic fatty liver disease | ||
| Oral Cavity | 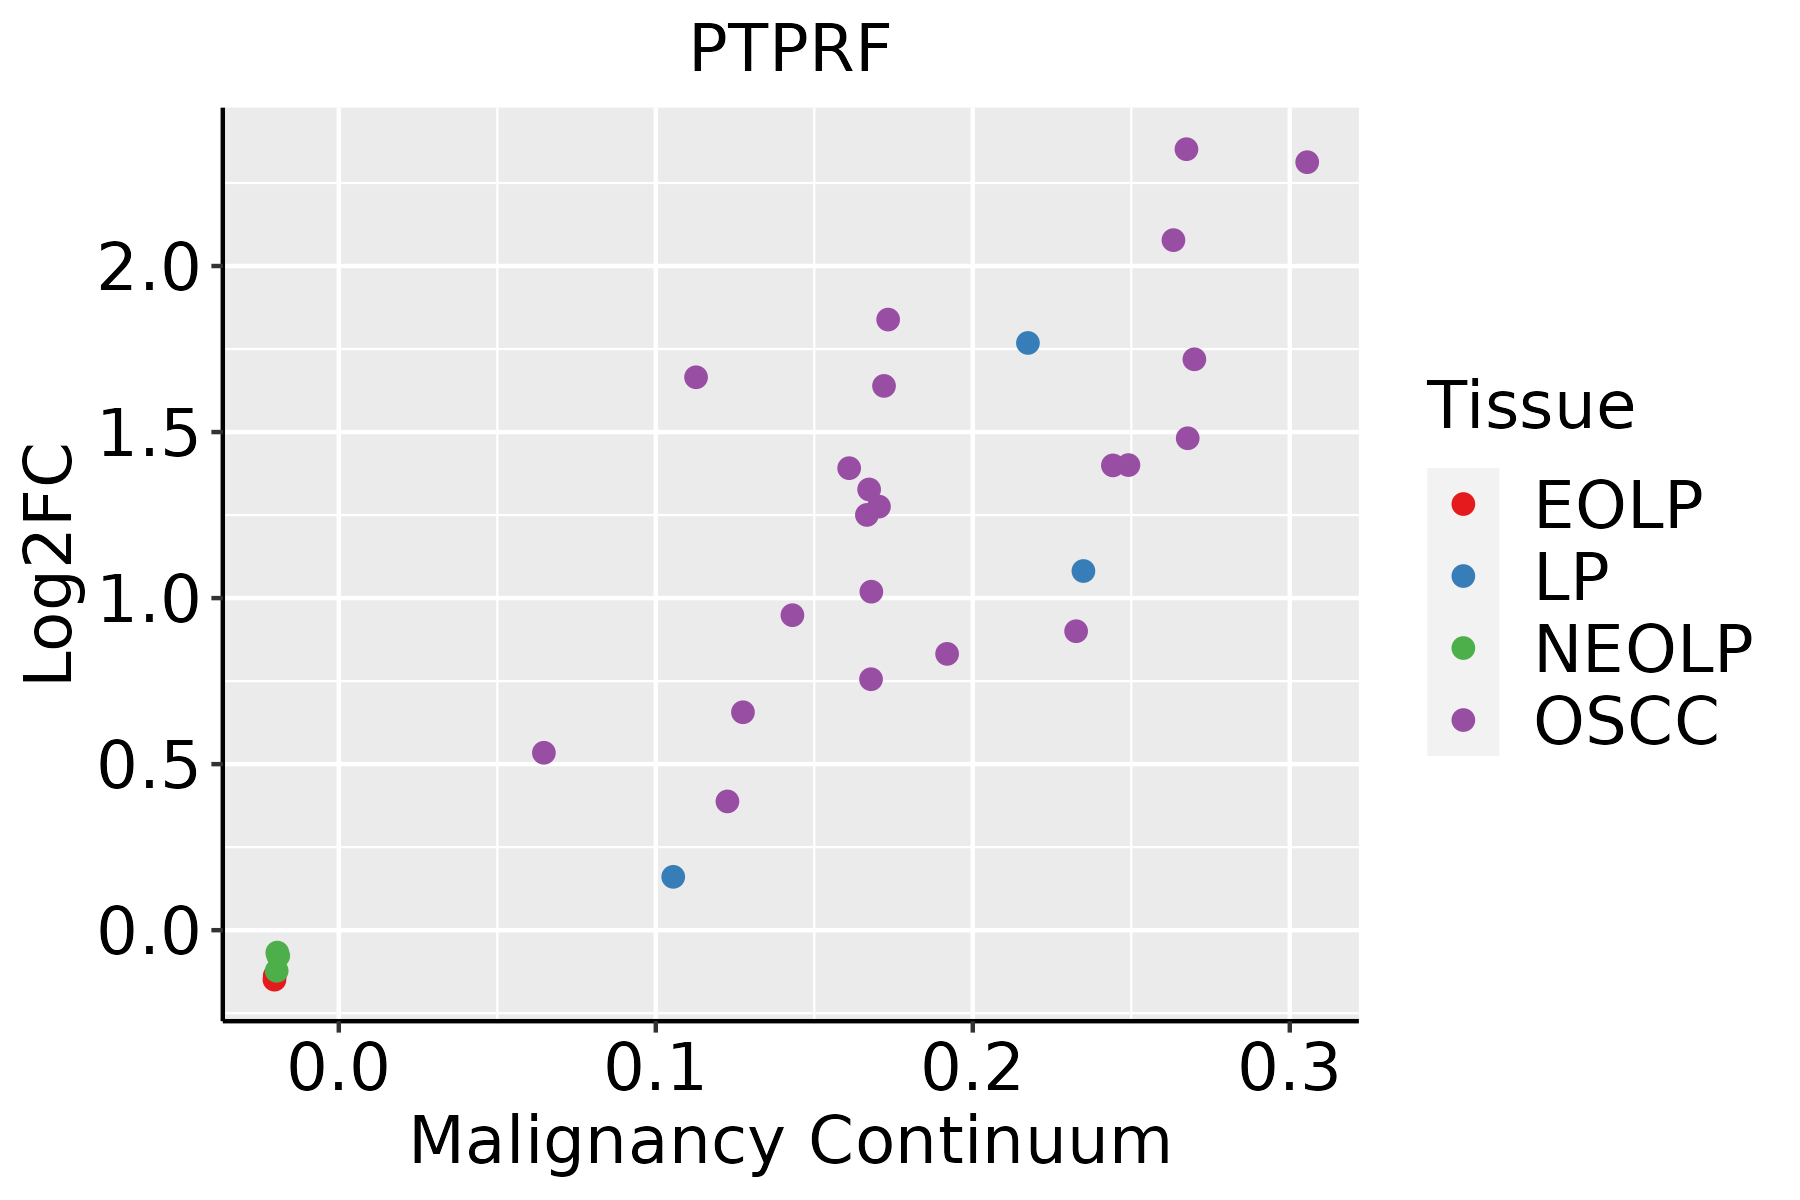 | EOLP: Erosive Oral lichen planus |
| LP: leukoplakia | ||
| NEOLP: Non-erosive oral lichen planus | ||
| OSCC: Oral squamous cell carcinoma | ||
| Prostate |  | BPH: Benign Prostatic Hyperplasia |
| Skin | 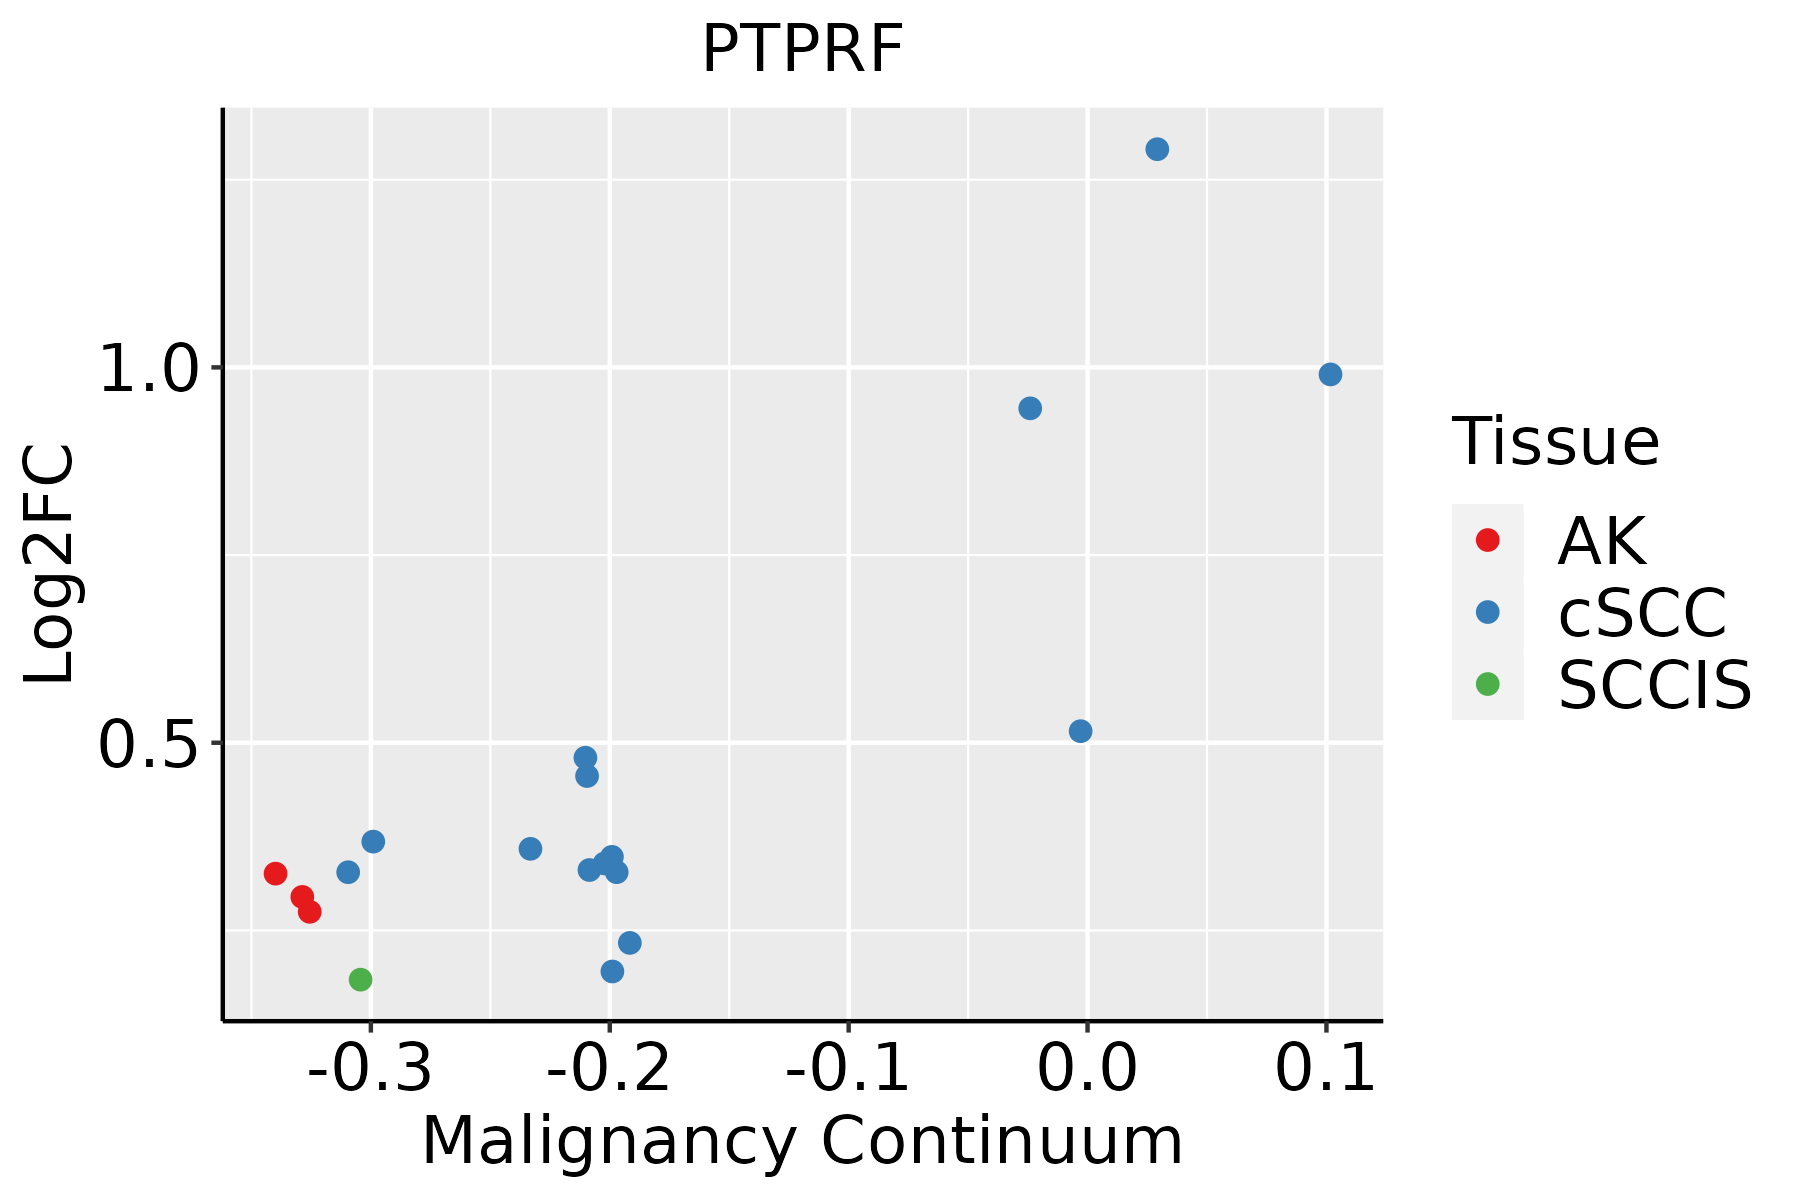 | AK: Actinic keratosis |
| cSCC: Cutaneous squamous cell carcinoma | ||
| SCCIS:squamous cell carcinoma in situ | ||
| Thyroid |  | ATC: Anaplastic thyroid cancer |
| HT: Hashimoto's thyroiditis | ||
| PTC: Papillary thyroid cancer |
| ∗log2FC in expression of this searched gene in stem-like cells from each diseased tissue sample relative to stem-like cells in normal samples in each tissue plotted against the malignancy continuum. Samples are colored based on if they are from different disease stage. |
Top |
Malignant transformation related pathway analysis |
| Find out the enriched GO biological processes and KEGG pathways involved in transition from healthy to precancer to cancer |
| Tissue | Disease Stage | Enriched GO biological Processes |
| Colorectum | AD |  |
| Colorectum | SER |  |
| Colorectum | MSS |  |
| Colorectum | MSI-H |  |
| Colorectum | FAP |  |
| ∗Top 15 enriched GO BP terms are showed in the bar plot of each disease state in each tissue. Each row represents a significant GO biological process which is colored according to the -log10(p.adjust). |
| Page: 1 2 3 4 5 6 7 8 9 |
| GO ID | Tissue | Disease Stage | Description | Gene Ratio | Bg Ratio | pvalue | p.adjust | Count |
| GO:00510989 | Breast | Precancer | regulation of binding | 44/1080 | 363/18723 | 2.59e-06 | 8.65e-05 | 44 |
| GO:00310995 | Breast | Precancer | regeneration | 25/1080 | 198/18723 | 1.91e-04 | 3.06e-03 | 25 |
| GO:00511008 | Breast | Precancer | negative regulation of binding | 19/1080 | 162/18723 | 2.56e-03 | 2.32e-02 | 19 |
| GO:19030348 | Breast | Precancer | regulation of response to wounding | 19/1080 | 167/18723 | 3.60e-03 | 2.98e-02 | 19 |
| GO:005109814 | Breast | IDC | regulation of binding | 57/1434 | 363/18723 | 1.59e-07 | 8.76e-06 | 57 |
| GO:003109912 | Breast | IDC | regeneration | 31/1434 | 198/18723 | 1.08e-04 | 2.03e-03 | 31 |
| GO:005110014 | Breast | IDC | negative regulation of binding | 25/1434 | 162/18723 | 5.98e-04 | 7.54e-03 | 25 |
| GO:190303413 | Breast | IDC | regulation of response to wounding | 24/1434 | 167/18723 | 2.07e-03 | 1.95e-02 | 24 |
| GO:005109823 | Breast | DCIS | regulation of binding | 55/1390 | 363/18723 | 3.14e-07 | 1.48e-05 | 55 |
| GO:003109921 | Breast | DCIS | regeneration | 30/1390 | 198/18723 | 1.45e-04 | 2.47e-03 | 30 |
| GO:005110022 | Breast | DCIS | negative regulation of binding | 25/1390 | 162/18723 | 3.77e-04 | 5.27e-03 | 25 |
| GO:0048678 | Breast | DCIS | response to axon injury | 15/1390 | 83/18723 | 1.07e-03 | 1.16e-02 | 15 |
| GO:190303422 | Breast | DCIS | regulation of response to wounding | 24/1390 | 167/18723 | 1.37e-03 | 1.42e-02 | 24 |
| GO:005109810 | Cervix | CC | regulation of binding | 80/2311 | 363/18723 | 1.32e-07 | 6.42e-06 | 80 |
| GO:19030349 | Cervix | CC | regulation of response to wounding | 44/2311 | 167/18723 | 6.33e-07 | 2.31e-05 | 44 |
| GO:00109757 | Cervix | CC | regulation of neuron projection development | 88/2311 | 445/18723 | 4.26e-06 | 1.09e-04 | 88 |
| GO:00064708 | Cervix | CC | protein dephosphorylation | 60/2311 | 281/18723 | 1.33e-05 | 2.68e-04 | 60 |
| GO:00310996 | Cervix | CC | regeneration | 46/2311 | 198/18723 | 1.43e-05 | 2.84e-04 | 46 |
| GO:00615647 | Cervix | CC | axon development | 89/2311 | 467/18723 | 1.71e-05 | 3.27e-04 | 89 |
| GO:00433939 | Cervix | CC | regulation of protein binding | 42/2311 | 196/18723 | 2.27e-04 | 2.55e-03 | 42 |
| Page: 1 2 3 4 5 6 7 8 9 10 11 12 |
| Pathway ID | Tissue | Disease Stage | Description | Gene Ratio | Bg Ratio | pvalue | p.adjust | qvalue | Count |
| hsa0452024 | Breast | DCIS | Adherens junction | 17/846 | 93/8465 | 9.95e-03 | 4.40e-02 | 3.24e-02 | 17 |
| hsa0452034 | Breast | DCIS | Adherens junction | 17/846 | 93/8465 | 9.95e-03 | 4.40e-02 | 3.24e-02 | 17 |
| hsa0452020 | Cervix | CC | Adherens junction | 33/1267 | 93/8465 | 6.99e-07 | 7.31e-06 | 4.32e-06 | 33 |
| hsa045147 | Cervix | CC | Cell adhesion molecules | 36/1267 | 157/8465 | 4.94e-03 | 1.67e-02 | 9.86e-03 | 36 |
| hsa04520110 | Cervix | CC | Adherens junction | 33/1267 | 93/8465 | 6.99e-07 | 7.31e-06 | 4.32e-06 | 33 |
| hsa0451412 | Cervix | CC | Cell adhesion molecules | 36/1267 | 157/8465 | 4.94e-03 | 1.67e-02 | 9.86e-03 | 36 |
| hsa0451421 | Cervix | HSIL_HPV | Cell adhesion molecules | 20/459 | 157/8465 | 3.03e-04 | 3.06e-03 | 2.47e-03 | 20 |
| hsa0451431 | Cervix | HSIL_HPV | Cell adhesion molecules | 20/459 | 157/8465 | 3.03e-04 | 3.06e-03 | 2.47e-03 | 20 |
| hsa04520 | Colorectum | AD | Adherens junction | 50/2092 | 93/8465 | 1.52e-09 | 2.83e-08 | 1.81e-08 | 50 |
| hsa045201 | Colorectum | AD | Adherens junction | 50/2092 | 93/8465 | 1.52e-09 | 2.83e-08 | 1.81e-08 | 50 |
| hsa045202 | Colorectum | SER | Adherens junction | 37/1580 | 93/8465 | 1.54e-06 | 2.35e-05 | 1.71e-05 | 37 |
| hsa045203 | Colorectum | SER | Adherens junction | 37/1580 | 93/8465 | 1.54e-06 | 2.35e-05 | 1.71e-05 | 37 |
| hsa045204 | Colorectum | MSS | Adherens junction | 42/1875 | 93/8465 | 6.18e-07 | 9.01e-06 | 5.52e-06 | 42 |
| hsa04931 | Colorectum | MSS | Insulin resistance | 36/1875 | 108/8465 | 4.74e-03 | 2.01e-02 | 1.23e-02 | 36 |
| hsa04910 | Colorectum | MSS | Insulin signaling pathway | 43/1875 | 137/8465 | 7.37e-03 | 2.84e-02 | 1.74e-02 | 43 |
| hsa045205 | Colorectum | MSS | Adherens junction | 42/1875 | 93/8465 | 6.18e-07 | 9.01e-06 | 5.52e-06 | 42 |
| hsa049311 | Colorectum | MSS | Insulin resistance | 36/1875 | 108/8465 | 4.74e-03 | 2.01e-02 | 1.23e-02 | 36 |
| hsa049101 | Colorectum | MSS | Insulin signaling pathway | 43/1875 | 137/8465 | 7.37e-03 | 2.84e-02 | 1.74e-02 | 43 |
| hsa045206 | Colorectum | MSI-H | Adherens junction | 22/797 | 93/8465 | 3.71e-05 | 5.47e-04 | 4.58e-04 | 22 |
| hsa045207 | Colorectum | MSI-H | Adherens junction | 22/797 | 93/8465 | 3.71e-05 | 5.47e-04 | 4.58e-04 | 22 |
| Page: 1 2 3 4 5 |
Top |
Cell-cell communication analysis |
| Identification of potential cell-cell interactions between two cell types and their ligand-receptor pairs for different disease states |
| Ligand | Receptor | LRpair | Pathway | Tissue | Disease Stage |
| LRRC4B | PTPRF | LRRC4B_PTPRF | NGL | Esophagus | ESCC |
| Page: 1 |
Top |
Single-cell gene regulatory network inference analysis |
| Find out the significant the regulons (TFs) and the target genes of each regulon across cell types for different disease states |
| TF | Cell Type | Tissue | Disease Stage | Target Gene | RSS | Regulon Activity |
| ∗The dot plots of a searched regulon are shown for all cell subpopulations in each disease state of each tissue based on the regulon specific score inferred using pySCENIC and by calculating the average expression. |
| Page: 1 |
Top |
Somatic mutation of malignant transformation related genes |
| Annotation of somatic variants for genes involved in malignant transformation |
| Hugo Symbol | Variant Class | Variant Classification | dbSNP RS | HGVSc | HGVSp | HGVSp Short | SWISSPROT | BIOTYPE | SIFT | PolyPhen | Tumor Sample Barcode | Tissue | Histology | Sex | Age | Stage | Therapy Types | Drugs | Outcome |
| PTPRF | SNV | Missense_Mutation | novel | c.5273N>G | p.Ser1758Cys | p.S1758C | P10586 | protein_coding | deleterious(0.02) | probably_damaging(0.999) | TCGA-5L-AAT1-01 | Breast | breast invasive carcinoma | Female | <65 | III/IV | Hormone Therapy | letrozol | SD |
| PTPRF | SNV | Missense_Mutation | c.4751N>A | p.Arg1584Gln | p.R1584Q | P10586 | protein_coding | deleterious(0) | probably_damaging(0.999) | TCGA-A8-A085-01 | Breast | breast invasive carcinoma | Male | <65 | I/II | Hormone Therapy | tamoxiphen | SD | |
| PTPRF | SNV | Missense_Mutation | c.5368G>A | p.Gly1790Arg | p.G1790R | P10586 | protein_coding | deleterious(0) | probably_damaging(0.997) | TCGA-AC-A23H-01 | Breast | breast invasive carcinoma | Female | >=65 | I/II | Unknown | Unknown | PD | |
| PTPRF | SNV | Missense_Mutation | rs565543436 | c.2468N>A | p.Arg823Gln | p.R823Q | P10586 | protein_coding | tolerated(0.12) | benign(0.36) | TCGA-AN-A0AK-01 | Breast | breast invasive carcinoma | Female | >=65 | I/II | Unknown | Unknown | SD |
| PTPRF | SNV | Missense_Mutation | rs767075536 | c.2671N>T | p.Arg891Trp | p.R891W | P10586 | protein_coding | tolerated(0.06) | possibly_damaging(0.863) | TCGA-BH-A0HA-01 | Breast | breast invasive carcinoma | Female | <65 | I/II | Unknown | Unknown | SD |
| PTPRF | SNV | Missense_Mutation | c.4015N>A | p.Asp1339Asn | p.D1339N | P10586 | protein_coding | tolerated(0.17) | probably_damaging(0.911) | TCGA-BH-A0HP-01 | Breast | breast invasive carcinoma | Female | >=65 | III/IV | Chemotherapy | doxorubicin | SD | |
| PTPRF | SNV | Missense_Mutation | c.5710N>A | p.His1904Asn | p.H1904N | P10586 | protein_coding | deleterious(0.02) | probably_damaging(0.987) | TCGA-BH-A0HP-01 | Breast | breast invasive carcinoma | Female | >=65 | III/IV | Chemotherapy | doxorubicin | SD | |
| PTPRF | SNV | Missense_Mutation | c.5201N>C | p.Ile1734Thr | p.I1734T | P10586 | protein_coding | deleterious(0.01) | probably_damaging(1) | TCGA-BH-A1FU-01 | Breast | breast invasive carcinoma | Female | <65 | I/II | Unknown | Unknown | PD | |
| PTPRF | SNV | Missense_Mutation | novel | c.64N>C | p.Gly22Arg | p.G22R | P10586 | protein_coding | tolerated_low_confidence(0.47) | benign(0.063) | TCGA-BH-A5IZ-01 | Breast | breast invasive carcinoma | Female | <65 | I/II | Chemotherapy | adriamycin | CR |
| PTPRF | SNV | Missense_Mutation | rs367652888 | c.2492N>T | p.Thr831Met | p.T831M | P10586 | protein_coding | tolerated(0.09) | probably_damaging(1) | TCGA-C8-A134-01 | Breast | breast invasive carcinoma | Female | <65 | I/II | Chemotherapy | 5-fluorouracil | CR |
| Page: 1 2 3 4 5 6 7 8 9 10 11 12 13 14 15 16 17 18 19 20 21 |
Top |
Related drugs of malignant transformation related genes |
| Identification of chemicals and drugs interact with genes involved in malignant transfromation |
| (DGIdb 4.0) |
| Entrez ID | Symbol | Category | Interaction Types | Drug Claim Name | Drug Name | PMIDs |
| 5792 | PTPRF | DRUGGABLE GENOME, ENZYME, PROTEIN PHOSPHATASE | ERLOTINIB HYDROCHLORIDE | 26291013 | ||
| 5792 | PTPRF | DRUGGABLE GENOME, ENZYME, PROTEIN PHOSPHATASE | inhibitor | 252827428 |
| Page: 1 |

Copyright 2023-Present -The University of Texas Health Science Center at Houston |