Schematic overview of the cellular and molecular mechanisms involved in the cancer progression, including the proposed cellular and molecular mechanisms in cancer cells trajectory. AT1: alveolar type 1 cells; AT2: alveolar type 2 cells; AAH: atypical adenomatous hyperplasia; AIS: adenocarcinoma in situ; MIA: minimally invasive adenocarcinoma; IA: invasive adenocarcinoma; EMT: epithelial-mesenchymal transition

Home

Download

Statistics

Help

Contact

Center for Computational Systems Medicine
leaf

Gene summary

leaf

Malignant transformation analysis

leaf

Malignant transformation related pathway analysis

leaf

Cell-cell communication analysis

leaf

Single-cell gene regulatory network inference analysis

leaf

Somatic mutation of malignant transformation related genes

leaf

Related drugs of malignant transformation related genes

Gene: PTPRE

Gene summary for PTPRE

check button Gene summary.

Gene informationSpeciesHuman
Gene symbol

PTPRE

Gene ID

5791

Gene nameprotein tyrosine phosphatase receptor type E
Gene AliasHPTPE
Cytomap10q26.2
Gene Typeprotein-coding
GO ID

GO:0006464

UniProtAcc

P23469


Top

Malignant transformation analysis

check button Identification of the aberrant gene expression in precancerous and cancerous lesions by comparing the gene expression of stem-like cells in diseased tissues with normal stem cells
check button Malignant transformation involving gene list.
Entrez IDSymbolReplicatesSpeciesOrganTissueAdj P-valueLog2FCMalignancy
5791PTPRELZE4THumanEsophagusESCC1.31e-05-1.13e-020.0811
5791PTPRELZE6THumanEsophagusESCC1.03e-03-5.80e-030.0845
5791PTPREP2T-EHumanEsophagusESCC2.48e-168.44e-020.1177
5791PTPREP4T-EHumanEsophagusESCC2.91e-056.04e-020.1323
5791PTPREP5T-EHumanEsophagusESCC4.53e-132.34e-010.1327
5791PTPREP8T-EHumanEsophagusESCC2.62e-072.65e-010.0889
5791PTPREP9T-EHumanEsophagusESCC1.14e-045.92e-020.1131
5791PTPREP10T-EHumanEsophagusESCC1.94e-07-9.61e-020.116
5791PTPREP11T-EHumanEsophagusESCC7.55e-137.71e-010.1426
5791PTPREP12T-EHumanEsophagusESCC1.30e-12-4.00e-020.1122
5791PTPREP15T-EHumanEsophagusESCC3.33e-04-1.90e-020.1149
5791PTPREP16T-EHumanEsophagusESCC1.98e-092.14e-010.1153
5791PTPREP19T-EHumanEsophagusESCC5.61e-035.51e-010.1662
5791PTPREP21T-EHumanEsophagusESCC2.72e-131.88e-010.1617
5791PTPREP22T-EHumanEsophagusESCC2.01e-05-7.45e-020.1236
5791PTPREP23T-EHumanEsophagusESCC1.87e-042.73e-020.108
5791PTPREP24T-EHumanEsophagusESCC3.52e-091.32e-010.1287
5791PTPREP26T-EHumanEsophagusESCC9.21e-082.37e-010.1276
5791PTPREP27T-EHumanEsophagusESCC2.78e-115.55e-020.1055
5791PTPREP28T-EHumanEsophagusESCC4.51e-102.07e-010.1149
Page: 1 2 3 4 5 6 

check button Transcriptomic changes along malignancy continuum.
TissueExpression DynamicsAbbreviation
EsophagusThe image shows the transcriptomic changes along malignancy continuum.log2FC in expression of this searched gene in stem-like cells from each diseased tissue sample relative to stem-like cells in normal samples in each tissue plotted against the malignancy continuum. Samples are colored based on if they are from different disease stage.
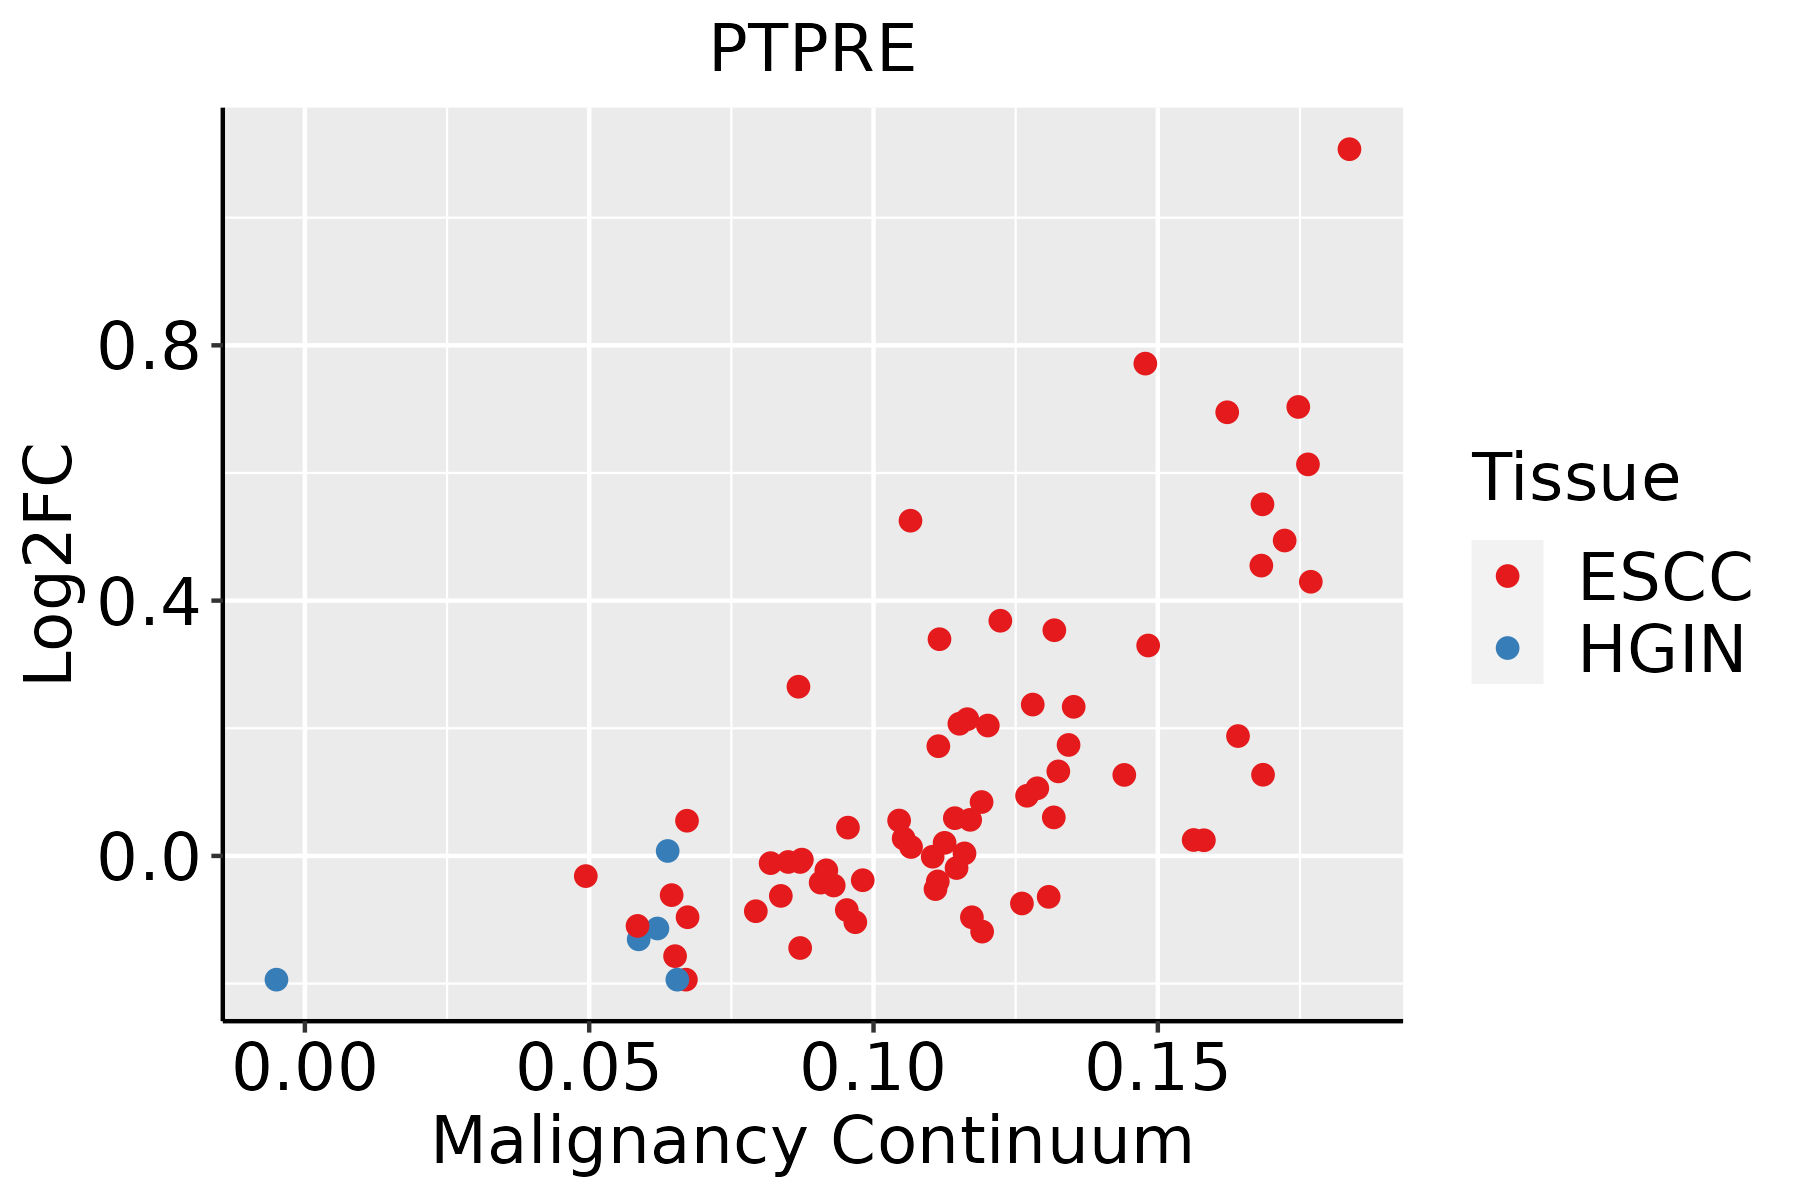
ESCC: Esophageal squamous cell carcinoma
HGIN: High-grade intraepithelial neoplasias
LGIN: Low-grade intraepithelial neoplasias
LiverThe image shows the transcriptomic changes along malignancy continuum.log2FC in expression of this searched gene in stem-like cells from each diseased tissue sample relative to stem-like cells in normal samples in each tissue plotted against the malignancy continuum. Samples are colored based on if they are from different disease stage.
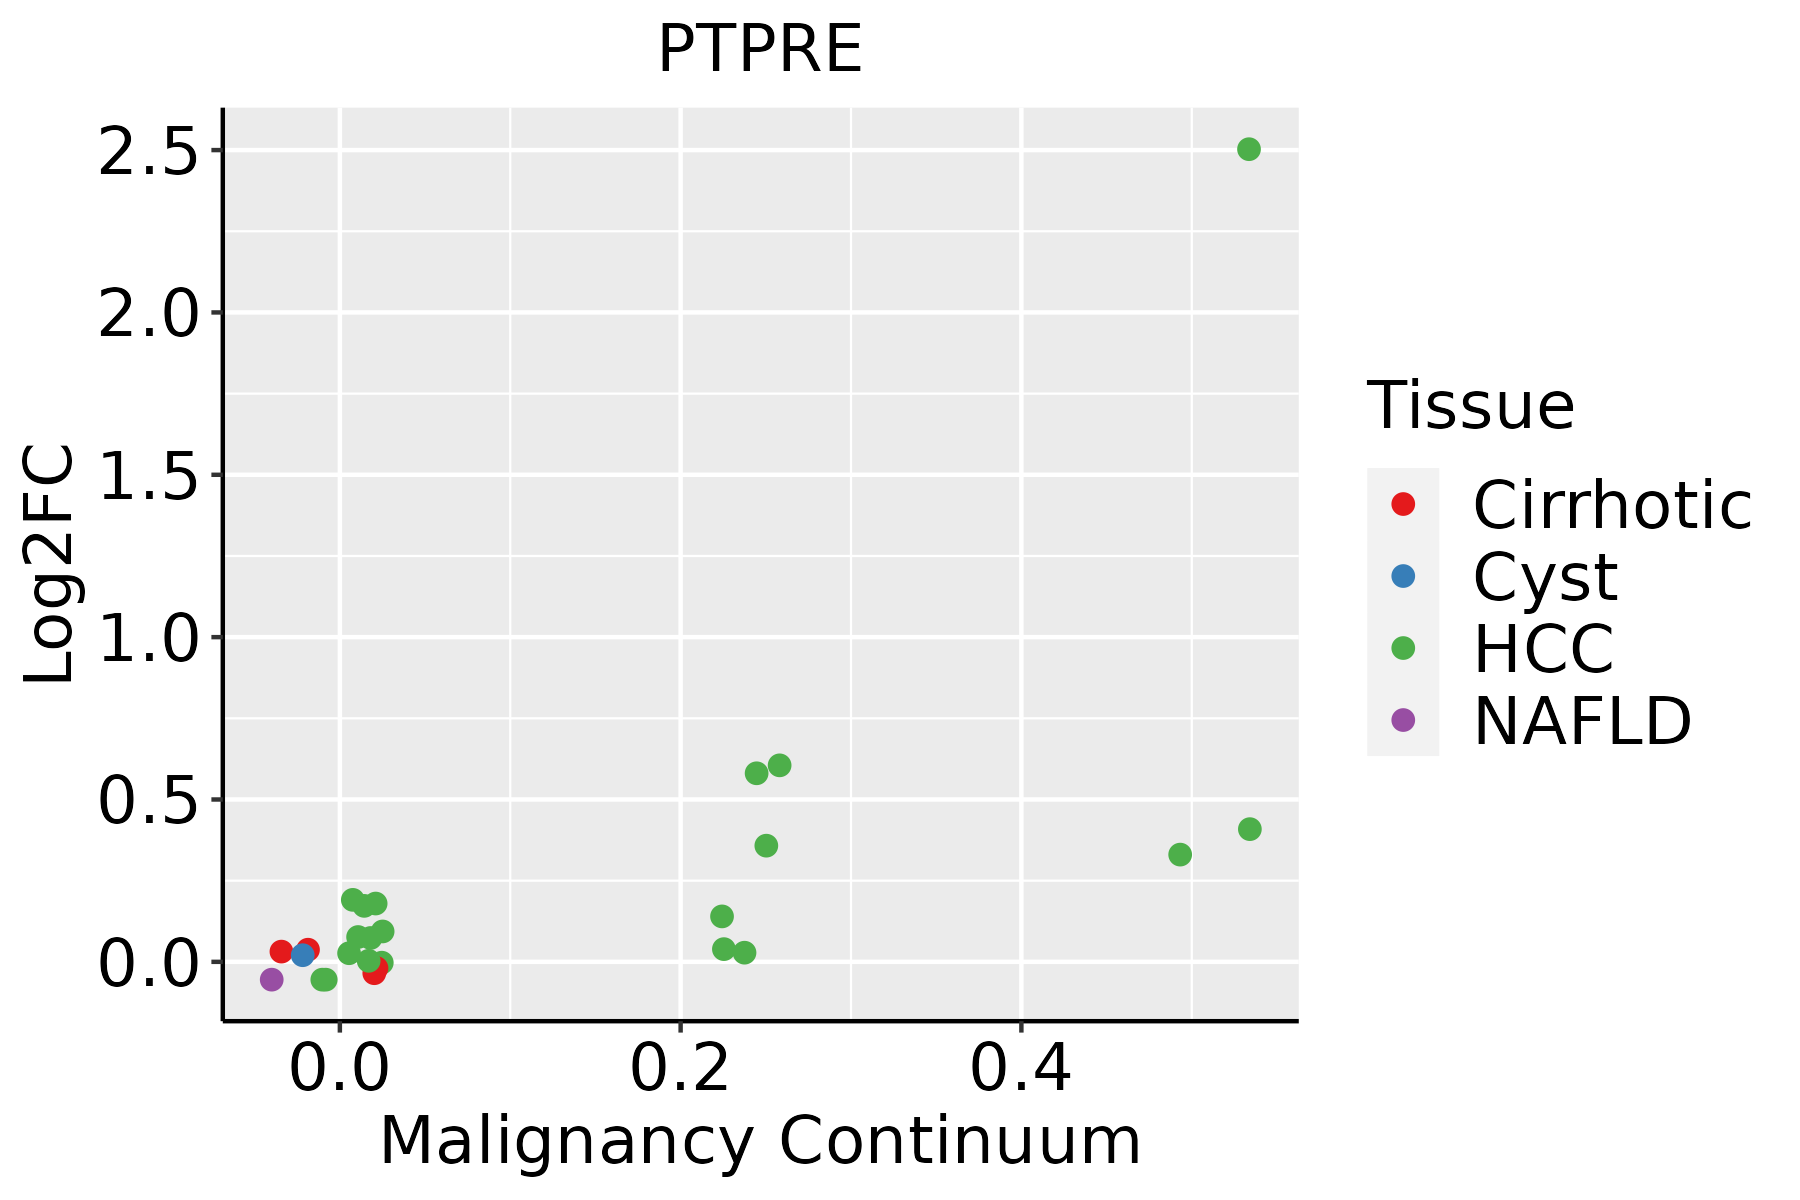
HCC: Hepatocellular carcinoma
NAFLD: Non-alcoholic fatty liver disease
LungThe image shows the transcriptomic changes along malignancy continuum.log2FC in expression of this searched gene in stem-like cells from each diseased tissue sample relative to stem-like cells in normal samples in each tissue plotted against the malignancy continuum. Samples are colored based on if they are from different disease stage.
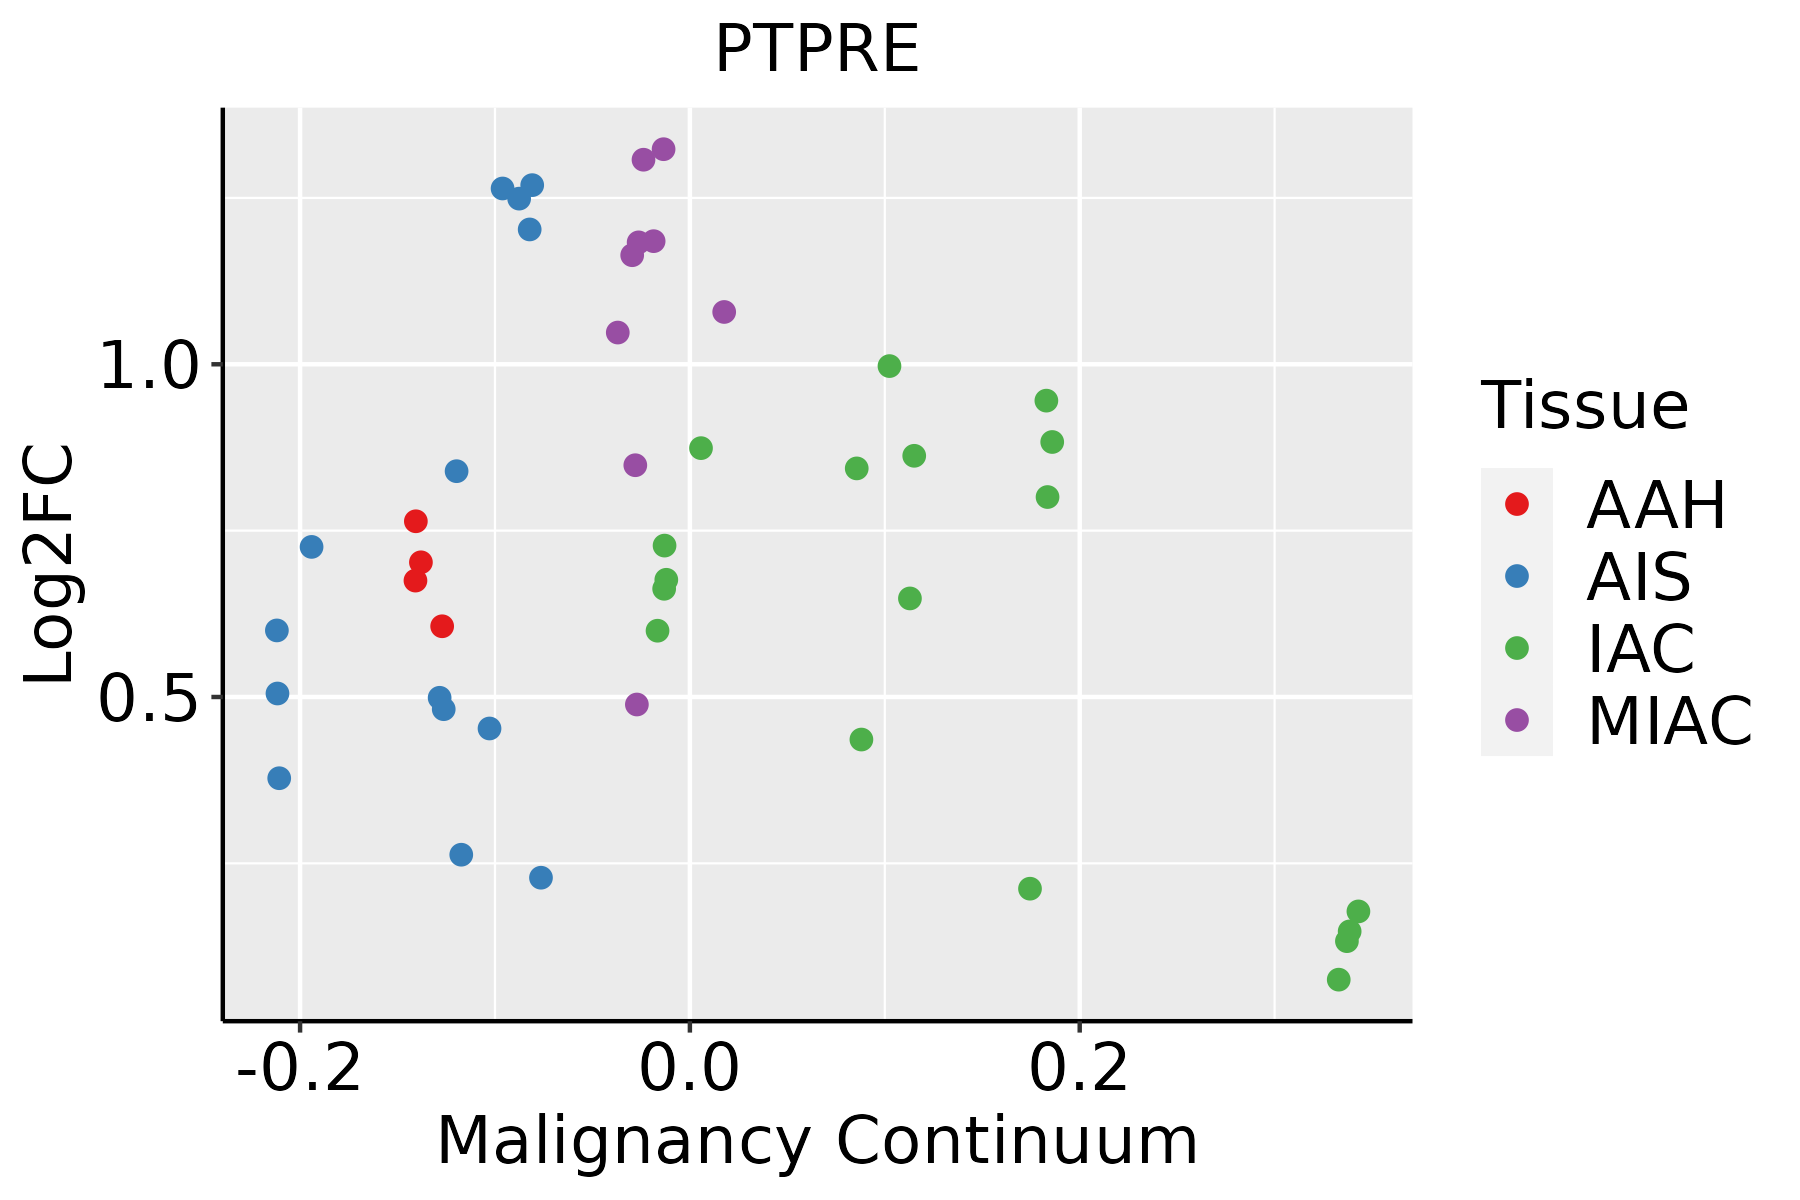
AAH: Atypical adenomatous hyperplasia
AIS: Adenocarcinoma in situ
IAC: Invasive lung adenocarcinoma
MIA: Minimally invasive adenocarcinoma
Oral CavityThe image shows the transcriptomic changes along malignancy continuum.log2FC in expression of this searched gene in stem-like cells from each diseased tissue sample relative to stem-like cells in normal samples in each tissue plotted against the malignancy continuum. Samples are colored based on if they are from different disease stage.EOLP: Erosive Oral lichen planus
LP: leukoplakia
NEOLP: Non-erosive oral lichen planus
OSCC: Oral squamous cell carcinoma
SkinThe image shows the transcriptomic changes along malignancy continuum.log2FC in expression of this searched gene in stem-like cells from each diseased tissue sample relative to stem-like cells in normal samples in each tissue plotted against the malignancy continuum. Samples are colored based on if they are from different disease stage.
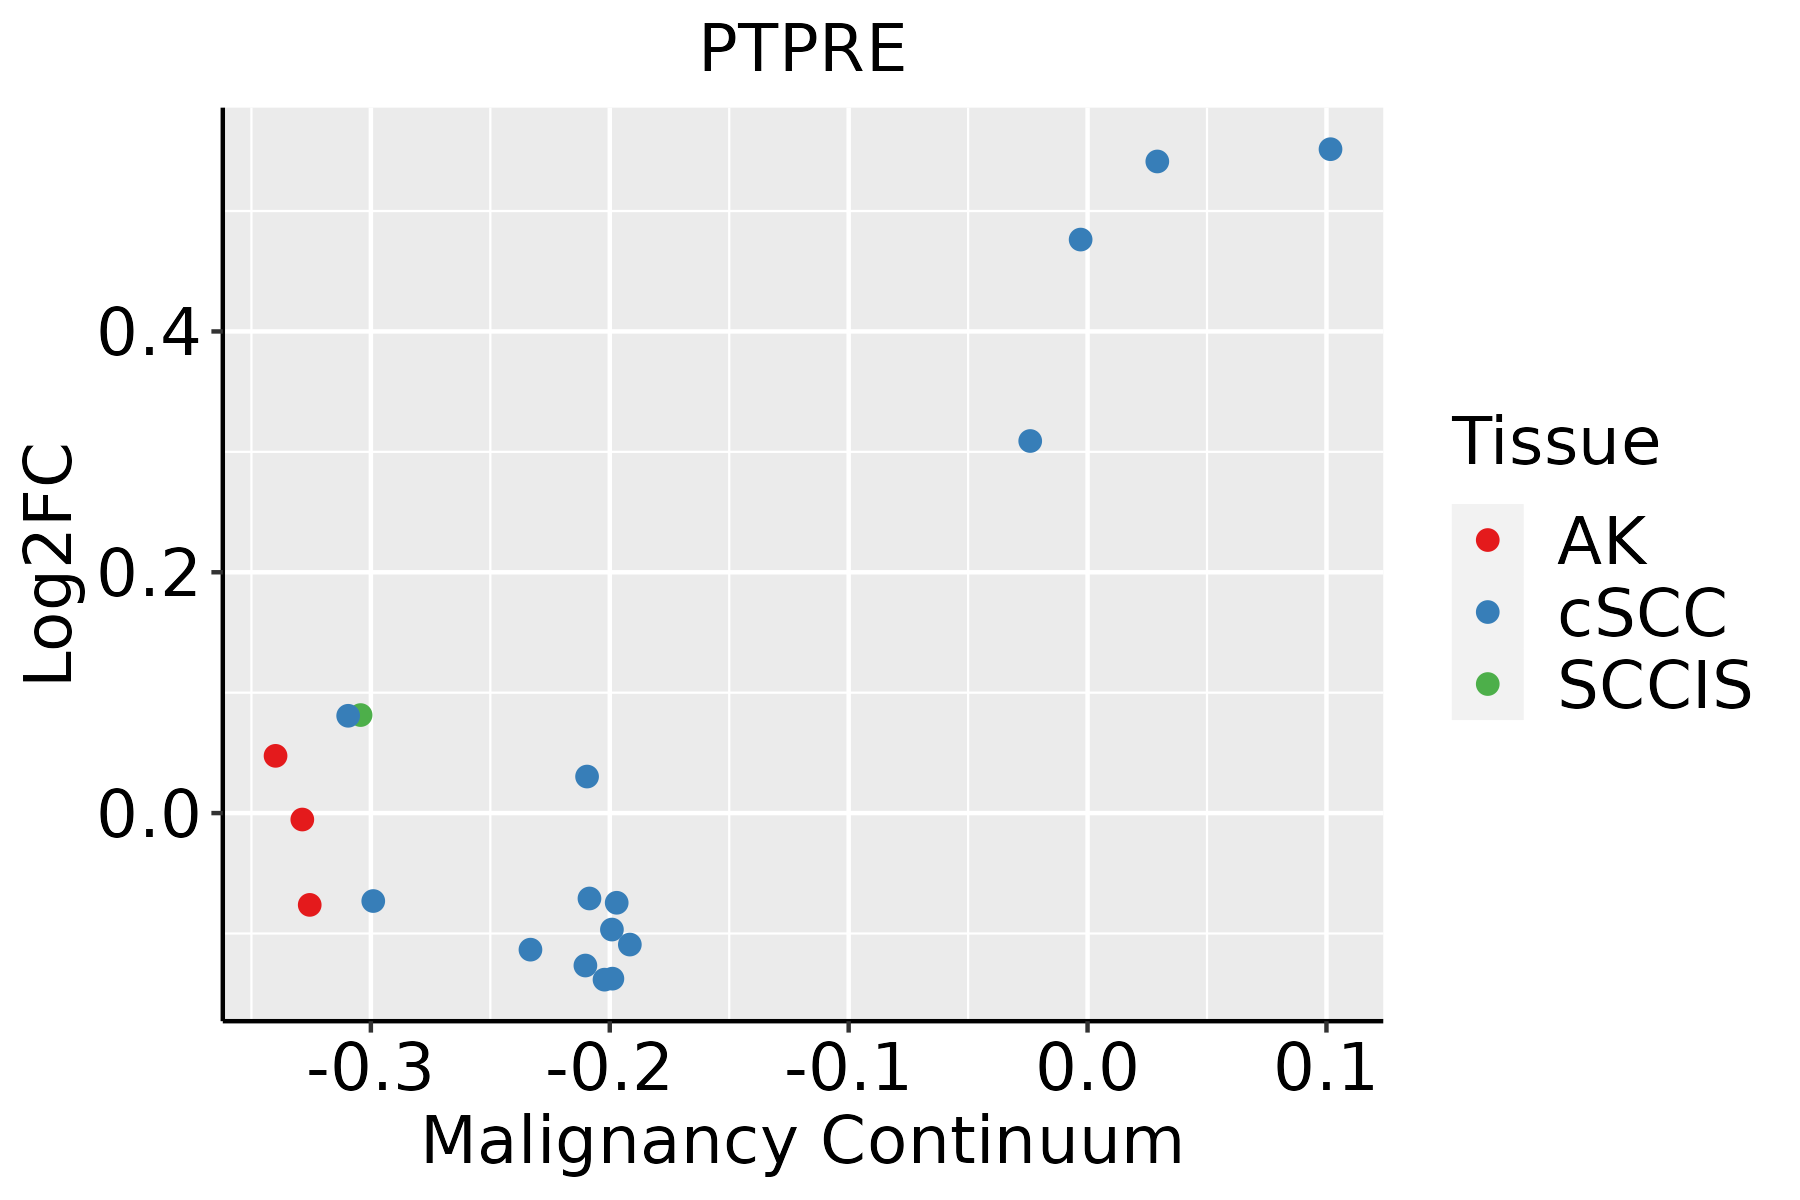
AK: Actinic keratosis
cSCC: Cutaneous squamous cell carcinoma
SCCIS:squamous cell carcinoma in situ
ThyroidThe image shows the transcriptomic changes along malignancy continuum.log2FC in expression of this searched gene in stem-like cells from each diseased tissue sample relative to stem-like cells in normal samples in each tissue plotted against the malignancy continuum. Samples are colored based on if they are from different disease stage.
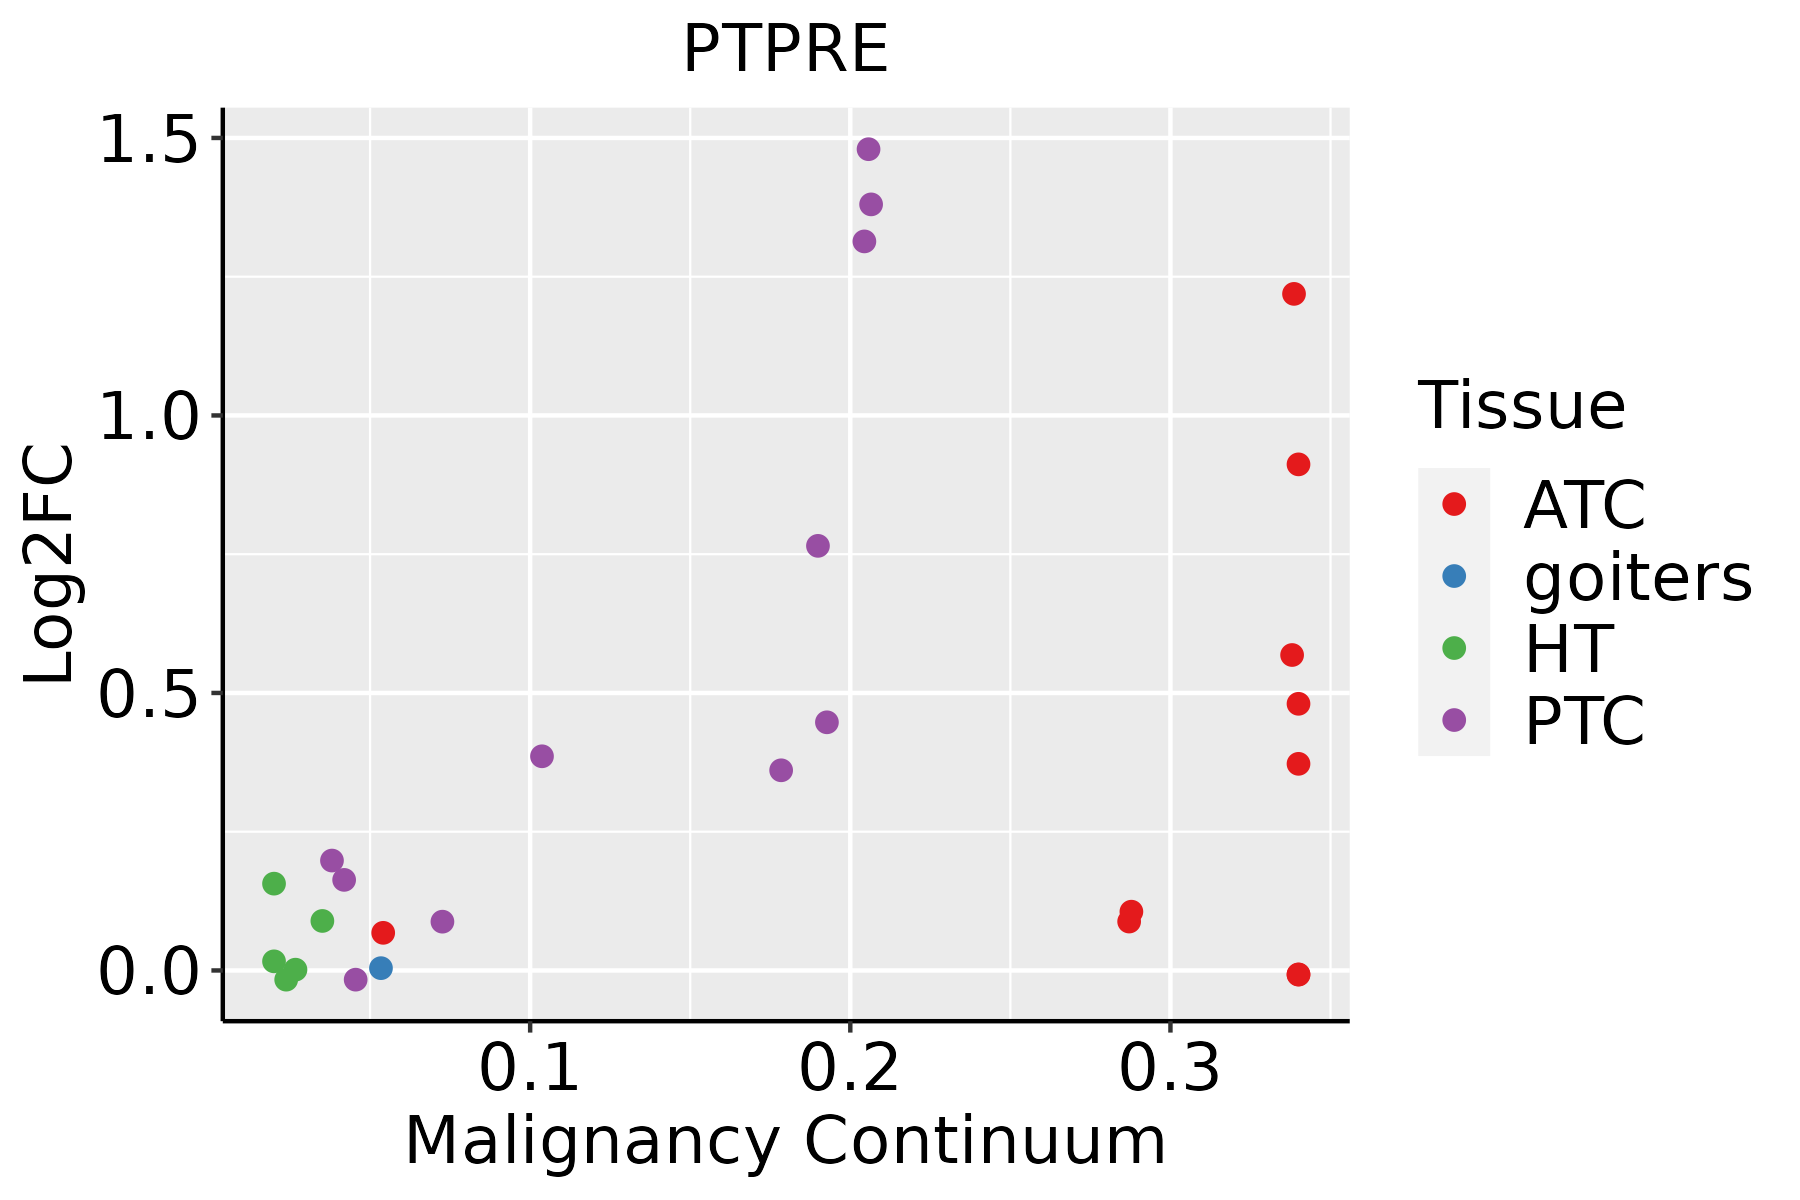
ATC: Anaplastic thyroid cancer
HT: Hashimoto's thyroiditis
PTC: Papillary thyroid cancer
∗log2FC in expression of this searched gene in stem-like cells from each diseased tissue sample relative to stem-like cells in normal samples in each tissue plotted against the malignancy continuum. Samples are colored based on if they are from different disease stage.

Top

Malignant transformation related pathway analysis

check buttonFind out the enriched GO biological processes and KEGG pathways involved in transition from healthy to precancer to cancer
check button Figure of enriched GO biological processes.
TissueDisease StageEnriched GO biological Processes
ColorectumADGO analysis - Figure of enriched GO biological processes: Top 15 enriched GO BP terms are showed in the bar plot of each disease state in each tissue. Each row represents a significant GO biological process which is colored according to the -log10(p.adjust).
ColorectumSERGO analysis - Figure of enriched GO biological processes: Top 15 enriched GO BP terms are showed in the bar plot of each disease state in each tissue. Each row represents a significant GO biological process which is colored according to the -log10(p.adjust).
ColorectumMSSGO analysis - Figure of enriched GO biological processes: Top 15 enriched GO BP terms are showed in the bar plot of each disease state in each tissue. Each row represents a significant GO biological process which is colored according to the -log10(p.adjust).
ColorectumMSI-HGO analysis - Figure of enriched GO biological processes: Top 15 enriched GO BP terms are showed in the bar plot of each disease state in each tissue. Each row represents a significant GO biological process which is colored according to the -log10(p.adjust).
ColorectumFAPGO analysis - Figure of enriched GO biological processes: Top 15 enriched GO BP terms are showed in the bar plot of each disease state in each tissue. Each row represents a significant GO biological process which is colored according to the -log10(p.adjust).
∗Top 15 enriched GO BP terms are showed in the bar plot of each disease state in each tissue. Each row represents a significant GO biological process which is colored according to the -log10(p.adjust).
Page: 1 2 3 4 5 6 7 8 9 

check button Enriched GO biological processes.
GO IDTissueDisease StageDescriptionGene RatioBg Ratiopvaluep.adjustCount
GO:001631110EsophagusESCCdephosphorylation251/8552417/187231.26e-092.99e-08251
GO:000647018EsophagusESCCprotein dephosphorylation177/8552281/187233.13e-096.72e-08177
GO:190165319EsophagusESCCcellular response to peptide208/8552359/187231.68e-062.01e-05208
GO:0043434111EsophagusESCCresponse to peptide hormone234/8552414/187234.93e-065.21e-05234
GO:003286918EsophagusESCCcellular response to insulin stimulus124/8552203/187236.63e-066.75e-05124
GO:003286818EsophagusESCCresponse to insulin156/8552264/187237.21e-067.20e-05156
GO:007137516EsophagusESCCcellular response to peptide hormone stimulus166/8552290/187234.48e-053.55e-04166
GO:00082869EsophagusESCCinsulin receptor signaling pathway66/8552116/187239.76e-033.37e-0266
GO:003286821LiverHCCresponse to insulin172/7958264/187237.14e-144.23e-12172
GO:003286921LiverHCCcellular response to insulin stimulus137/7958203/187234.69e-132.44e-11137
GO:004343422LiverHCCresponse to peptide hormone247/7958414/187239.55e-134.77e-11247
GO:007137521LiverHCCcellular response to peptide hormone stimulus179/7958290/187232.54e-119.88e-10179
GO:190165321LiverHCCcellular response to peptide211/7958359/187232.86e-109.63e-09211
GO:00082862LiverHCCinsulin receptor signaling pathway78/7958116/187236.15e-081.29e-0678
GO:001631121LiverHCCdephosphorylation230/7958417/187231.00e-071.96e-06230
GO:000647021LiverHCCprotein dephosphorylation162/7958281/187231.91e-073.46e-06162
GO:19000762LiverHCCregulation of cellular response to insulin stimulus43/795864/187235.73e-055.31e-0443
GO:00466261LiverHCCregulation of insulin receptor signaling pathway43/795866/187231.69e-041.34e-0343
GO:0046627LiverHCCnegative regulation of insulin receptor signaling pathway22/795835/187231.21e-024.41e-0222
GO:1900077LiverHCCnegative regulation of cellular response to insulin stimulus23/795837/187231.25e-024.53e-0223
Page: 1 2 3 4 5 6 

check button Enriched KEGG pathways.
Pathway IDTissueDisease StageDescriptionGene RatioBg Ratiopvaluep.adjustqvalueCount
Page: 1 

Top

Cell-cell communication analysis

check buttonIdentification of potential cell-cell interactions between two cell types and their ligand-receptor pairs for different disease states
LigandReceptorLRpairPathwayTissueDisease Stage
Page: 1 

Top

Single-cell gene regulatory network inference analysis

check buttonFind out the significant the regulons (TFs) and the target genes of each regulon across cell types for different disease states
TFCell TypeTissueDisease StageTarget GeneRSSRegulon Activity
∗The dot plots of a searched regulon are shown for all cell subpopulations in each disease state of each tissue based on the regulon specific score inferred using pySCENIC and by calculating the average expression.
Page: 1 

Top

Somatic mutation of malignant transformation related genes

check buttonAnnotation of somatic variants for genes involved in malignant transformation
Hugo SymbolVariant ClassVariant ClassificationdbSNP RSHGVScHGVSpHGVSp ShortSWISSPROTBIOTYPESIFTPolyPhenTumor Sample BarcodeTissueHistologySexAgeStageTherapy TypesDrugsOutcome
PTPRESNVMissense_Mutationnovelc.680C>Tp.Ser227Phep.S227FP23469protein_codingdeleterious(0)probably_damaging(0.978)TCGA-5L-AAT1-01Breastbreast invasive carcinomaFemale<65III/IVHormone TherapyletrozolSD
PTPRESNVMissense_Mutationrs765453483c.1954G>Tp.Ala652Serp.A652SP23469protein_codingtolerated(0.31)possibly_damaging(0.866)TCGA-A2-A25C-01Breastbreast invasive carcinomaFemale<65I/IIChemotherapytaxotereSD
PTPRESNVMissense_Mutationc.178N>Tp.Leu60Phep.L60FP23469protein_codingtolerated(0.8)benign(0.112)TCGA-A7-A26J-01Breastbreast invasive carcinomaFemale<65I/IIHormone TherapytamoxiphenSD
PTPRESNVMissense_Mutationrs765453483c.1954N>Tp.Ala652Serp.A652SP23469protein_codingtolerated(0.31)possibly_damaging(0.866)TCGA-AC-A3TM-01Breastbreast invasive carcinomaFemale<65III/IVChemotherapycytoxanCR
PTPRESNVMissense_Mutationnovelc.628N>Tp.Pro210Serp.P210SP23469protein_codingdeleterious(0.03)probably_damaging(0.999)TCGA-BH-A0HF-01Breastbreast invasive carcinomaFemale>=65I/IIHormone TherapyarimidexSD
PTPRESNVMissense_Mutationc.904C>Tp.Pro302Serp.P302SP23469protein_codingdeleterious(0)probably_damaging(1)TCGA-BH-A18G-01Breastbreast invasive carcinomaFemale>=65I/IIUnknownUnknownSD
PTPRESNVMissense_Mutationrs753495289c.1754N>Ap.Arg585Glnp.R585QP23469protein_codingdeleterious(0.01)possibly_damaging(0.655)TCGA-E2-A158-01Breastbreast invasive carcinomaFemale<65I/IIChemotherapyarimidexSD
PTPRESNVMissense_Mutationrs143577888c.853N>Ap.Asp285Asnp.D285NP23469protein_codingtolerated(0.57)benign(0.201)TCGA-EW-A1J5-01Breastbreast invasive carcinomaFemale<65I/IIChemotherapyadriamycinSD
PTPRESNVMissense_Mutationnovelc.708N>Cp.Leu236Phep.L236FP23469protein_codingdeleterious(0)possibly_damaging(0.761)TCGA-C5-A7X5-01Cervixcervical & endocervical cancerFemale>=65I/IIChemotherapycarboplatinPD
PTPRESNVMissense_Mutationnovelc.193G>Cp.Ala65Prop.A65PP23469protein_codingdeleterious(0.02)benign(0.21)TCGA-VS-A8EK-01Cervixcervical & endocervical cancerFemale>=65I/IIChemotherapycisplatinPD
Page: 1 2 3 4 5 6 7 8 9 10 

Top

Related drugs of malignant transformation related genes

check buttonIdentification of chemicals and drugs interact with genes involved in malignant transfromation
(DGIdb 4.0)
Entrez IDSymbolCategoryInteraction TypesDrug Claim NameDrug NamePMIDs
Page: 1