
|
|||||
|
 | |
| |
| |
| |
| |
| |
|
Gene: PTPRC |
Gene summary for PTPRC |
| Gene information | Species | Human | Gene symbol | PTPRC | Gene ID | 5788 |
| Gene name | protein tyrosine phosphatase receptor type C | |
| Gene Alias | B220 | |
| Cytomap | 1q31.3-q32.1 | |
| Gene Type | protein-coding | GO ID | GO:0000018 | UniProtAcc | M9MML4 |
Top |
Malignant transformation analysis |
| Identification of the aberrant gene expression in precancerous and cancerous lesions by comparing the gene expression of stem-like cells in diseased tissues with normal stem cells |
| Entrez ID | Symbol | Replicates | Species | Organ | Tissue | Adj P-value | Log2FC | Malignancy |
| 5788 | PTPRC | GSM4909317 | Human | Breast | IDC | 1.75e-04 | 1.71e-01 | 0.1355 |
| 5788 | PTPRC | M1 | Human | Breast | IDC | 1.22e-54 | 1.03e+00 | 0.1577 |
| 5788 | PTPRC | NCCBC3 | Human | Breast | DCIS | 5.98e-07 | 4.41e-01 | 0.1198 |
| 5788 | PTPRC | P1 | Human | Breast | IDC | 1.49e-16 | 8.31e-01 | 0.1527 |
| 5788 | PTPRC | CA_HPV_1 | Human | Cervix | CC | 1.01e-09 | 4.82e-01 | 0.0264 |
| 5788 | PTPRC | HSIL_HPV_1 | Human | Cervix | HSIL_HPV | 1.68e-07 | 4.65e-01 | 0.0116 |
| 5788 | PTPRC | HSIL_HPV_2 | Human | Cervix | HSIL_HPV | 2.18e-03 | 2.62e-01 | 0.0208 |
| 5788 | PTPRC | N_HPV_2 | Human | Cervix | N_HPV | 9.41e-04 | 3.92e-01 | -0.0131 |
| 5788 | PTPRC | CCI_1 | Human | Cervix | CC | 1.00e-05 | -7.16e-01 | 0.528 |
| 5788 | PTPRC | CCII_1 | Human | Cervix | CC | 3.87e-17 | -7.57e-01 | 0.3249 |
| 5788 | PTPRC | Tumor | Human | Cervix | CC | 1.41e-43 | -7.57e-01 | 0.1241 |
| 5788 | PTPRC | sample1 | Human | Cervix | CC | 4.31e-10 | -7.15e-01 | 0.0959 |
| 5788 | PTPRC | sample3 | Human | Cervix | CC | 5.89e-36 | -7.42e-01 | 0.1387 |
| 5788 | PTPRC | H2 | Human | Cervix | HSIL_HPV | 3.16e-22 | -6.29e-01 | 0.0632 |
| 5788 | PTPRC | L1 | Human | Cervix | CC | 5.43e-11 | -6.65e-01 | 0.0802 |
| 5788 | PTPRC | T1 | Human | Cervix | CC | 1.15e-24 | -7.33e-01 | 0.0918 |
| 5788 | PTPRC | T2 | Human | Cervix | CC | 2.75e-05 | -7.24e-01 | 0.0709 |
| 5788 | PTPRC | T3 | Human | Cervix | CC | 5.48e-39 | -7.53e-01 | 0.1389 |
| 5788 | PTPRC | LZE4T | Human | Esophagus | ESCC | 8.30e-18 | 9.53e-01 | 0.0811 |
| 5788 | PTPRC | LZE7T | Human | Esophagus | ESCC | 1.53e-13 | 1.11e+00 | 0.0667 |
| Page: 1 2 3 |
| Tissue | Expression Dynamics | Abbreviation |
| Breast | 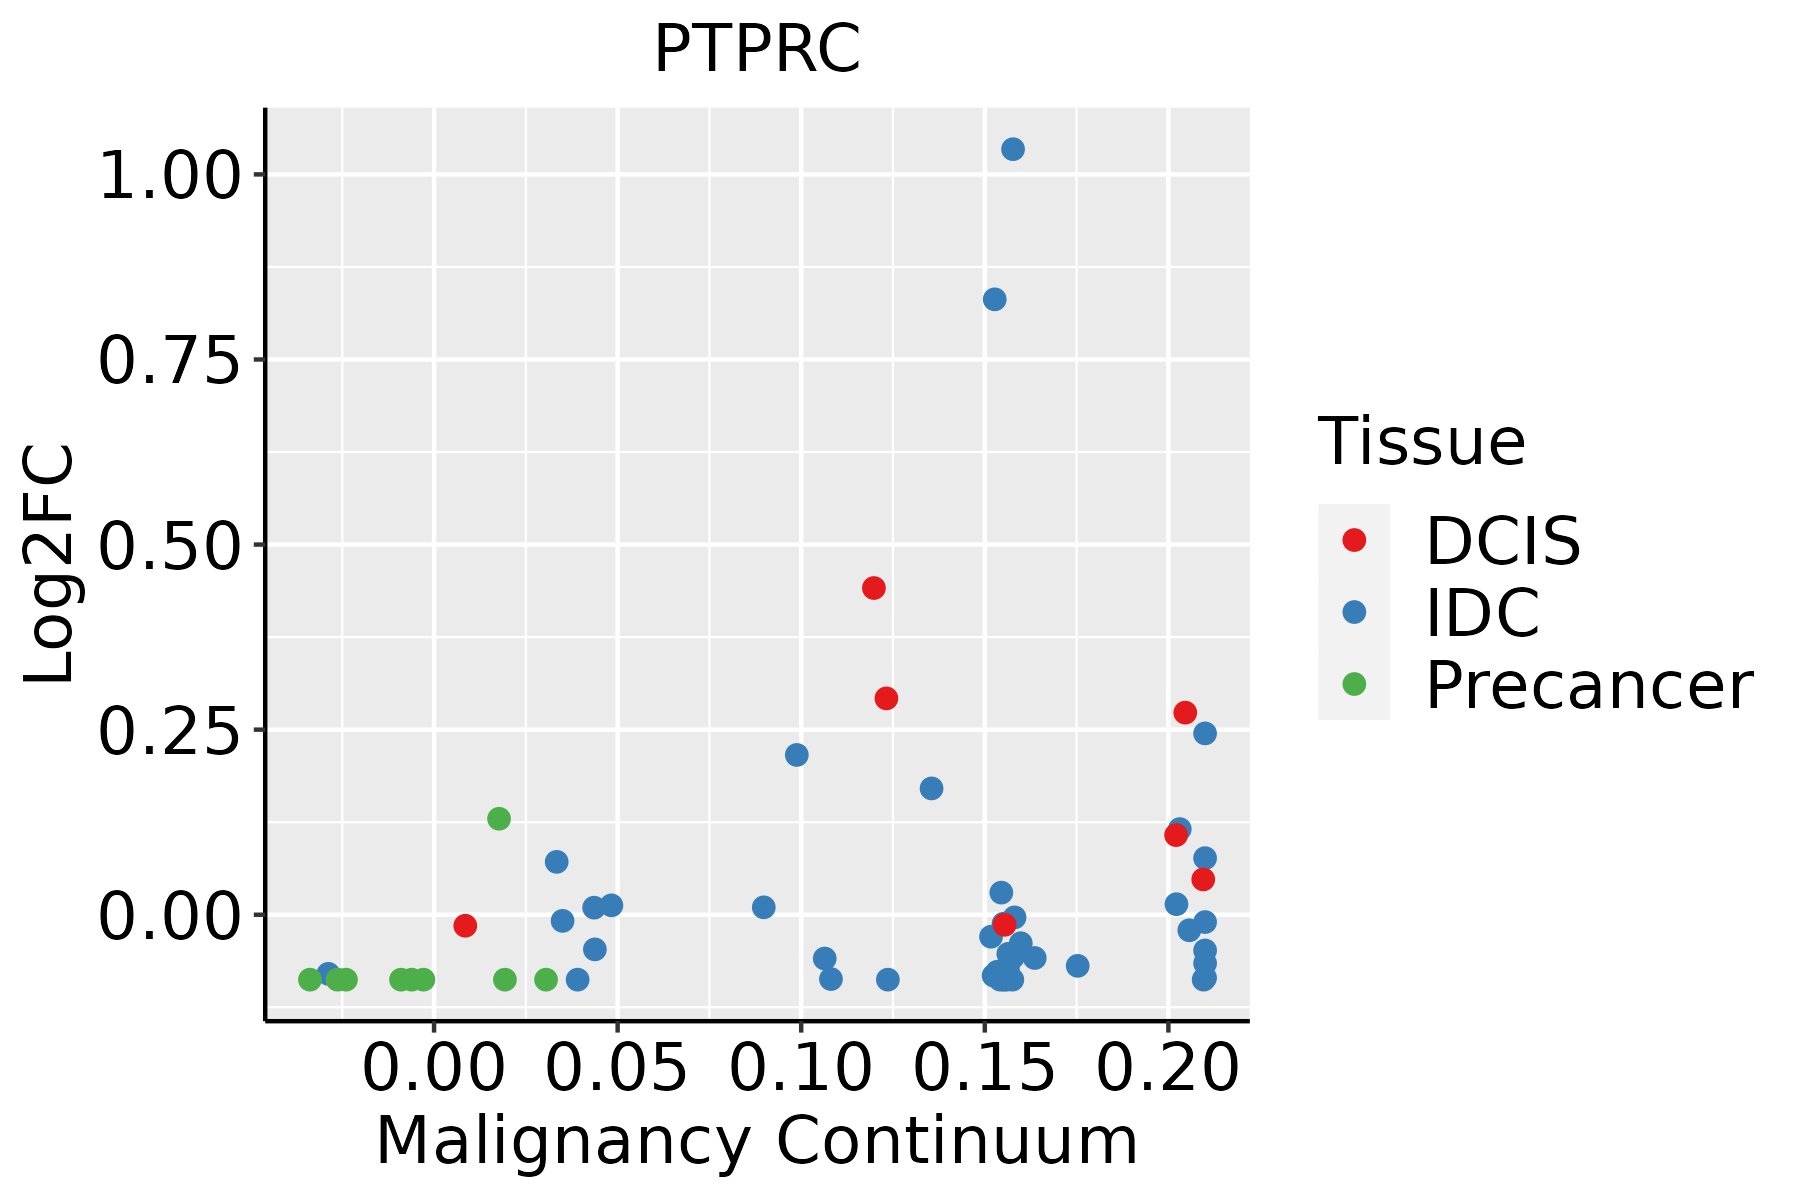 | IDC: Invasive ductal carcinoma |
| DCIS: Ductal carcinoma in situ | ||
| Precancer(BRCA1-mut): Precancerous lesion from BRCA1 mutation carriers | ||
| Cervix | 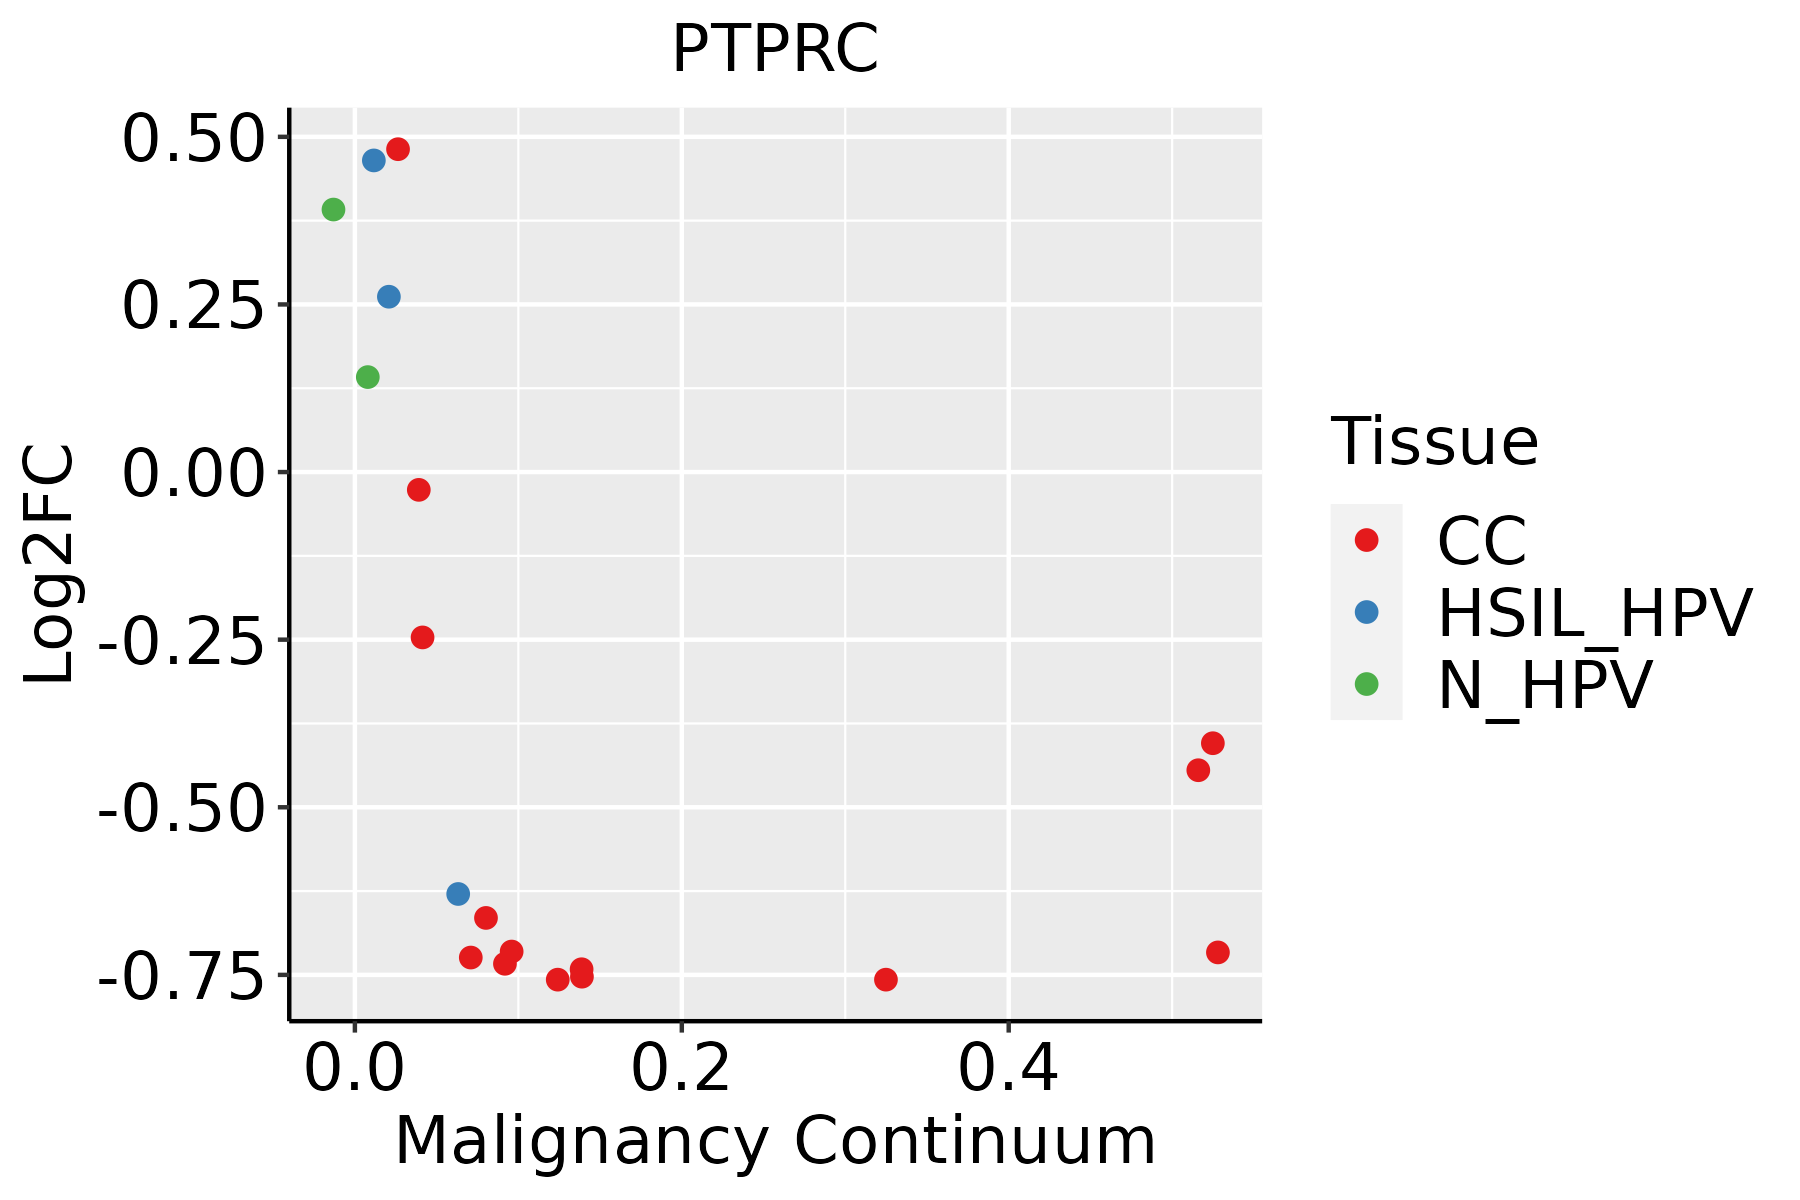 | CC: Cervix cancer |
| HSIL_HPV: HPV-infected high-grade squamous intraepithelial lesions | ||
| N_HPV: HPV-infected normal cervix | ||
| Esophagus |  | ESCC: Esophageal squamous cell carcinoma |
| HGIN: High-grade intraepithelial neoplasias | ||
| LGIN: Low-grade intraepithelial neoplasias | ||
| Oral Cavity | 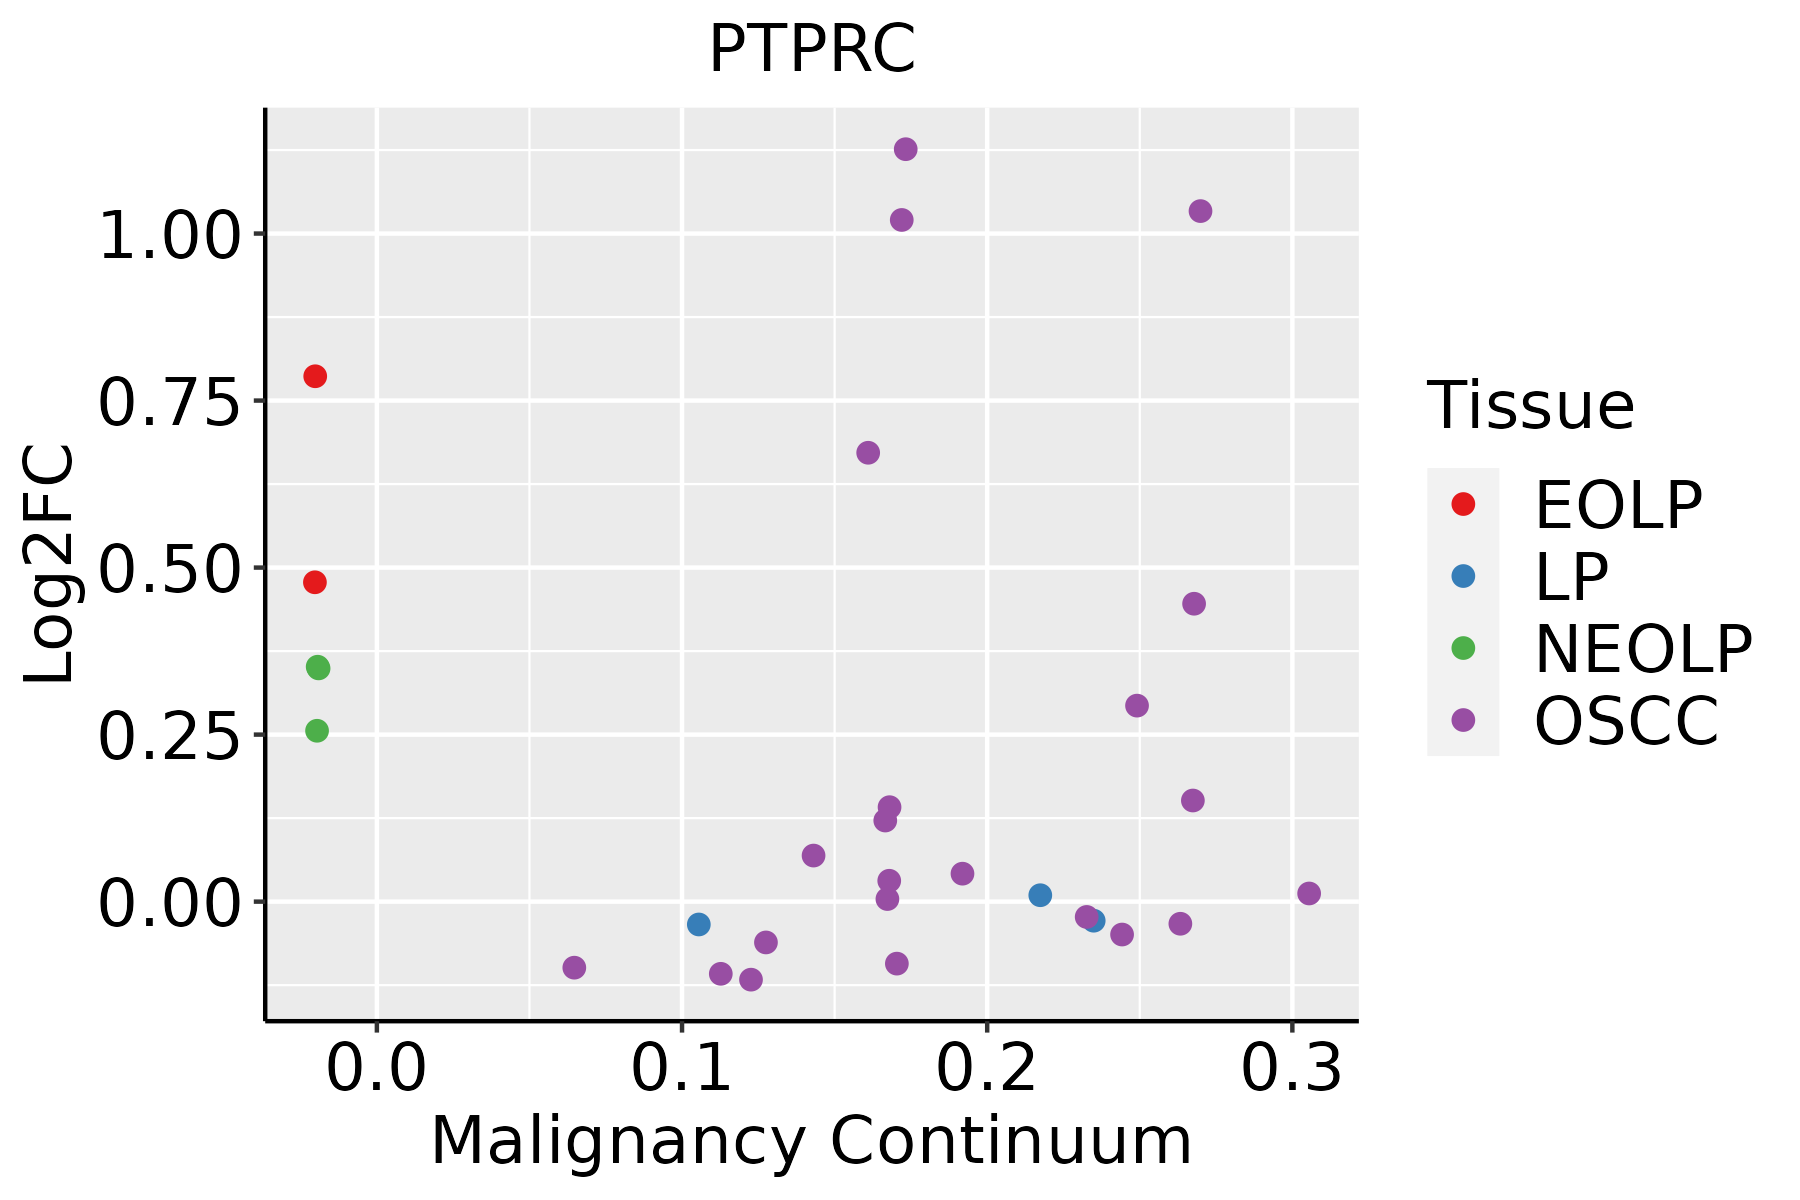 | EOLP: Erosive Oral lichen planus |
| LP: leukoplakia | ||
| NEOLP: Non-erosive oral lichen planus | ||
| OSCC: Oral squamous cell carcinoma | ||
| Prostate |  | BPH: Benign Prostatic Hyperplasia |
| ∗log2FC in expression of this searched gene in stem-like cells from each diseased tissue sample relative to stem-like cells in normal samples in each tissue plotted against the malignancy continuum. Samples are colored based on if they are from different disease stage. |
Top |
Malignant transformation related pathway analysis |
| Find out the enriched GO biological processes and KEGG pathways involved in transition from healthy to precancer to cancer |
| Tissue | Disease Stage | Enriched GO biological Processes |
| Colorectum | AD |  |
| Colorectum | SER |  |
| Colorectum | MSS |  |
| Colorectum | MSI-H |  |
| Colorectum | FAP |  |
| ∗Top 15 enriched GO BP terms are showed in the bar plot of each disease state in each tissue. Each row represents a significant GO biological process which is colored according to the -log10(p.adjust). |
| Page: 1 2 3 4 5 6 7 8 9 |
| GO ID | Tissue | Disease Stage | Description | Gene Ratio | Bg Ratio | pvalue | p.adjust | Count |
| GO:200123314 | Breast | IDC | regulation of apoptotic signaling pathway | 82/1434 | 356/18723 | 6.27e-20 | 5.93e-17 | 82 |
| GO:200123514 | Breast | IDC | positive regulation of apoptotic signaling pathway | 31/1434 | 126/18723 | 4.13e-09 | 3.35e-07 | 31 |
| GO:009719114 | Breast | IDC | extrinsic apoptotic signaling pathway | 42/1434 | 219/18723 | 2.56e-08 | 1.73e-06 | 42 |
| GO:200123614 | Breast | IDC | regulation of extrinsic apoptotic signaling pathway | 32/1434 | 151/18723 | 1.07e-07 | 6.26e-06 | 32 |
| GO:004578514 | Breast | IDC | positive regulation of cell adhesion | 62/1434 | 437/18723 | 1.70e-06 | 7.16e-05 | 62 |
| GO:005165114 | Breast | IDC | maintenance of location in cell | 37/1434 | 214/18723 | 2.39e-06 | 9.35e-05 | 37 |
| GO:001033211 | Breast | IDC | response to gamma radiation | 16/1434 | 56/18723 | 2.84e-06 | 1.08e-04 | 16 |
| GO:001021213 | Breast | IDC | response to ionizing radiation | 28/1434 | 148/18723 | 6.85e-06 | 2.09e-04 | 28 |
| GO:000931412 | Breast | IDC | response to radiation | 62/1434 | 456/18723 | 6.91e-06 | 2.10e-04 | 62 |
| GO:005123513 | Breast | IDC | maintenance of location | 48/1434 | 327/18723 | 9.90e-06 | 2.77e-04 | 48 |
| GO:004211012 | Breast | IDC | T cell activation | 64/1434 | 487/18723 | 1.49e-05 | 3.77e-04 | 64 |
| GO:005086311 | Breast | IDC | regulation of T cell activation | 47/1434 | 329/18723 | 2.49e-05 | 5.91e-04 | 47 |
| GO:000181911 | Breast | IDC | positive regulation of cytokine production | 61/1434 | 467/18723 | 2.81e-05 | 6.58e-04 | 61 |
| GO:005087011 | Breast | IDC | positive regulation of T cell activation | 34/1434 | 216/18723 | 4.59e-05 | 1.03e-03 | 34 |
| GO:007149614 | Breast | IDC | cellular response to external stimulus | 45/1434 | 320/18723 | 5.40e-05 | 1.15e-03 | 45 |
| GO:005134814 | Breast | IDC | negative regulation of transferase activity | 39/1434 | 268/18723 | 7.89e-05 | 1.56e-03 | 39 |
| GO:190370612 | Breast | IDC | regulation of hemopoiesis | 49/1434 | 367/18723 | 9.74e-05 | 1.86e-03 | 49 |
| GO:000715912 | Breast | IDC | leukocyte cell-cell adhesion | 49/1434 | 371/18723 | 1.27e-04 | 2.33e-03 | 49 |
| GO:003530414 | Breast | IDC | regulation of protein dephosphorylation | 18/1434 | 90/18723 | 1.39e-04 | 2.48e-03 | 18 |
| GO:000268311 | Breast | IDC | negative regulation of immune system process | 55/1434 | 434/18723 | 1.53e-04 | 2.67e-03 | 55 |
| Page: 1 2 3 4 5 6 7 8 9 10 11 12 13 14 15 16 17 18 19 20 21 22 23 24 25 26 27 28 29 30 31 32 33 34 35 36 37 38 39 40 41 42 43 44 45 46 47 48 49 50 51 52 53 54 55 |
| Pathway ID | Tissue | Disease Stage | Description | Gene Ratio | Bg Ratio | pvalue | p.adjust | qvalue | Count |
| hsa0513243 | Breast | DCIS | Salmonella infection | 55/846 | 249/8465 | 8.71e-09 | 1.87e-07 | 1.38e-07 | 55 |
| hsa0513253 | Breast | DCIS | Salmonella infection | 55/846 | 249/8465 | 8.71e-09 | 1.87e-07 | 1.38e-07 | 55 |
| hsa0513220 | Cervix | CC | Salmonella infection | 74/1267 | 249/8465 | 1.33e-09 | 2.54e-08 | 1.50e-08 | 74 |
| hsa0466612 | Cervix | CC | Fc gamma R-mediated phagocytosis | 31/1267 | 97/8465 | 1.78e-05 | 1.42e-04 | 8.40e-05 | 31 |
| hsa045147 | Cervix | CC | Cell adhesion molecules | 36/1267 | 157/8465 | 4.94e-03 | 1.67e-02 | 9.86e-03 | 36 |
| hsa046604 | Cervix | CC | T cell receptor signaling pathway | 25/1267 | 104/8465 | 9.52e-03 | 2.94e-02 | 1.74e-02 | 25 |
| hsa05132110 | Cervix | CC | Salmonella infection | 74/1267 | 249/8465 | 1.33e-09 | 2.54e-08 | 1.50e-08 | 74 |
| hsa0466613 | Cervix | CC | Fc gamma R-mediated phagocytosis | 31/1267 | 97/8465 | 1.78e-05 | 1.42e-04 | 8.40e-05 | 31 |
| hsa0451412 | Cervix | CC | Cell adhesion molecules | 36/1267 | 157/8465 | 4.94e-03 | 1.67e-02 | 9.86e-03 | 36 |
| hsa0466011 | Cervix | CC | T cell receptor signaling pathway | 25/1267 | 104/8465 | 9.52e-03 | 2.94e-02 | 1.74e-02 | 25 |
| hsa0513225 | Cervix | HSIL_HPV | Salmonella infection | 34/459 | 249/8465 | 5.03e-07 | 1.13e-05 | 9.17e-06 | 34 |
| hsa0451421 | Cervix | HSIL_HPV | Cell adhesion molecules | 20/459 | 157/8465 | 3.03e-04 | 3.06e-03 | 2.47e-03 | 20 |
| hsa0513235 | Cervix | HSIL_HPV | Salmonella infection | 34/459 | 249/8465 | 5.03e-07 | 1.13e-05 | 9.17e-06 | 34 |
| hsa0451431 | Cervix | HSIL_HPV | Cell adhesion molecules | 20/459 | 157/8465 | 3.03e-04 | 3.06e-03 | 2.47e-03 | 20 |
| hsa0513244 | Cervix | N_HPV | Salmonella infection | 28/349 | 249/8465 | 1.18e-06 | 1.64e-05 | 1.28e-05 | 28 |
| hsa0513254 | Cervix | N_HPV | Salmonella infection | 28/349 | 249/8465 | 1.18e-06 | 1.64e-05 | 1.28e-05 | 28 |
| hsa05132211 | Esophagus | ESCC | Salmonella infection | 191/4205 | 249/8465 | 6.51e-19 | 5.45e-17 | 2.79e-17 | 191 |
| hsa0466620 | Esophagus | ESCC | Fc gamma R-mediated phagocytosis | 63/4205 | 97/8465 | 1.63e-03 | 4.89e-03 | 2.50e-03 | 63 |
| hsa046607 | Esophagus | ESCC | T cell receptor signaling pathway | 63/4205 | 104/8465 | 1.60e-02 | 3.60e-02 | 1.84e-02 | 63 |
| hsa05132310 | Esophagus | ESCC | Salmonella infection | 191/4205 | 249/8465 | 6.51e-19 | 5.45e-17 | 2.79e-17 | 191 |
| Page: 1 2 3 |
Top |
Cell-cell communication analysis |
| Identification of potential cell-cell interactions between two cell types and their ligand-receptor pairs for different disease states |
| Ligand | Receptor | LRpair | Pathway | Tissue | Disease Stage |
| LGALS9 | PTPRC | LGALS9_CD45 | GALECTIN | Breast | ADJ |
| LGALS9 | PTPRC | LGALS9_CD45 | GALECTIN | Breast | DCIS |
| PTPRC | CD22 | PTPRC_CD22 | CD45 | Breast | DCIS |
| PTPRC | MRC1 | PTPRC_MRC1 | CD45 | Breast | DCIS |
| CD22 | PTPRC | CD22_PTPRC | CD22 | Breast | DCIS |
| LGALS9 | PTPRC | LGALS9_CD45 | GALECTIN | Breast | Healthy |
| PTPRC | MRC1 | PTPRC_MRC1 | CD45 | Breast | Healthy |
| PTPRC | CD22 | PTPRC_CD22 | CD45 | Breast | IDC |
| PTPRC | MRC1 | PTPRC_MRC1 | CD45 | Breast | IDC |
| LGALS9 | PTPRC | LGALS9_CD45 | GALECTIN | Breast | IDC |
| CD22 | PTPRC | CD22_PTPRC | CD22 | Breast | IDC |
| PTPRC | CD22 | PTPRC_CD22 | CD45 | Cervix | ADJ |
| PTPRC | MRC1 | PTPRC_MRC1 | CD45 | Cervix | ADJ |
| LGALS9 | PTPRC | LGALS9_CD45 | GALECTIN | Cervix | ADJ |
| CD22 | PTPRC | CD22_PTPRC | CD22 | Cervix | ADJ |
| LGALS9 | PTPRC | LGALS9_CD45 | GALECTIN | Cervix | CC |
| PTPRC | CD22 | PTPRC_CD22 | CD45 | Cervix | CC |
| PTPRC | MRC1 | PTPRC_MRC1 | CD45 | Cervix | CC |
| CD22 | PTPRC | CD22_PTPRC | CD22 | Cervix | CC |
| CD22 | PTPRC | CD22_PTPRC | CD22 | Cervix | Healthy |
| Page: 1 2 3 4 |
Top |
Single-cell gene regulatory network inference analysis |
| Find out the significant the regulons (TFs) and the target genes of each regulon across cell types for different disease states |
| TF | Cell Type | Tissue | Disease Stage | Target Gene | RSS | Regulon Activity |
| ∗The dot plots of a searched regulon are shown for all cell subpopulations in each disease state of each tissue based on the regulon specific score inferred using pySCENIC and by calculating the average expression. |
| Page: 1 |
Top |
Somatic mutation of malignant transformation related genes |
| Annotation of somatic variants for genes involved in malignant transformation |
| Hugo Symbol | Variant Class | Variant Classification | dbSNP RS | HGVSc | HGVSp | HGVSp Short | SWISSPROT | BIOTYPE | SIFT | PolyPhen | Tumor Sample Barcode | Tissue | Histology | Sex | Age | Stage | Therapy Types | Drugs | Outcome |
| PTPRC | SNV | Missense_Mutation | c.794N>A | p.Cys265Tyr | p.C265Y | protein_coding | tolerated(0.08) | possibly_damaging(0.9) | TCGA-A8-A09Z-01 | Breast | breast invasive carcinoma | Female | >=65 | I/II | Unknown | Unknown | SD | ||
| PTPRC | SNV | Missense_Mutation | c.2299N>T | p.Pro767Ser | p.P767S | protein_coding | deleterious(0) | probably_damaging(1) | TCGA-A8-A09Z-01 | Breast | breast invasive carcinoma | Female | >=65 | I/II | Unknown | Unknown | SD | ||
| PTPRC | SNV | Missense_Mutation | c.448N>A | p.Gly150Arg | p.G150R | protein_coding | tolerated(0.11) | possibly_damaging(0.486) | TCGA-AC-A2FM-01 | Breast | breast invasive carcinoma | Female | >=65 | I/II | Unknown | Unknown | PD | ||
| PTPRC | SNV | Missense_Mutation | novel | c.977A>C | p.Lys326Thr | p.K326T | protein_coding | tolerated(0.35) | benign(0.003) | TCGA-AN-A046-01 | Breast | breast invasive carcinoma | Female | >=65 | I/II | Unknown | Unknown | SD | |
| PTPRC | SNV | Missense_Mutation | novel | c.319N>T | p.Pro107Ser | p.P107S | protein_coding | tolerated(0.07) | benign(0.015) | TCGA-AN-A04C-01 | Breast | breast invasive carcinoma | Female | <65 | I/II | Unknown | Unknown | SD | |
| PTPRC | SNV | Missense_Mutation | c.1538N>A | p.Gly513Asp | p.G513D | protein_coding | deleterious(0) | probably_damaging(1) | TCGA-AO-A128-01 | Breast | breast invasive carcinoma | Female | <65 | I/II | Chemotherapy | doxorubicin | SD | ||
| PTPRC | SNV | Missense_Mutation | rs758824419 | c.2695N>A | p.Glu899Lys | p.E899K | protein_coding | deleterious(0.02) | probably_damaging(0.999) | TCGA-BH-A18P-01 | Breast | breast invasive carcinoma | Female | <65 | I/II | Unknown | Unknown | PD | |
| PTPRC | SNV | Missense_Mutation | novel | c.2476N>C | p.Glu826Gln | p.E826Q | protein_coding | deleterious(0.01) | possibly_damaging(0.669) | TCGA-C8-A8HP-01 | Breast | breast invasive carcinoma | Female | <65 | III/IV | Chemotherapy | 5-fluorouracil | CR | |
| PTPRC | SNV | Missense_Mutation | c.3337N>A | p.Asp1113Asn | p.D1113N | protein_coding | deleterious(0) | possibly_damaging(0.88) | TCGA-E2-A1LH-01 | Breast | breast invasive carcinoma | Female | <65 | I/II | Chemotherapy | adriamycin | SD | ||
| PTPRC | SNV | Missense_Mutation | c.308N>T | p.Ser103Leu | p.S103L | protein_coding | tolerated(0.73) | benign(0.084) | TCGA-E9-A1R4-01 | Breast | breast invasive carcinoma | Female | >=65 | I/II | Chemotherapy | 5-fluorouracil | SD |
| Page: 1 2 3 4 5 6 7 8 9 10 11 12 13 14 15 16 17 18 19 20 21 22 23 24 |
Top |
Related drugs of malignant transformation related genes |
| Identification of chemicals and drugs interact with genes involved in malignant transfromation |
| (DGIdb 4.0) |
| Entrez ID | Symbol | Category | Interaction Types | Drug Claim Name | Drug Name | PMIDs |
| 5788 | PTPRC | CLINICALLY ACTIONABLE, TUMOR SUPPRESSOR, EXTERNAL SIDE OF PLASMA MEMBRANE, CELL SURFACE, DRUGGABLE GENOME, PROTEIN PHOSPHATASE, KINASE | [131I]-BC8 | |||
| 5788 | PTPRC | CLINICALLY ACTIONABLE, TUMOR SUPPRESSOR, EXTERNAL SIDE OF PLASMA MEMBRANE, CELL SURFACE, DRUGGABLE GENOME, PROTEIN PHOSPHATASE, KINASE | HYDROGEN PEROXIDE | HYDROGEN PEROXIDE | 15012988 | |
| 5788 | PTPRC | CLINICALLY ACTIONABLE, TUMOR SUPPRESSOR, EXTERNAL SIDE OF PLASMA MEMBRANE, CELL SURFACE, DRUGGABLE GENOME, PROTEIN PHOSPHATASE, KINASE | PREDNISONE | PREDNISONE | 17063711 | |
| 5788 | PTPRC | CLINICALLY ACTIONABLE, TUMOR SUPPRESSOR, EXTERNAL SIDE OF PLASMA MEMBRANE, CELL SURFACE, DRUGGABLE GENOME, PROTEIN PHOSPHATASE, KINASE | ERYTHROPOIETIN | EPOETIN BETA | 1713254 | |
| 5788 | PTPRC | CLINICALLY ACTIONABLE, TUMOR SUPPRESSOR, EXTERNAL SIDE OF PLASMA MEMBRANE, CELL SURFACE, DRUGGABLE GENOME, PROTEIN PHOSPHATASE, KINASE | GM-CSF/IL-3 FUSION PROTEIN | 1713254 | ||
| 5788 | PTPRC | CLINICALLY ACTIONABLE, TUMOR SUPPRESSOR, EXTERNAL SIDE OF PLASMA MEMBRANE, CELL SURFACE, DRUGGABLE GENOME, PROTEIN PHOSPHATASE, KINASE | etanercept | ETANERCEPT | 20309874,23007924 | |
| 5788 | PTPRC | CLINICALLY ACTIONABLE, TUMOR SUPPRESSOR, EXTERNAL SIDE OF PLASMA MEMBRANE, CELL SURFACE, DRUGGABLE GENOME, PROTEIN PHOSPHATASE, KINASE | VACCINE | 12007880 | ||
| 5788 | PTPRC | CLINICALLY ACTIONABLE, TUMOR SUPPRESSOR, EXTERNAL SIDE OF PLASMA MEMBRANE, CELL SURFACE, DRUGGABLE GENOME, PROTEIN PHOSPHATASE, KINASE | adalimumab | ADALIMUMAB | 20309874,23007924 | |
| 5788 | PTPRC | CLINICALLY ACTIONABLE, TUMOR SUPPRESSOR, EXTERNAL SIDE OF PLASMA MEMBRANE, CELL SURFACE, DRUGGABLE GENOME, PROTEIN PHOSPHATASE, KINASE | PROTEIN KINASE INHIBITOR | 9473774 | ||
| 5788 | PTPRC | CLINICALLY ACTIONABLE, TUMOR SUPPRESSOR, EXTERNAL SIDE OF PLASMA MEMBRANE, CELL SURFACE, DRUGGABLE GENOME, PROTEIN PHOSPHATASE, KINASE | LM-CD45 |
| Page: 1 2 3 |

Copyright 2023-Present -The University of Texas Health Science Center at Houston |