| Tissue | Expression Dynamics | Abbreviation |
| Cervix | 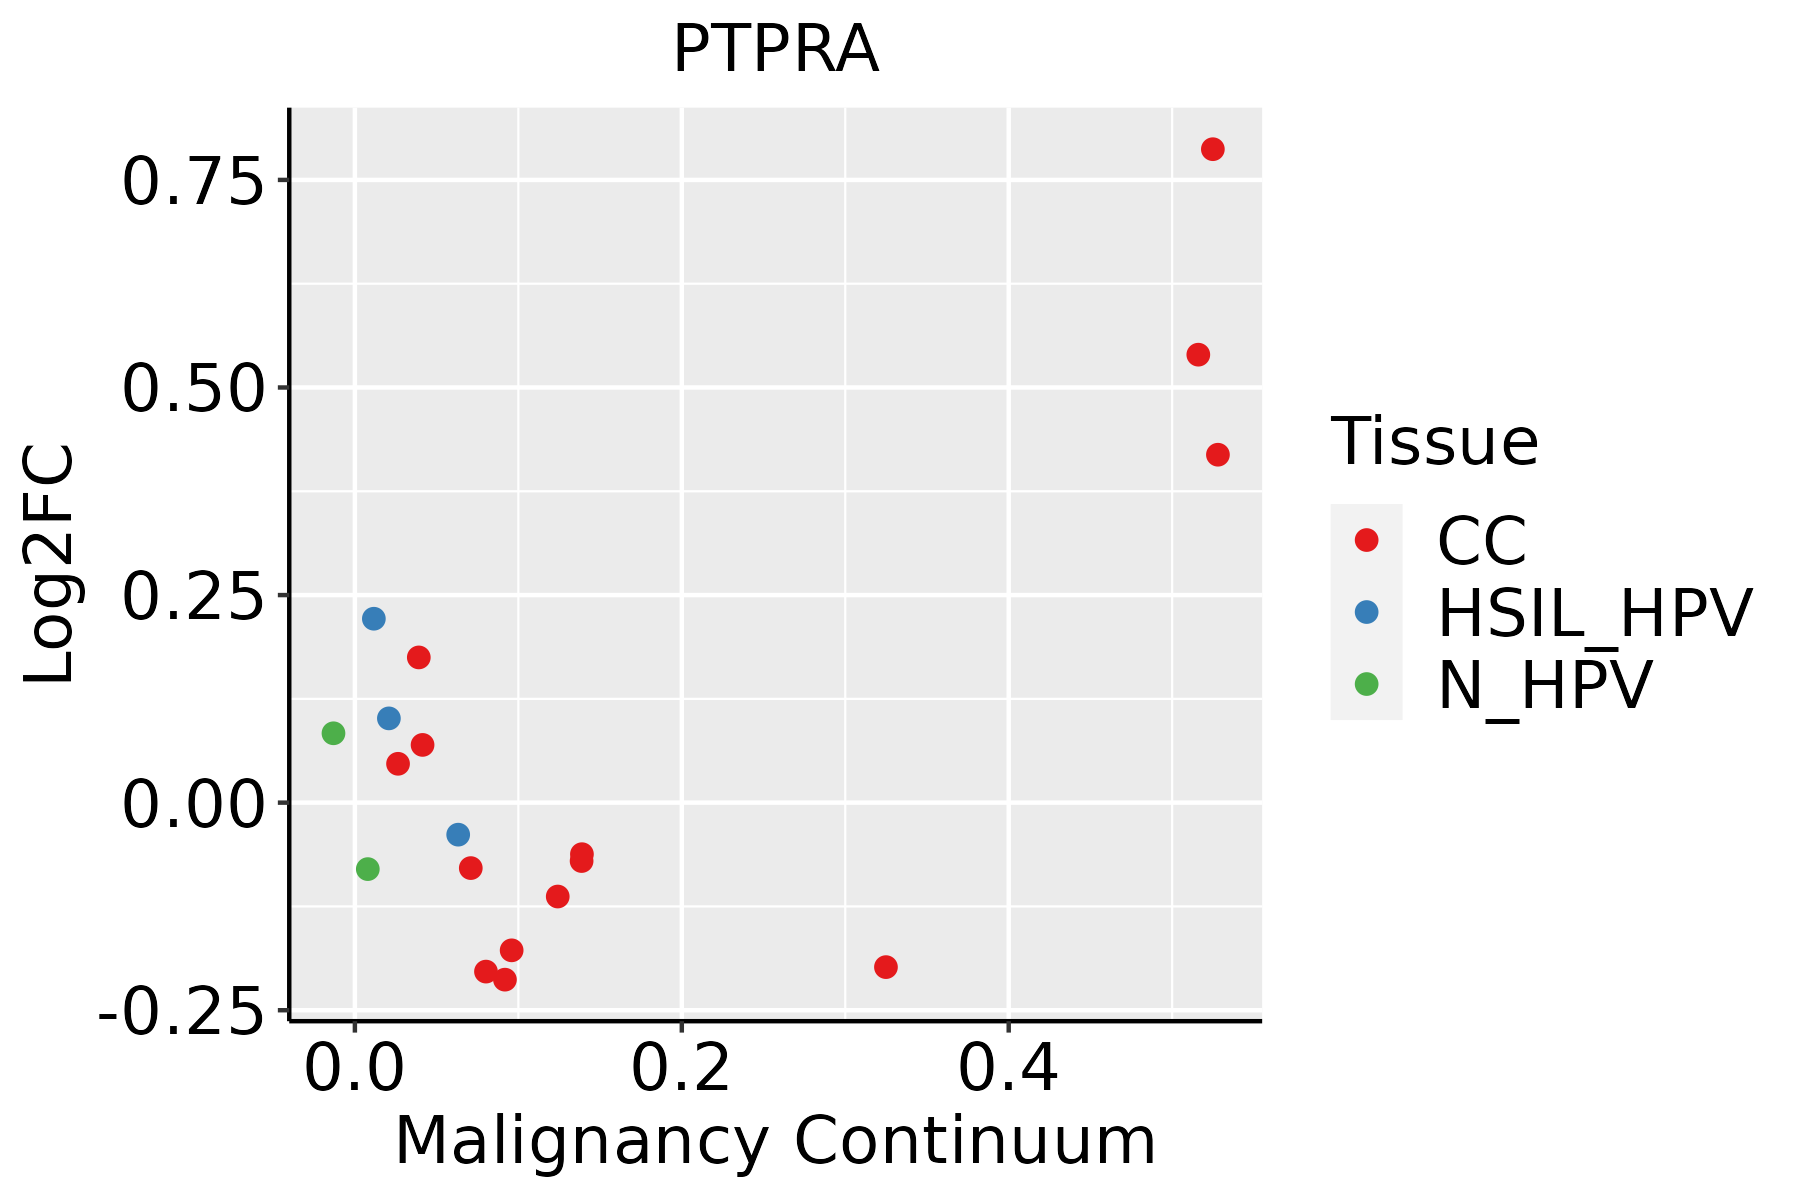 | CC: Cervix cancer |
| HSIL_HPV: HPV-infected high-grade squamous intraepithelial lesions |
| N_HPV: HPV-infected normal cervix |
| Esophagus | 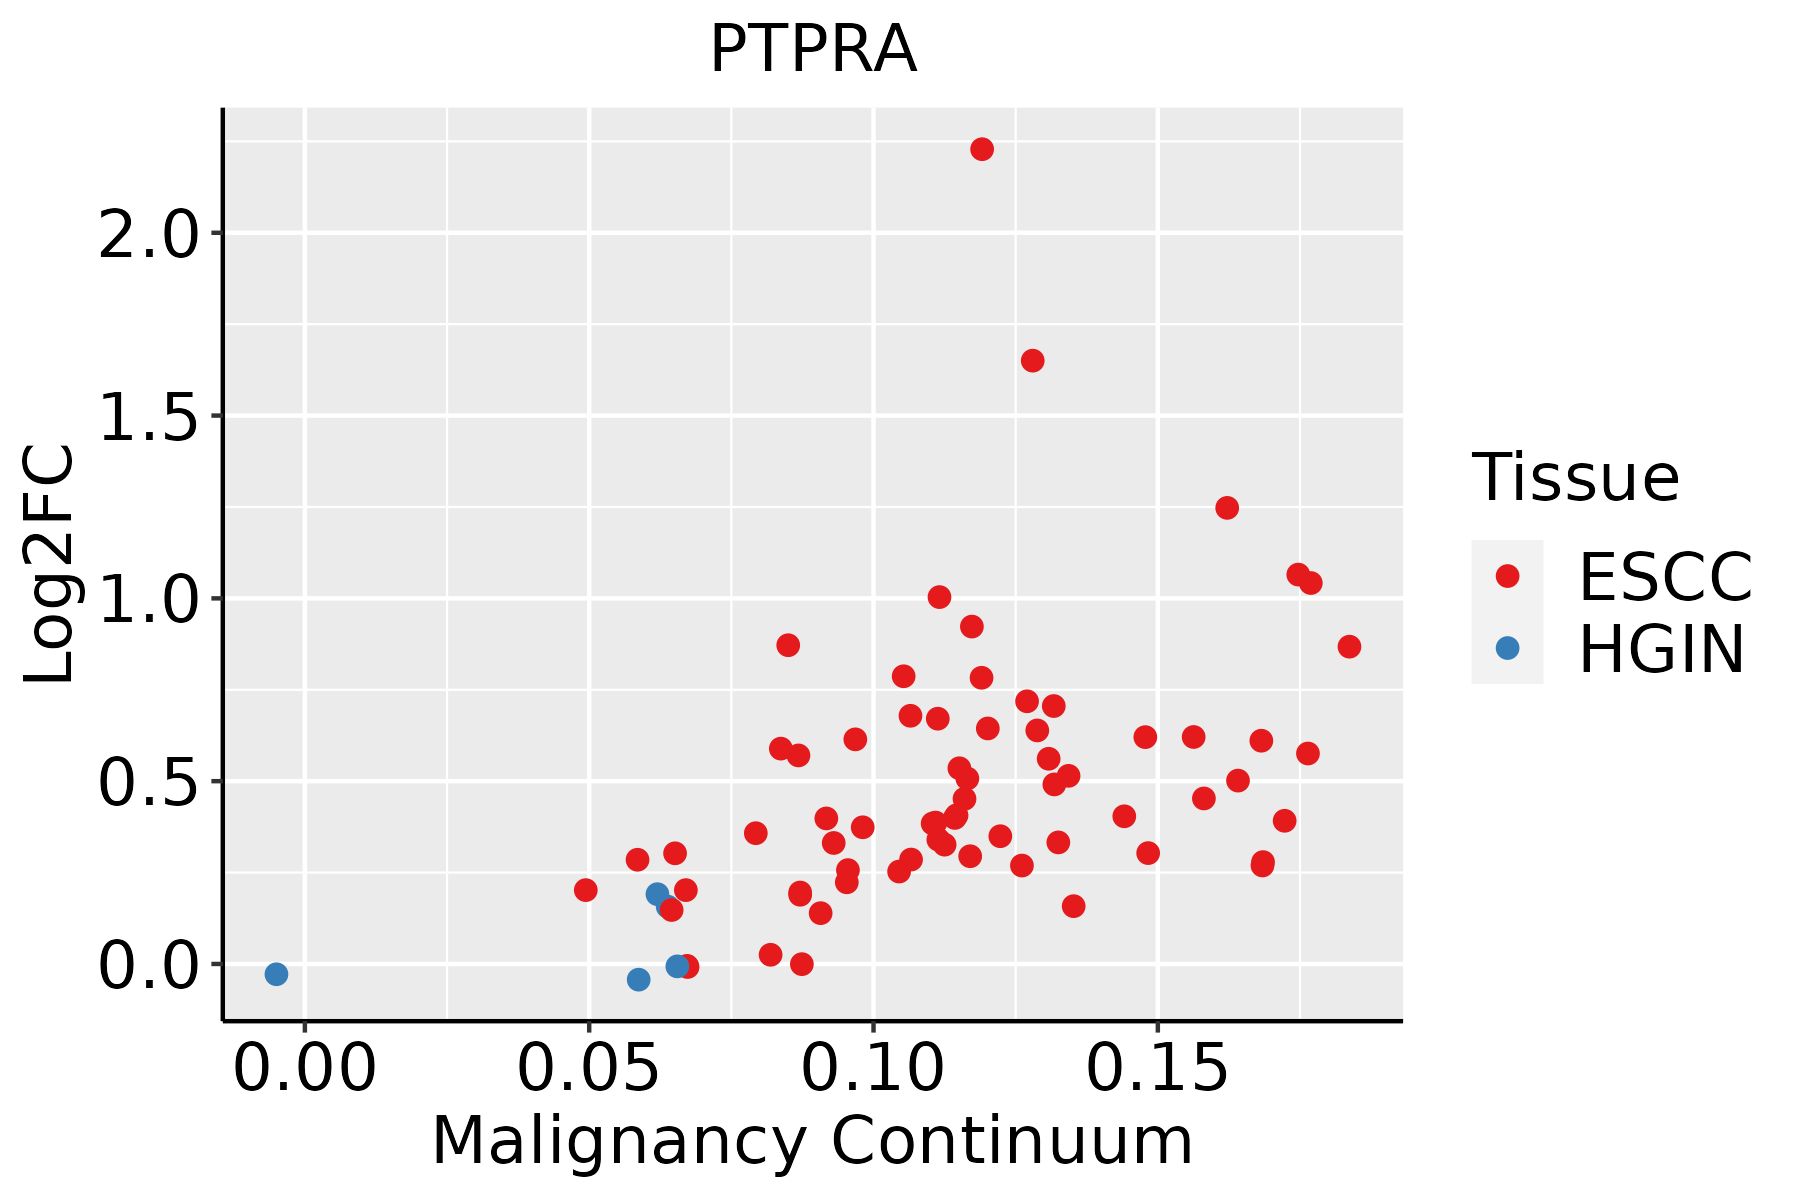 | ESCC: Esophageal squamous cell carcinoma |
| HGIN: High-grade intraepithelial neoplasias |
| LGIN: Low-grade intraepithelial neoplasias |
| Liver | 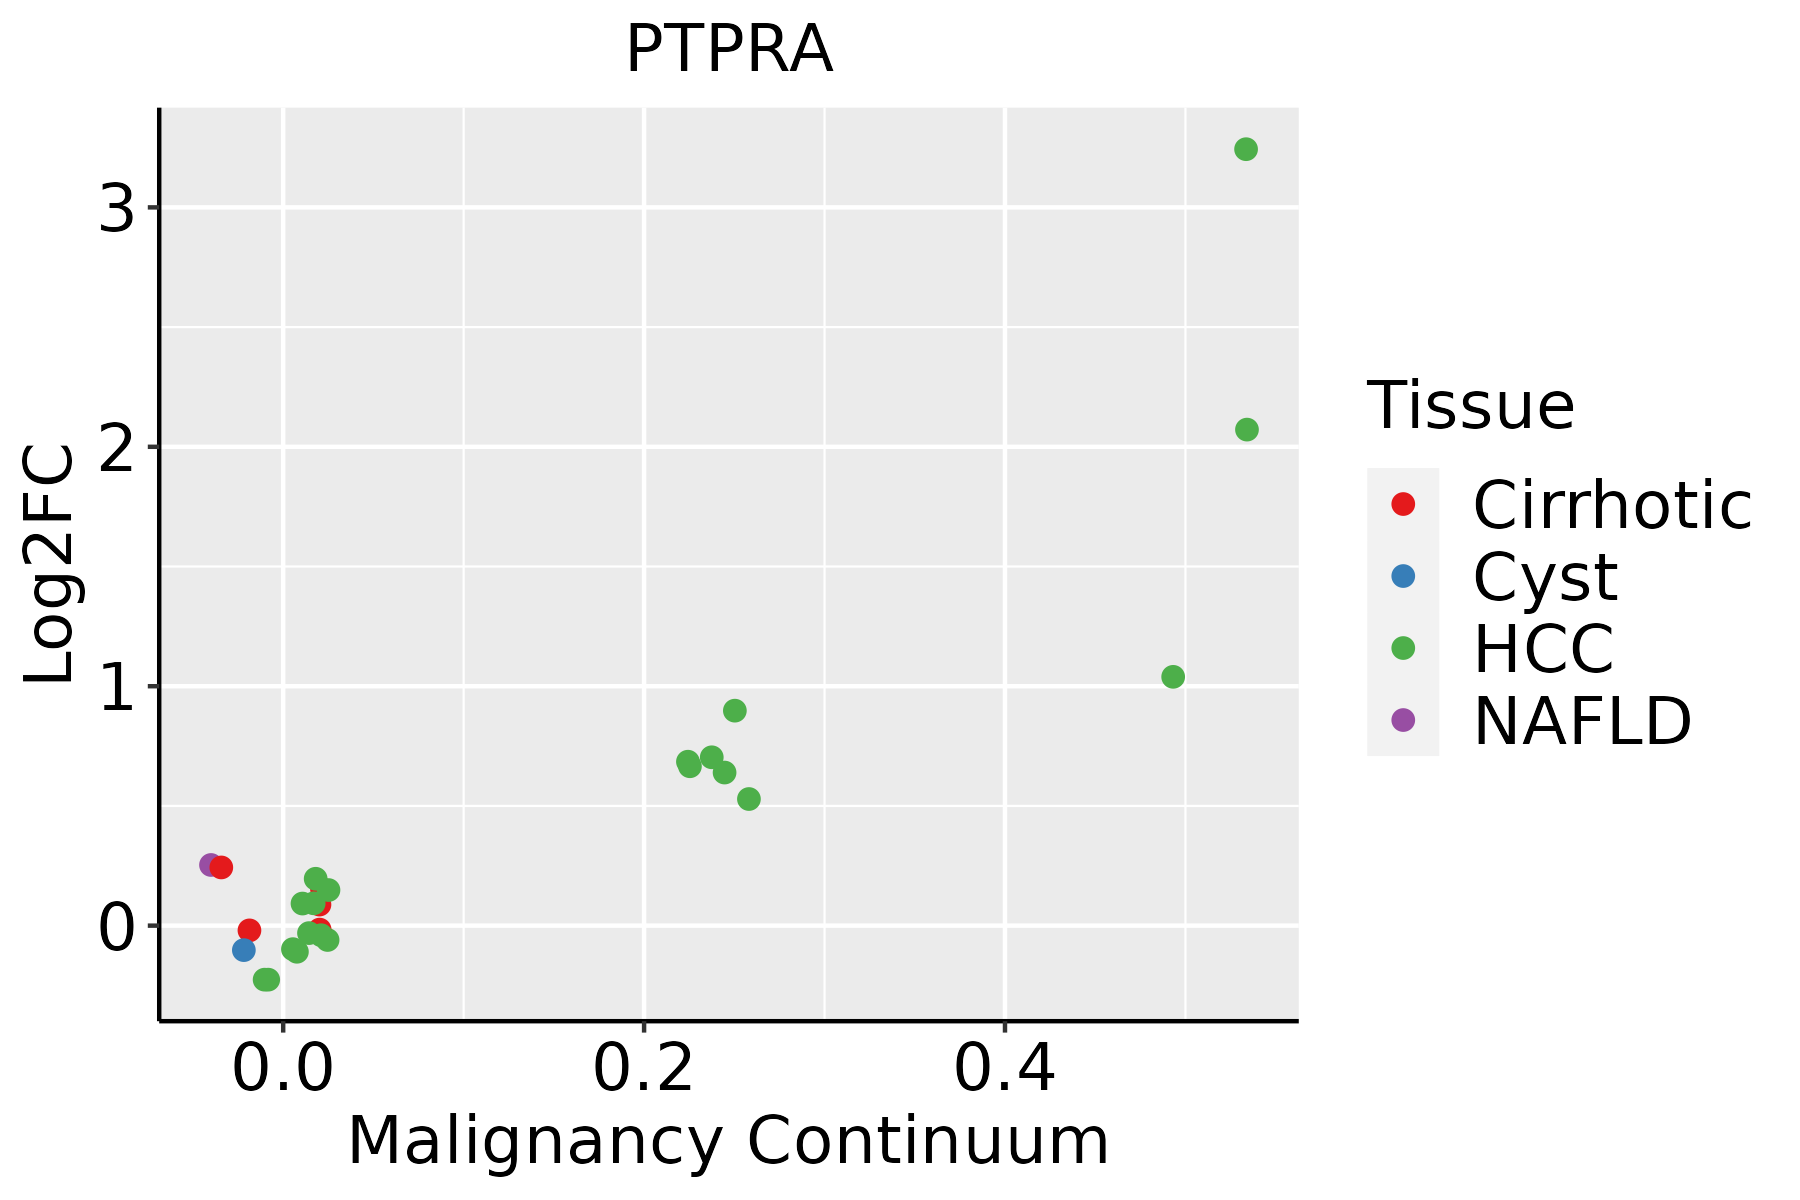 | HCC: Hepatocellular carcinoma |
| NAFLD: Non-alcoholic fatty liver disease |
| Lung | 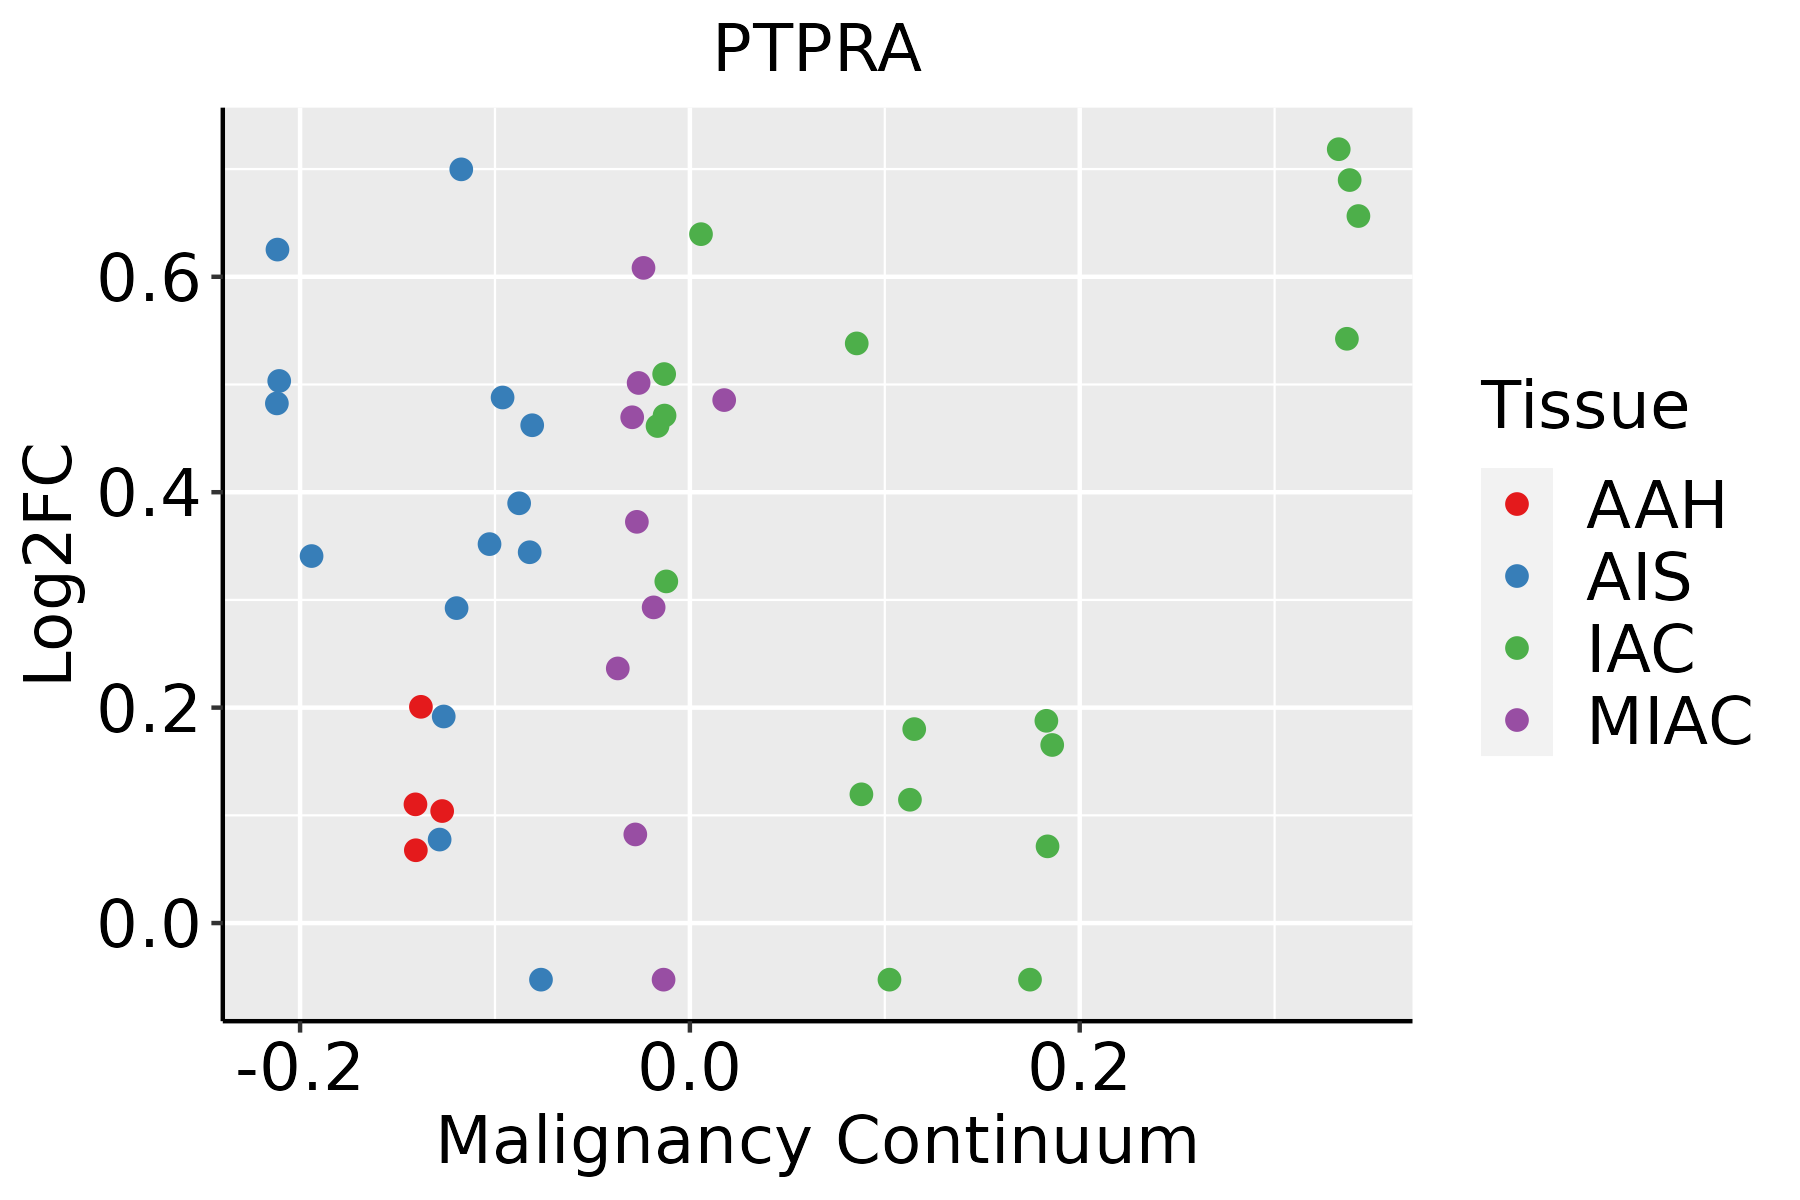 | AAH: Atypical adenomatous hyperplasia |
| AIS: Adenocarcinoma in situ |
| IAC: Invasive lung adenocarcinoma |
| MIA: Minimally invasive adenocarcinoma |
| Oral Cavity | 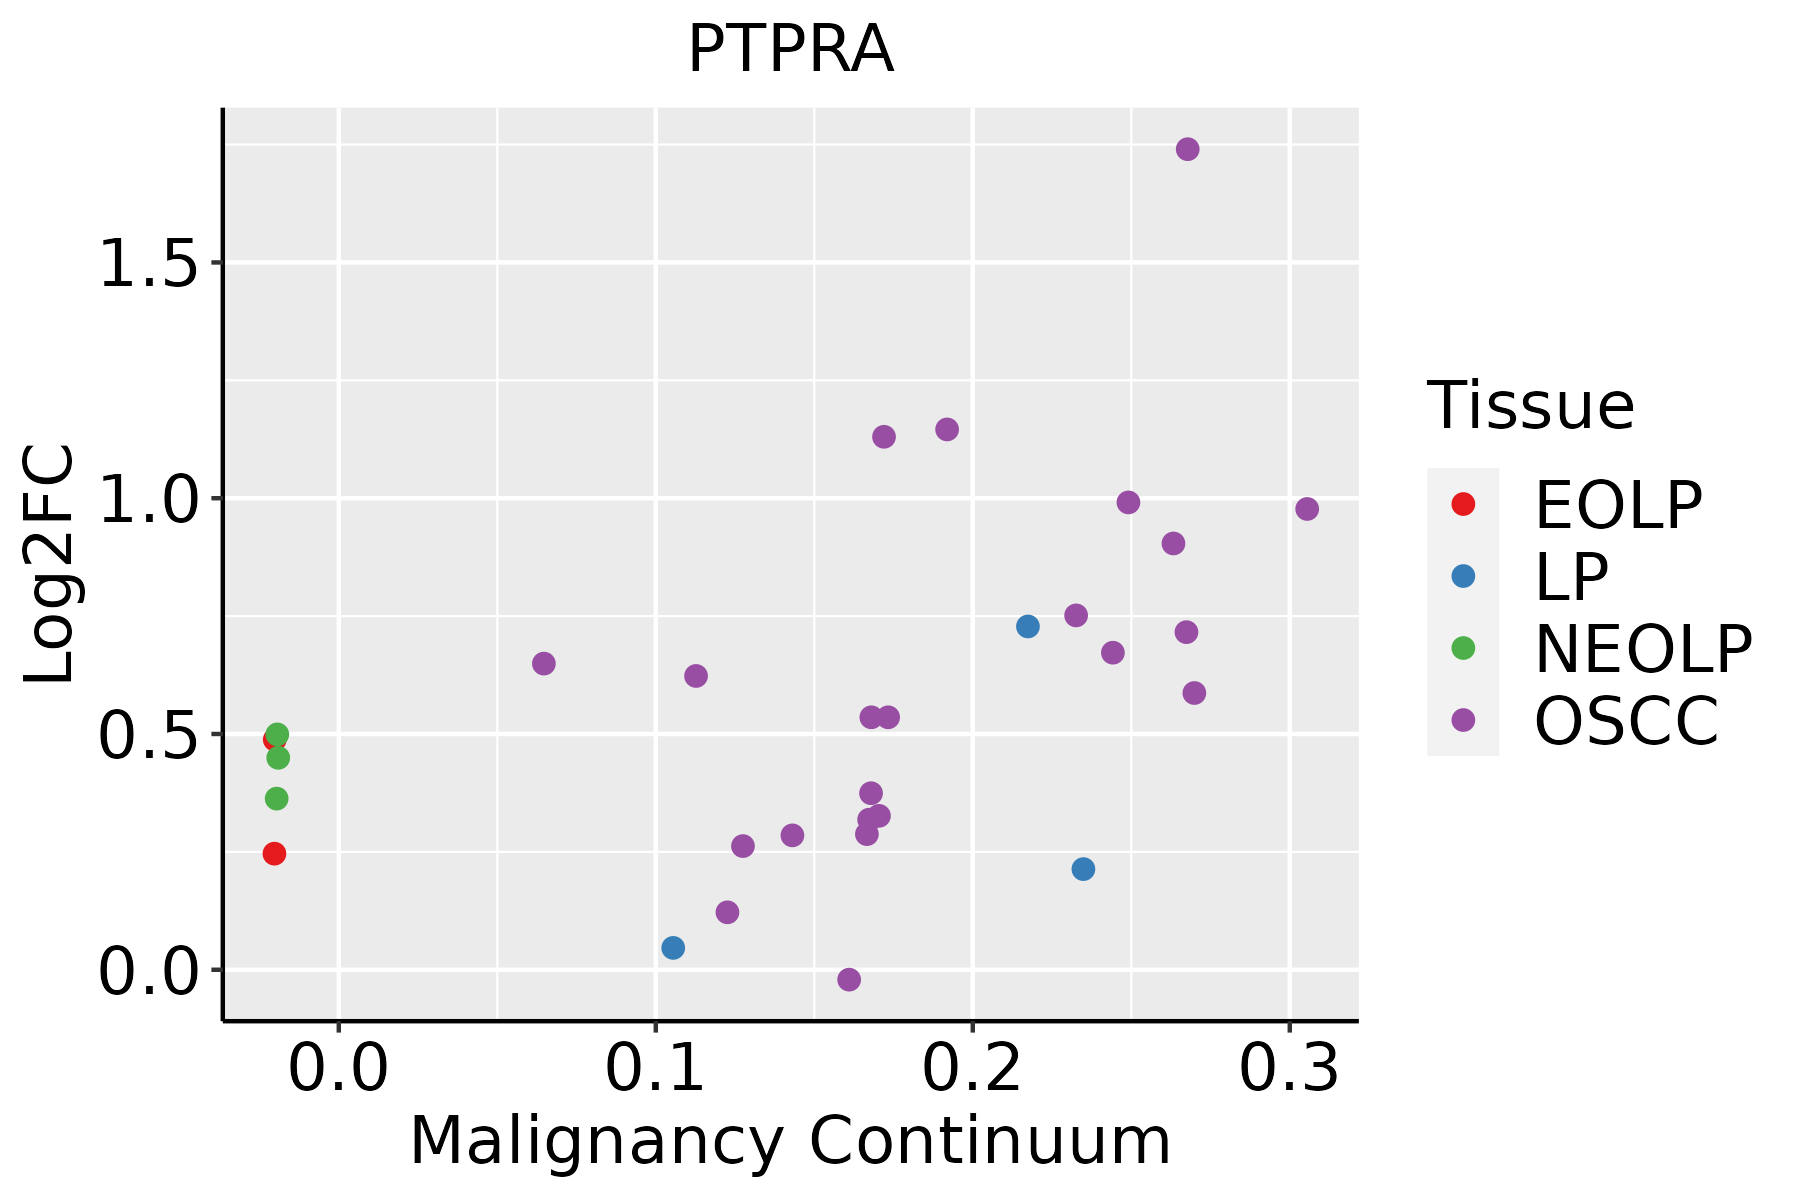 | EOLP: Erosive Oral lichen planus |
| LP: leukoplakia |
| NEOLP: Non-erosive oral lichen planus |
| OSCC: Oral squamous cell carcinoma |
| Skin | 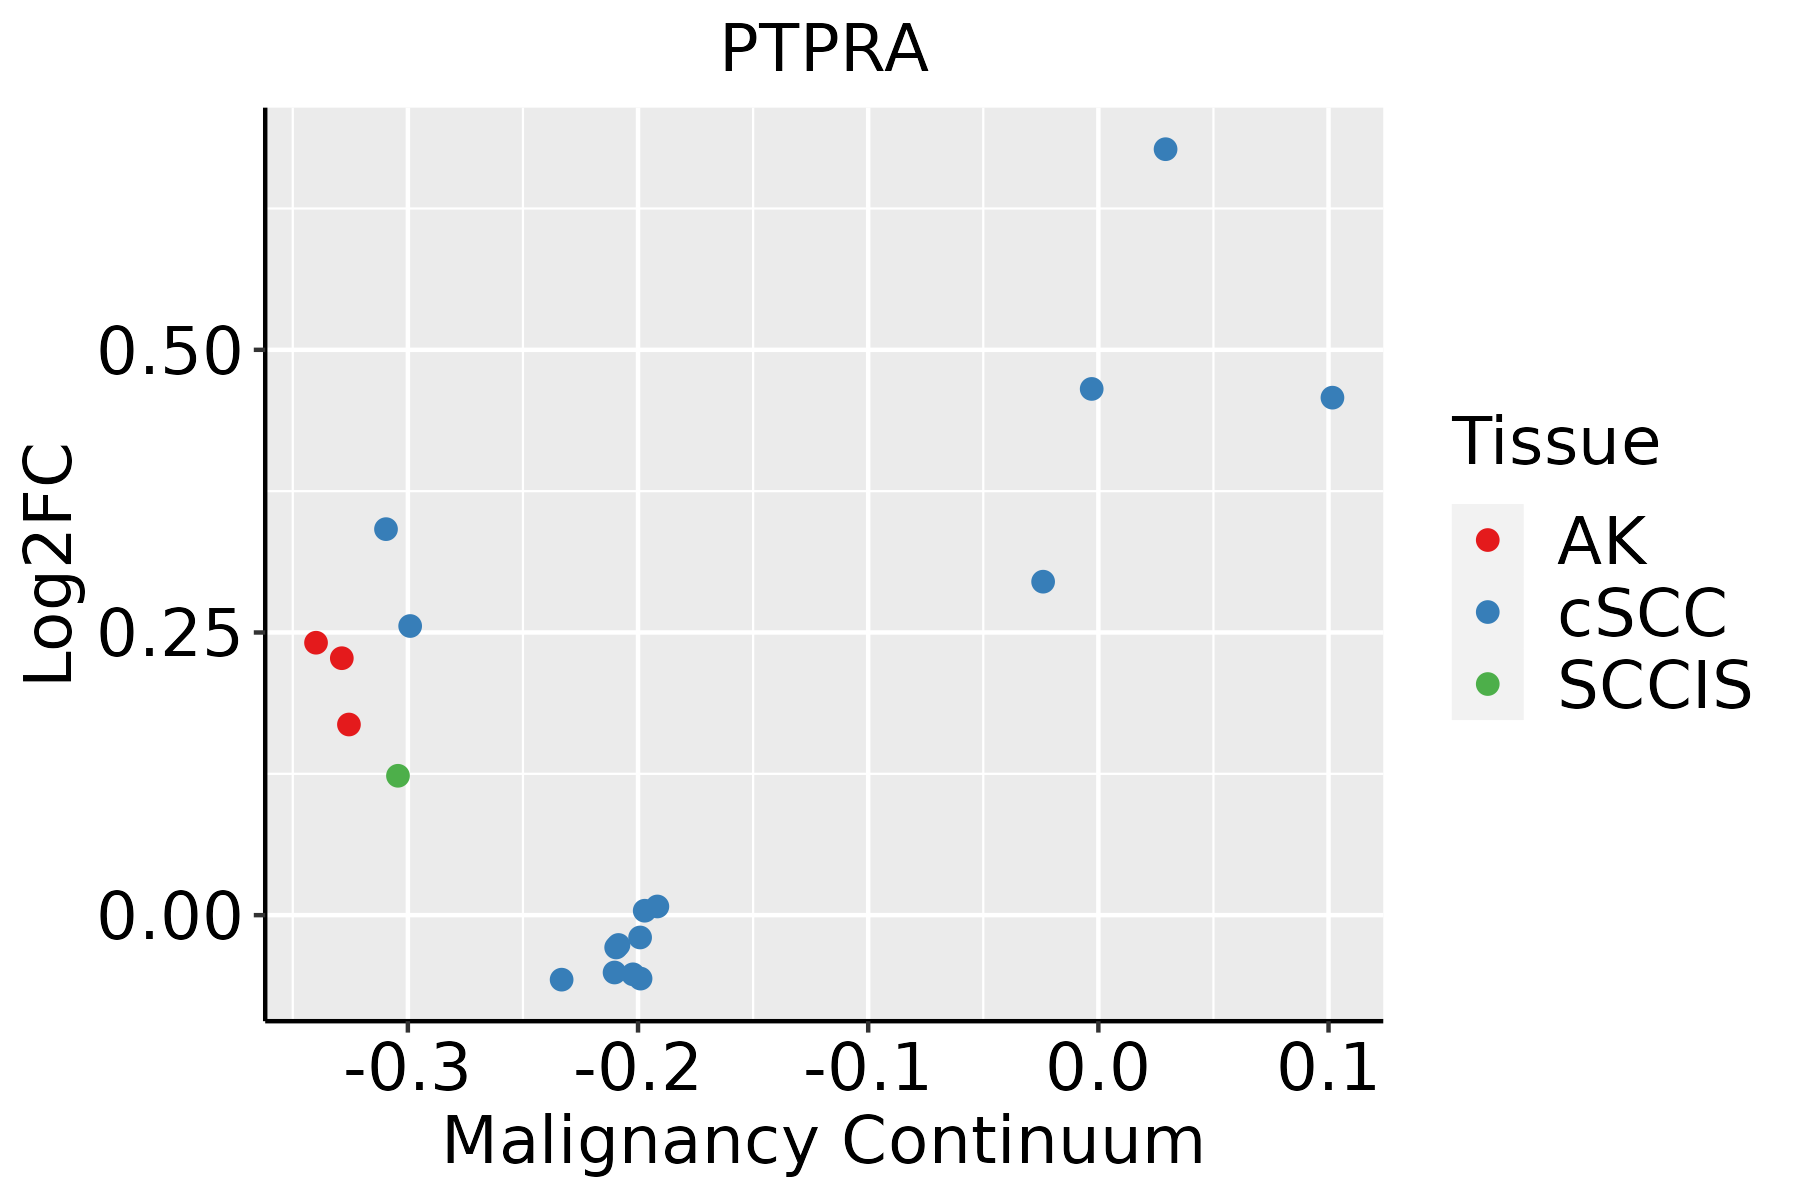 | AK: Actinic keratosis |
| cSCC: Cutaneous squamous cell carcinoma |
| SCCIS:squamous cell carcinoma in situ |
| Thyroid | 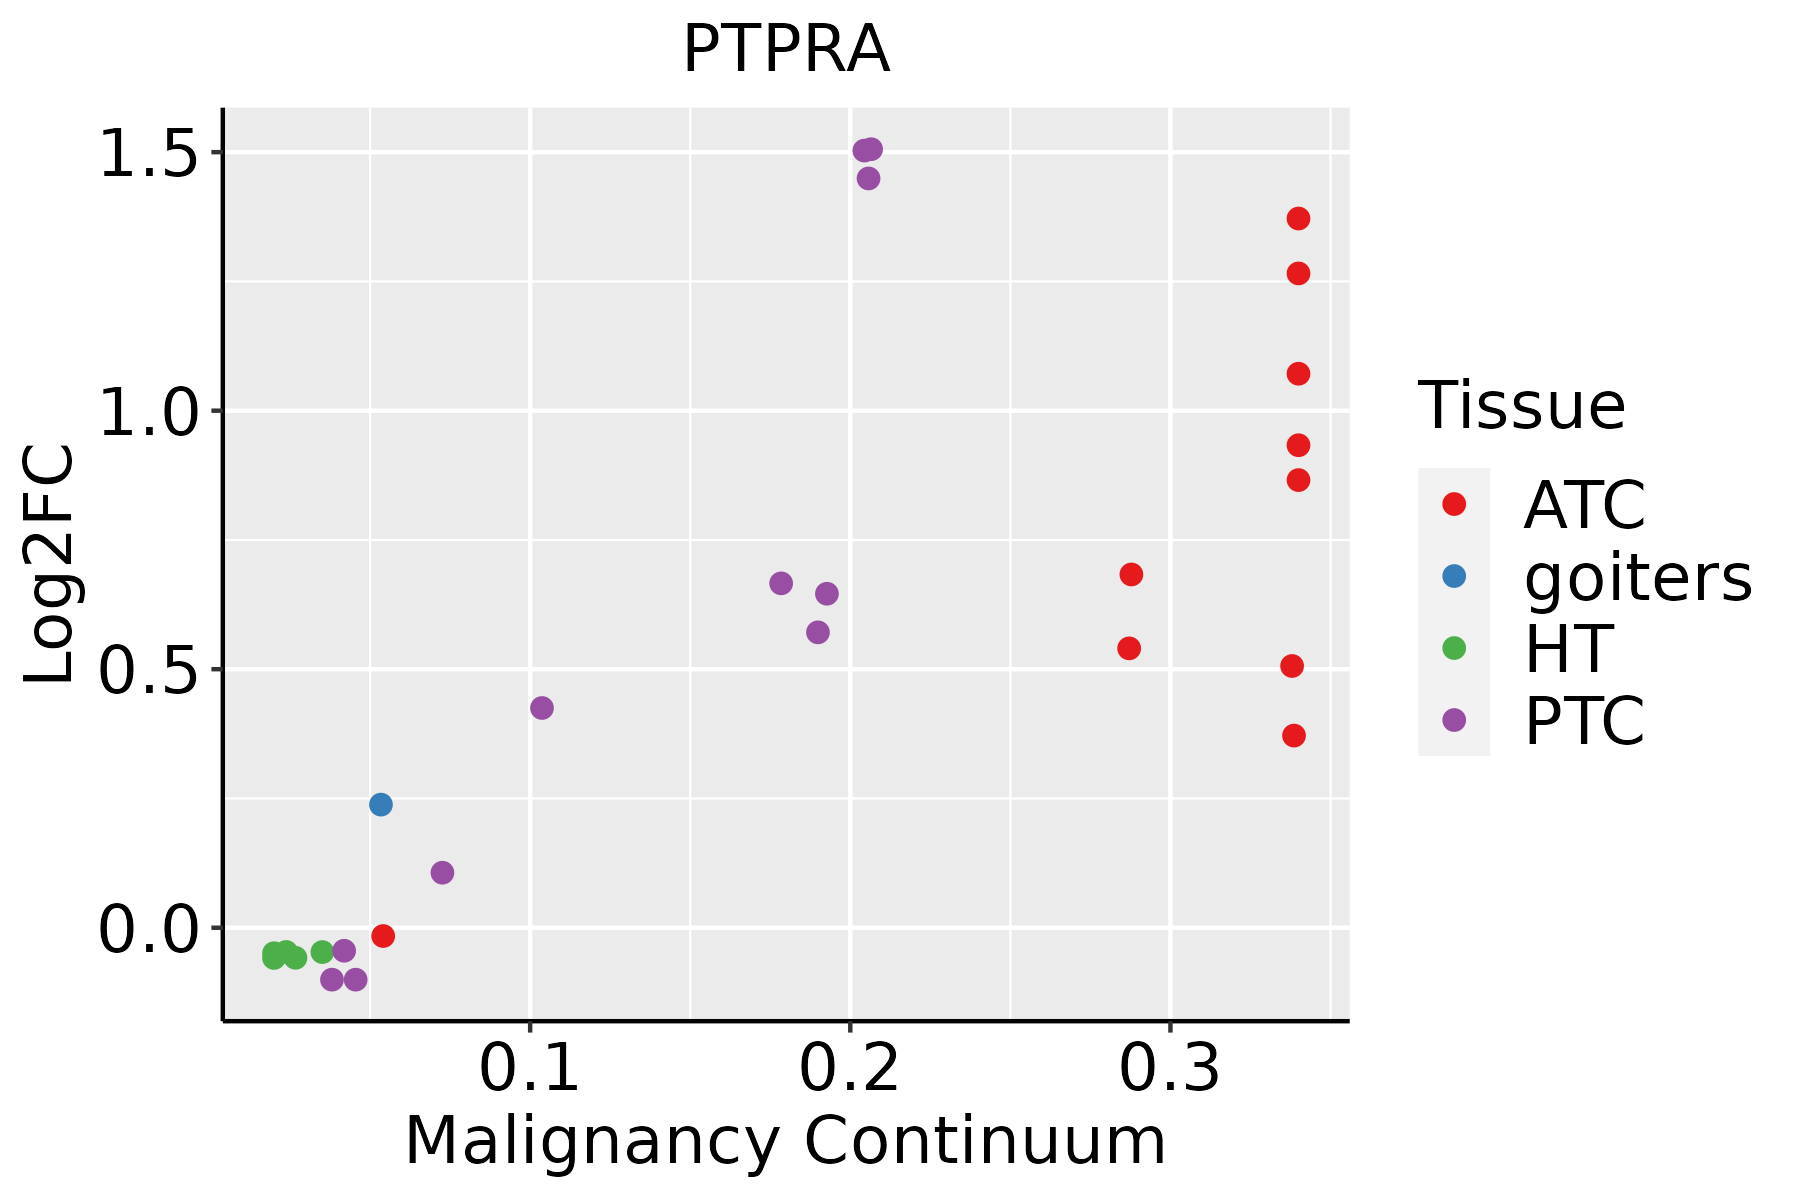 | ATC: Anaplastic thyroid cancer |
| HT: Hashimoto's thyroiditis |
| PTC: Papillary thyroid cancer |
| GO ID | Tissue | Disease Stage | Description | Gene Ratio | Bg Ratio | pvalue | p.adjust | Count |
| GO:001081010 | Cervix | CC | regulation of cell-substrate adhesion | 69/2311 | 221/18723 | 8.57e-14 | 5.69e-11 | 69 |
| GO:00315898 | Cervix | CC | cell-substrate adhesion | 96/2311 | 363/18723 | 1.48e-13 | 8.85e-11 | 96 |
| GO:01501159 | Cervix | CC | cell-substrate junction organization | 37/2311 | 101/18723 | 3.20e-10 | 4.46e-08 | 37 |
| GO:00070448 | Cervix | CC | cell-substrate junction assembly | 34/2311 | 95/18723 | 3.35e-09 | 3.45e-07 | 34 |
| GO:00019528 | Cervix | CC | regulation of cell-matrix adhesion | 40/2311 | 128/18723 | 1.32e-08 | 1.04e-06 | 40 |
| GO:00071608 | Cervix | CC | cell-matrix adhesion | 60/2311 | 233/18723 | 1.58e-08 | 1.23e-06 | 60 |
| GO:00072295 | Cervix | CC | integrin-mediated signaling pathway | 34/2311 | 107/18723 | 1.01e-07 | 5.25e-06 | 34 |
| GO:00343298 | Cervix | CC | cell junction assembly | 88/2311 | 420/18723 | 3.42e-07 | 1.38e-05 | 88 |
| GO:01501169 | Cervix | CC | regulation of cell-substrate junction organization | 25/2311 | 71/18723 | 5.58e-07 | 2.06e-05 | 25 |
| GO:00480417 | Cervix | CC | focal adhesion assembly | 28/2311 | 87/18723 | 9.86e-07 | 3.45e-05 | 28 |
| GO:00518938 | Cervix | CC | regulation of focal adhesion assembly | 22/2311 | 66/18723 | 7.37e-06 | 1.73e-04 | 22 |
| GO:00901098 | Cervix | CC | regulation of cell-substrate junction assembly | 22/2311 | 66/18723 | 7.37e-06 | 1.73e-04 | 22 |
| GO:00064708 | Cervix | CC | protein dephosphorylation | 60/2311 | 281/18723 | 1.33e-05 | 2.68e-04 | 60 |
| GO:19016538 | Cervix | CC | cellular response to peptide | 72/2311 | 359/18723 | 1.89e-05 | 3.48e-04 | 72 |
| GO:00434349 | Cervix | CC | response to peptide hormone | 77/2311 | 414/18723 | 1.40e-04 | 1.70e-03 | 77 |
| GO:00713757 | Cervix | CC | cellular response to peptide hormone stimulus | 57/2311 | 290/18723 | 2.32e-04 | 2.59e-03 | 57 |
| GO:00328698 | Cervix | CC | cellular response to insulin stimulus | 42/2311 | 203/18723 | 4.95e-04 | 4.83e-03 | 42 |
| GO:19018886 | Cervix | CC | regulation of cell junction assembly | 42/2311 | 204/18723 | 5.50e-04 | 5.29e-03 | 42 |
| GO:00163117 | Cervix | CC | dephosphorylation | 73/2311 | 417/18723 | 1.23e-03 | 9.87e-03 | 73 |
| GO:00328688 | Cervix | CC | response to insulin | 50/2311 | 264/18723 | 1.28e-03 | 1.02e-02 | 50 |
| Hugo Symbol | Variant Class | Variant Classification | dbSNP RS | HGVSc | HGVSp | HGVSp Short | SWISSPROT | BIOTYPE | SIFT | PolyPhen | Tumor Sample Barcode | Tissue | Histology | Sex | Age | Stage | Therapy Types | Drugs | Outcome |
| PTPRA | SNV | Missense_Mutation | rs758310508 | c.12G>T | p.Trp4Cys | p.W4C | P18433 | protein_coding | tolerated_low_confidence(0.1) | probably_damaging(0.99) | TCGA-A1-A0SP-01 | Breast | breast invasive carcinoma | Female | <65 | I/II | Chemotherapy | | SD |
| PTPRA | SNV | Missense_Mutation | novel | c.2377G>C | p.Asp793His | p.D793H | P18433 | protein_coding | deleterious(0.04) | benign(0.25) | TCGA-A2-A0CL-01 | Breast | breast invasive carcinoma | Female | <65 | III/IV | Chemotherapy | cytoxan | SD |
| PTPRA | SNV | Missense_Mutation | | c.2064G>T | p.Gln688His | p.Q688H | P18433 | protein_coding | tolerated(0.09) | benign(0.017) | TCGA-AC-A23H-01 | Breast | breast invasive carcinoma | Female | >=65 | I/II | Unknown | Unknown | PD |
| PTPRA | SNV | Missense_Mutation | rs138944640 | c.317C>T | p.Thr106Met | p.T106M | P18433 | protein_coding | deleterious_low_confidence(0) | benign(0.212) | TCGA-AR-A2LQ-01 | Breast | breast invasive carcinoma | Female | <65 | I/II | Chemotherapy | docetaxel | SD |
| PTPRA | SNV | Missense_Mutation | | c.742N>G | p.Leu248Val | p.L248V | P18433 | protein_coding | tolerated(0.05) | benign(0.122) | TCGA-C8-A26V-01 | Breast | breast invasive carcinoma | Female | <65 | III/IV | Hormone Therapy | tamoxiphen | CR |
| PTPRA | SNV | Missense_Mutation | novel | c.2060G>A | p.Arg687Gln | p.R687Q | P18433 | protein_coding | deleterious(0.01) | probably_damaging(0.943) | TCGA-E2-A15L-01 | Breast | breast invasive carcinoma | Female | >=65 | I/II | Hormone Therapy | arimidex | SD |
| PTPRA | SNV | Missense_Mutation | | c.1763A>T | p.Tyr588Phe | p.Y588F | P18433 | protein_coding | deleterious(0.01) | probably_damaging(1) | TCGA-GM-A2DD-01 | Breast | breast invasive carcinoma | Female | <65 | I/II | Chemotherapy | fluorouracil | CR |
| PTPRA | SNV | Missense_Mutation | novel | c.790N>A | p.Glu264Lys | p.E264K | P18433 | protein_coding | tolerated(0.29) | possibly_damaging(0.653) | TCGA-GM-A3XL-01 | Breast | breast invasive carcinoma | Female | <65 | I/II | Chemotherapy | fluorouracil | CR |
| PTPRA | insertion | Frame_Shift_Ins | novel | c.1686_1687insGGACACACTCCCTCCTA | p.Arg563GlyfsTer19 | p.R563Gfs*19 | P18433 | protein_coding | | | TCGA-A7-A0CE-01 | Breast | breast invasive carcinoma | Female | <65 | I/II | Chemotherapy | adriamycin | SD |
| PTPRA | insertion | Frame_Shift_Ins | novel | c.1688_1689insATGCTGGAATCCC | p.Val564CysfsTer12 | p.V564Cfs*12 | P18433 | protein_coding | | | TCGA-A7-A0CE-01 | Breast | breast invasive carcinoma | Female | <65 | I/II | Chemotherapy | adriamycin | SD |


