
|
|||||
|
 | |
| |
| |
| |
| |
| |
|
Gene: PTPN9 |
Gene summary for PTPN9 |
| Gene information | Species | Human | Gene symbol | PTPN9 | Gene ID | 5780 |
| Gene name | protein tyrosine phosphatase non-receptor type 9 | |
| Gene Alias | MEG2 | |
| Cytomap | 15q24.2 | |
| Gene Type | protein-coding | GO ID | GO:0006464 | UniProtAcc | P43378 |
Top |
Malignant transformation analysis |
| Identification of the aberrant gene expression in precancerous and cancerous lesions by comparing the gene expression of stem-like cells in diseased tissues with normal stem cells |
| Entrez ID | Symbol | Replicates | Species | Organ | Tissue | Adj P-value | Log2FC | Malignancy |
| 5780 | PTPN9 | LZE2T | Human | Esophagus | ESCC | 2.18e-04 | 3.43e-01 | 0.082 |
| 5780 | PTPN9 | LZE7T | Human | Esophagus | ESCC | 3.90e-02 | 1.39e-01 | 0.0667 |
| 5780 | PTPN9 | LZE20T | Human | Esophagus | ESCC | 3.16e-03 | 1.11e-01 | 0.0662 |
| 5780 | PTPN9 | P1T-E | Human | Esophagus | ESCC | 1.09e-04 | 2.22e-01 | 0.0875 |
| 5780 | PTPN9 | P2T-E | Human | Esophagus | ESCC | 1.53e-10 | 1.91e-01 | 0.1177 |
| 5780 | PTPN9 | P4T-E | Human | Esophagus | ESCC | 5.16e-10 | 2.22e-01 | 0.1323 |
| 5780 | PTPN9 | P8T-E | Human | Esophagus | ESCC | 2.78e-17 | 2.50e-01 | 0.0889 |
| 5780 | PTPN9 | P9T-E | Human | Esophagus | ESCC | 1.65e-09 | 1.89e-01 | 0.1131 |
| 5780 | PTPN9 | P10T-E | Human | Esophagus | ESCC | 1.06e-19 | 3.29e-01 | 0.116 |
| 5780 | PTPN9 | P11T-E | Human | Esophagus | ESCC | 6.08e-06 | 2.47e-01 | 0.1426 |
| 5780 | PTPN9 | P12T-E | Human | Esophagus | ESCC | 3.75e-16 | 2.91e-01 | 0.1122 |
| 5780 | PTPN9 | P15T-E | Human | Esophagus | ESCC | 9.51e-20 | 3.42e-01 | 0.1149 |
| 5780 | PTPN9 | P16T-E | Human | Esophagus | ESCC | 9.75e-13 | 3.24e-01 | 0.1153 |
| 5780 | PTPN9 | P19T-E | Human | Esophagus | ESCC | 4.64e-06 | 3.56e-01 | 0.1662 |
| 5780 | PTPN9 | P20T-E | Human | Esophagus | ESCC | 1.17e-04 | 1.27e-01 | 0.1124 |
| 5780 | PTPN9 | P21T-E | Human | Esophagus | ESCC | 9.56e-08 | 1.32e-01 | 0.1617 |
| 5780 | PTPN9 | P22T-E | Human | Esophagus | ESCC | 3.76e-08 | 1.98e-01 | 0.1236 |
| 5780 | PTPN9 | P23T-E | Human | Esophagus | ESCC | 2.13e-09 | 2.16e-01 | 0.108 |
| 5780 | PTPN9 | P24T-E | Human | Esophagus | ESCC | 2.05e-07 | 1.27e-01 | 0.1287 |
| 5780 | PTPN9 | P26T-E | Human | Esophagus | ESCC | 2.43e-15 | 2.33e-01 | 0.1276 |
| Page: 1 2 3 4 |
| Tissue | Expression Dynamics | Abbreviation |
| Esophagus | 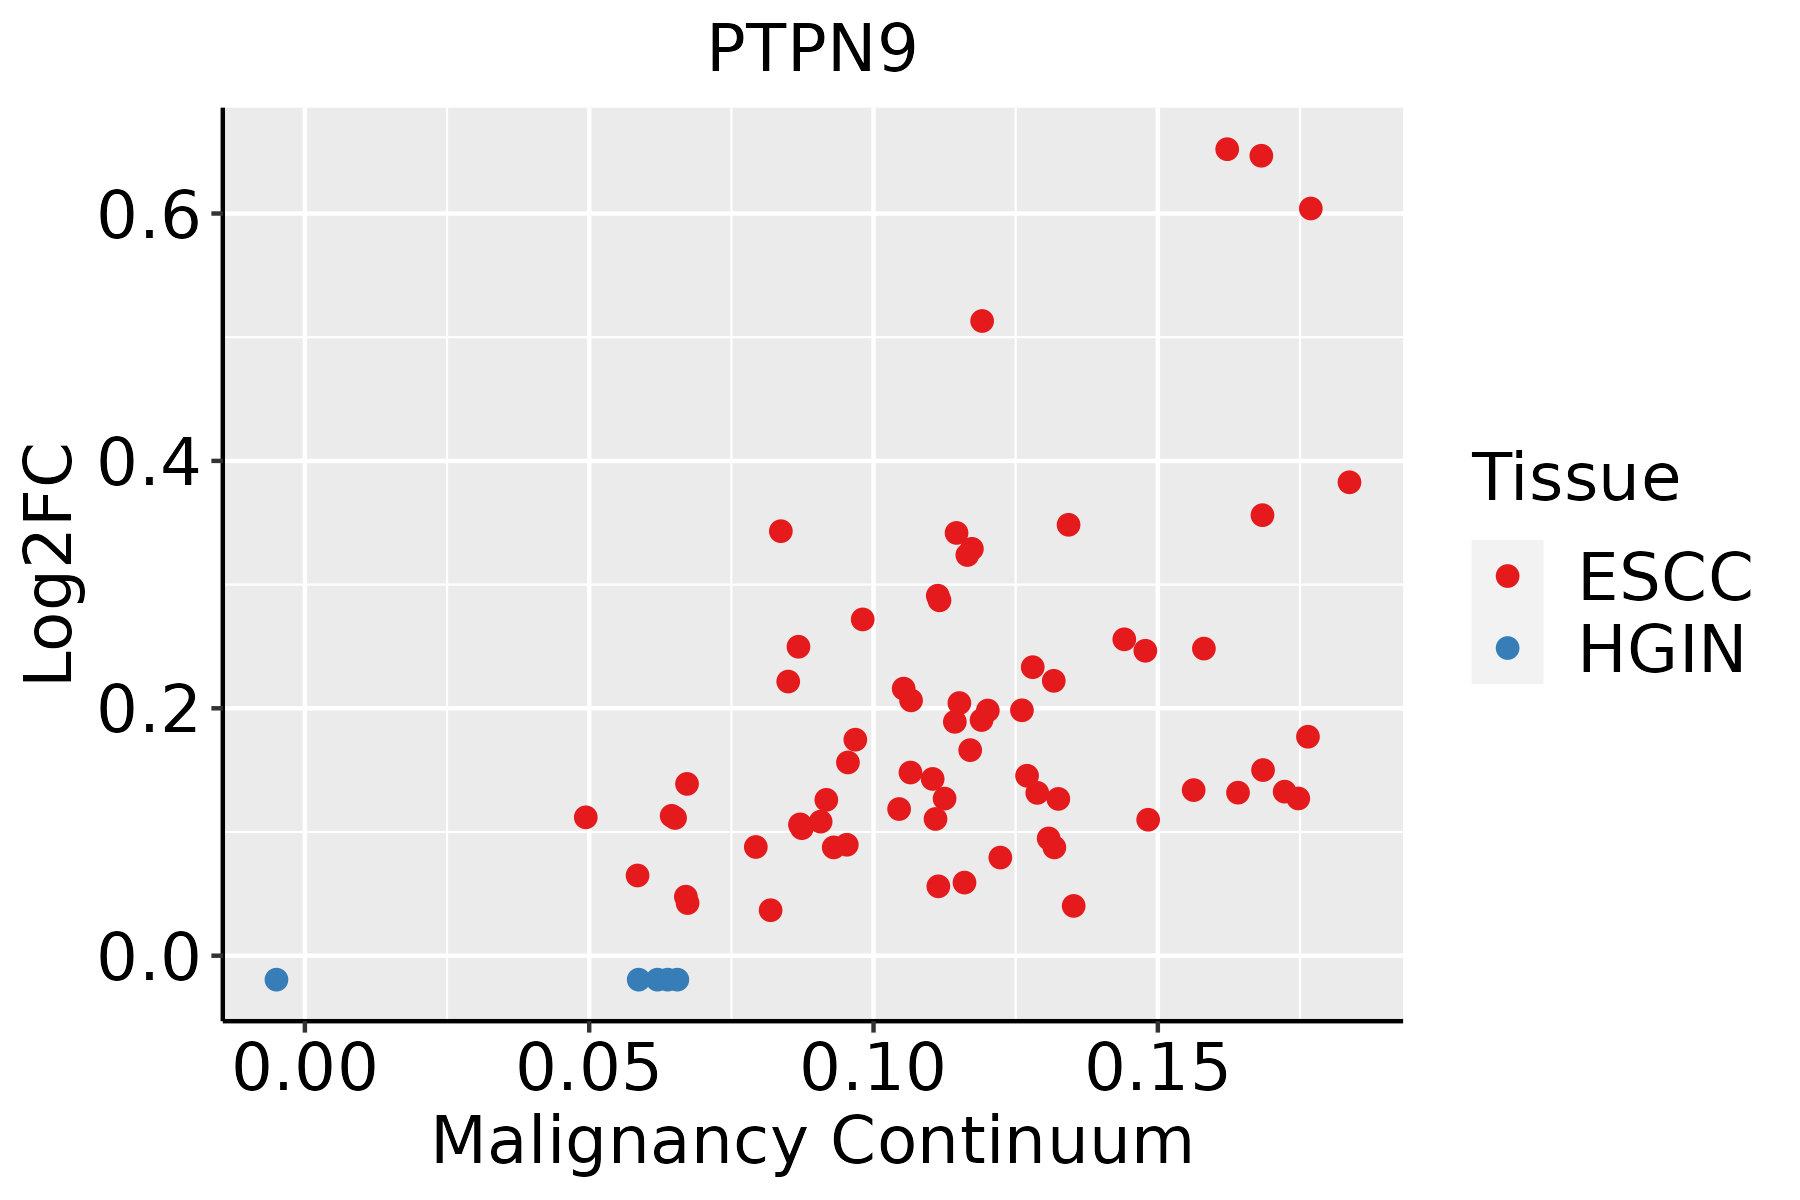 | ESCC: Esophageal squamous cell carcinoma |
| HGIN: High-grade intraepithelial neoplasias | ||
| LGIN: Low-grade intraepithelial neoplasias | ||
| Oral Cavity |  | EOLP: Erosive Oral lichen planus |
| LP: leukoplakia | ||
| NEOLP: Non-erosive oral lichen planus | ||
| OSCC: Oral squamous cell carcinoma |
| ∗log2FC in expression of this searched gene in stem-like cells from each diseased tissue sample relative to stem-like cells in normal samples in each tissue plotted against the malignancy continuum. Samples are colored based on if they are from different disease stage. |
Top |
Malignant transformation related pathway analysis |
| Find out the enriched GO biological processes and KEGG pathways involved in transition from healthy to precancer to cancer |
| Tissue | Disease Stage | Enriched GO biological Processes |
| Colorectum | AD |  |
| Colorectum | SER |  |
| Colorectum | MSS |  |
| Colorectum | MSI-H |  |
| Colorectum | FAP |  |
| ∗Top 15 enriched GO BP terms are showed in the bar plot of each disease state in each tissue. Each row represents a significant GO biological process which is colored according to the -log10(p.adjust). |
| Page: 1 2 3 4 5 6 7 8 9 |
| GO ID | Tissue | Disease Stage | Description | Gene Ratio | Bg Ratio | pvalue | p.adjust | Count |
| GO:1903829111 | Esophagus | ESCC | positive regulation of cellular protein localization | 199/8552 | 276/18723 | 2.99e-19 | 3.45e-17 | 199 |
| GO:0072659110 | Esophagus | ESCC | protein localization to plasma membrane | 193/8552 | 284/18723 | 1.95e-14 | 1.03e-12 | 193 |
| GO:199077819 | Esophagus | ESCC | protein localization to cell periphery | 217/8552 | 333/18723 | 4.08e-13 | 1.88e-11 | 217 |
| GO:001631110 | Esophagus | ESCC | dephosphorylation | 251/8552 | 417/18723 | 1.26e-09 | 2.99e-08 | 251 |
| GO:000647018 | Esophagus | ESCC | protein dephosphorylation | 177/8552 | 281/18723 | 3.13e-09 | 6.72e-08 | 177 |
| GO:190547519 | Esophagus | ESCC | regulation of protein localization to membrane | 117/8552 | 175/18723 | 1.14e-08 | 2.26e-07 | 117 |
| GO:190437519 | Esophagus | ESCC | regulation of protein localization to cell periphery | 85/8552 | 125/18723 | 3.63e-07 | 5.06e-06 | 85 |
| GO:1903076110 | Esophagus | ESCC | regulation of protein localization to plasma membrane | 72/8552 | 104/18723 | 9.74e-07 | 1.23e-05 | 72 |
| GO:190547719 | Esophagus | ESCC | positive regulation of protein localization to membrane | 73/8552 | 106/18723 | 1.13e-06 | 1.40e-05 | 73 |
| GO:190437719 | Esophagus | ESCC | positive regulation of protein localization to cell periphery | 47/8552 | 69/18723 | 1.37e-04 | 9.27e-04 | 47 |
| GO:190307817 | Esophagus | ESCC | positive regulation of protein localization to plasma membrane | 43/8552 | 62/18723 | 1.38e-04 | 9.35e-04 | 43 |
| GO:001097516 | Esophagus | ESCC | regulation of neuron projection development | 240/8552 | 445/18723 | 2.48e-04 | 1.53e-03 | 240 |
| GO:190382920 | Oral cavity | OSCC | positive regulation of cellular protein localization | 179/7305 | 276/18723 | 2.20e-18 | 2.41e-16 | 179 |
| GO:007265918 | Oral cavity | OSCC | protein localization to plasma membrane | 169/7305 | 284/18723 | 1.69e-12 | 7.21e-11 | 169 |
| GO:199077816 | Oral cavity | OSCC | protein localization to cell periphery | 190/7305 | 333/18723 | 1.46e-11 | 5.13e-10 | 190 |
| GO:000647015 | Oral cavity | OSCC | protein dephosphorylation | 162/7305 | 281/18723 | 1.56e-10 | 4.56e-09 | 162 |
| GO:00163119 | Oral cavity | OSCC | dephosphorylation | 220/7305 | 417/18723 | 6.33e-09 | 1.34e-07 | 220 |
| GO:190547516 | Oral cavity | OSCC | regulation of protein localization to membrane | 105/7305 | 175/18723 | 1.42e-08 | 2.85e-07 | 105 |
| GO:190437516 | Oral cavity | OSCC | regulation of protein localization to cell periphery | 78/7305 | 125/18723 | 9.80e-08 | 1.68e-06 | 78 |
| GO:190307617 | Oral cavity | OSCC | regulation of protein localization to plasma membrane | 67/7305 | 104/18723 | 1.34e-07 | 2.24e-06 | 67 |
| Page: 1 2 |
| Pathway ID | Tissue | Disease Stage | Description | Gene Ratio | Bg Ratio | pvalue | p.adjust | qvalue | Count |
| Page: 1 |
Top |
Cell-cell communication analysis |
| Identification of potential cell-cell interactions between two cell types and their ligand-receptor pairs for different disease states |
| Ligand | Receptor | LRpair | Pathway | Tissue | Disease Stage |
| Page: 1 |
Top |
Single-cell gene regulatory network inference analysis |
| Find out the significant the regulons (TFs) and the target genes of each regulon across cell types for different disease states |
| TF | Cell Type | Tissue | Disease Stage | Target Gene | RSS | Regulon Activity |
| ∗The dot plots of a searched regulon are shown for all cell subpopulations in each disease state of each tissue based on the regulon specific score inferred using pySCENIC and by calculating the average expression. |
| Page: 1 |
Top |
Somatic mutation of malignant transformation related genes |
| Annotation of somatic variants for genes involved in malignant transformation |
| Hugo Symbol | Variant Class | Variant Classification | dbSNP RS | HGVSc | HGVSp | HGVSp Short | SWISSPROT | BIOTYPE | SIFT | PolyPhen | Tumor Sample Barcode | Tissue | Histology | Sex | Age | Stage | Therapy Types | Drugs | Outcome |
| PTPN9 | SNV | Missense_Mutation | c.713A>G | p.Tyr238Cys | p.Y238C | P43378 | protein_coding | tolerated(0.18) | benign(0.001) | TCGA-AN-A0AK-01 | Breast | breast invasive carcinoma | Female | >=65 | I/II | Unknown | Unknown | SD | |
| PTPN9 | SNV | Missense_Mutation | c.1086N>G | p.Phe362Leu | p.F362L | P43378 | protein_coding | deleterious(0) | benign(0.424) | TCGA-BH-A1FU-01 | Breast | breast invasive carcinoma | Female | <65 | I/II | Unknown | Unknown | PD | |
| PTPN9 | SNV | Missense_Mutation | novel | c.1741G>T | p.Val581Leu | p.V581L | P43378 | protein_coding | tolerated(1) | benign(0) | TCGA-D8-A1Y1-01 | Breast | breast invasive carcinoma | Female | >=65 | III/IV | Hormone Therapy | tamoxiphen | PD |
| PTPN9 | SNV | Missense_Mutation | c.1274N>A | p.Arg425Gln | p.R425Q | P43378 | protein_coding | tolerated(0.64) | benign(0.001) | TCGA-EW-A3U0-01 | Breast | breast invasive carcinoma | Female | <65 | III/IV | Chemotherapy | cisplatin | CR | |
| PTPN9 | SNV | Missense_Mutation | novel | c.1516N>G | p.Cys506Gly | p.C506G | P43378 | protein_coding | tolerated(0.14) | benign(0.006) | TCGA-GM-A2DO-01 | Breast | breast invasive carcinoma | Female | <65 | I/II | Hormone Therapy | tamoxiphen | CR |
| PTPN9 | SNV | Missense_Mutation | novel | c.1627N>A | p.Val543Met | p.V543M | P43378 | protein_coding | deleterious(0) | probably_damaging(0.956) | TCGA-2W-A8YY-01 | Cervix | cervical & endocervical cancer | Female | <65 | I/II | Chemotherapy | cisplatin | CR |
| PTPN9 | SNV | Missense_Mutation | novel | c.1229G>T | p.Arg410Ile | p.R410I | P43378 | protein_coding | tolerated(0.26) | benign(0.038) | TCGA-VS-A9V0-01 | Cervix | cervical & endocervical cancer | Female | <65 | I/II | Chemotherapy | cisplatin | PD |
| PTPN9 | SNV | Missense_Mutation | novel | c.79C>G | p.Leu27Val | p.L27V | P43378 | protein_coding | deleterious(0.01) | probably_damaging(0.946) | TCGA-ZJ-AAXB-01 | Cervix | cervical & endocervical cancer | Female | <65 | I/II | Unknown | Unknown | SD |
| PTPN9 | SNV | Missense_Mutation | c.1066N>A | p.Asp356Asn | p.D356N | P43378 | protein_coding | deleterious(0.03) | probably_damaging(0.942) | TCGA-A6-6142-01 | Colorectum | colon adenocarcinoma | Female | <65 | I/II | Chemotherapy | fluorouracil | PD | |
| PTPN9 | SNV | Missense_Mutation | novel | c.488N>C | p.Phe163Ser | p.F163S | P43378 | protein_coding | deleterious(0) | probably_damaging(1) | TCGA-AA-3947-01 | Colorectum | colon adenocarcinoma | Female | <65 | I/II | Unknown | Unknown | SD |
| Page: 1 2 3 4 5 6 |
Top |
Related drugs of malignant transformation related genes |
| Identification of chemicals and drugs interact with genes involved in malignant transfromation |
| (DGIdb 4.0) |
| Entrez ID | Symbol | Category | Interaction Types | Drug Claim Name | Drug Name | PMIDs |
| Page: 1 |

Copyright 2023-Present -The University of Texas Health Science Center at Houston |