
|
|||||
|
 | |
| |
| |
| |
| |
| |
|
Gene: PTPN4 |
Gene summary for PTPN4 |
| Gene information | Species | Human | Gene symbol | PTPN4 | Gene ID | 5775 |
| Gene name | protein tyrosine phosphatase non-receptor type 4 | |
| Gene Alias | MEG | |
| Cytomap | 2q14.2 | |
| Gene Type | protein-coding | GO ID | GO:0006464 | UniProtAcc | A0A024RAE8 |
Top |
Malignant transformation analysis |
| Identification of the aberrant gene expression in precancerous and cancerous lesions by comparing the gene expression of stem-like cells in diseased tissues with normal stem cells |
| Entrez ID | Symbol | Replicates | Species | Organ | Tissue | Adj P-value | Log2FC | Malignancy |
| 5775 | PTPN4 | CA_HPV_3 | Human | Cervix | CC | 8.98e-03 | 9.01e-02 | 0.0414 |
| 5775 | PTPN4 | CCI_3 | Human | Cervix | CC | 1.14e-11 | 7.01e-01 | 0.516 |
| 5775 | PTPN4 | HTA11_3410_2000001011 | Human | Colorectum | AD | 5.32e-17 | -6.25e-01 | 0.0155 |
| 5775 | PTPN4 | HTA11_3361_2000001011 | Human | Colorectum | AD | 1.31e-04 | -5.43e-01 | -0.1207 |
| 5775 | PTPN4 | HTA11_696_2000001011 | Human | Colorectum | AD | 3.52e-12 | -5.02e-01 | -0.1464 |
| 5775 | PTPN4 | HTA11_866_2000001011 | Human | Colorectum | AD | 7.57e-04 | -3.47e-01 | -0.1001 |
| 5775 | PTPN4 | HTA11_5212_2000001011 | Human | Colorectum | AD | 1.65e-03 | -6.89e-01 | -0.2061 |
| 5775 | PTPN4 | HTA11_546_2000001011 | Human | Colorectum | AD | 2.81e-02 | -4.99e-01 | -0.0842 |
| 5775 | PTPN4 | HTA11_866_3004761011 | Human | Colorectum | AD | 7.02e-11 | -5.66e-01 | 0.096 |
| 5775 | PTPN4 | HTA11_7696_3000711011 | Human | Colorectum | AD | 4.33e-05 | -4.18e-01 | 0.0674 |
| 5775 | PTPN4 | HTA11_99999970781_79442 | Human | Colorectum | MSS | 1.24e-07 | -4.48e-01 | 0.294 |
| 5775 | PTPN4 | HTA11_99999973899_84307 | Human | Colorectum | MSS | 2.59e-02 | -5.20e-01 | 0.2585 |
| 5775 | PTPN4 | HTA11_99999974143_84620 | Human | Colorectum | MSS | 3.16e-05 | -3.52e-01 | 0.3005 |
| 5775 | PTPN4 | A001-C-207 | Human | Colorectum | FAP | 1.32e-02 | -2.27e-01 | 0.1278 |
| 5775 | PTPN4 | A015-C-203 | Human | Colorectum | FAP | 1.59e-26 | -2.97e-01 | -0.1294 |
| 5775 | PTPN4 | A015-C-204 | Human | Colorectum | FAP | 2.98e-04 | -2.45e-01 | -0.0228 |
| 5775 | PTPN4 | A014-C-040 | Human | Colorectum | FAP | 1.42e-03 | -3.98e-01 | -0.1184 |
| 5775 | PTPN4 | A002-C-201 | Human | Colorectum | FAP | 2.25e-12 | -1.62e-01 | 0.0324 |
| 5775 | PTPN4 | A002-C-203 | Human | Colorectum | FAP | 4.57e-02 | -1.33e-01 | 0.2786 |
| 5775 | PTPN4 | A001-C-119 | Human | Colorectum | FAP | 4.11e-05 | -2.94e-01 | -0.1557 |
| Page: 1 2 3 4 5 6 7 8 |
| Tissue | Expression Dynamics | Abbreviation |
| Cervix | 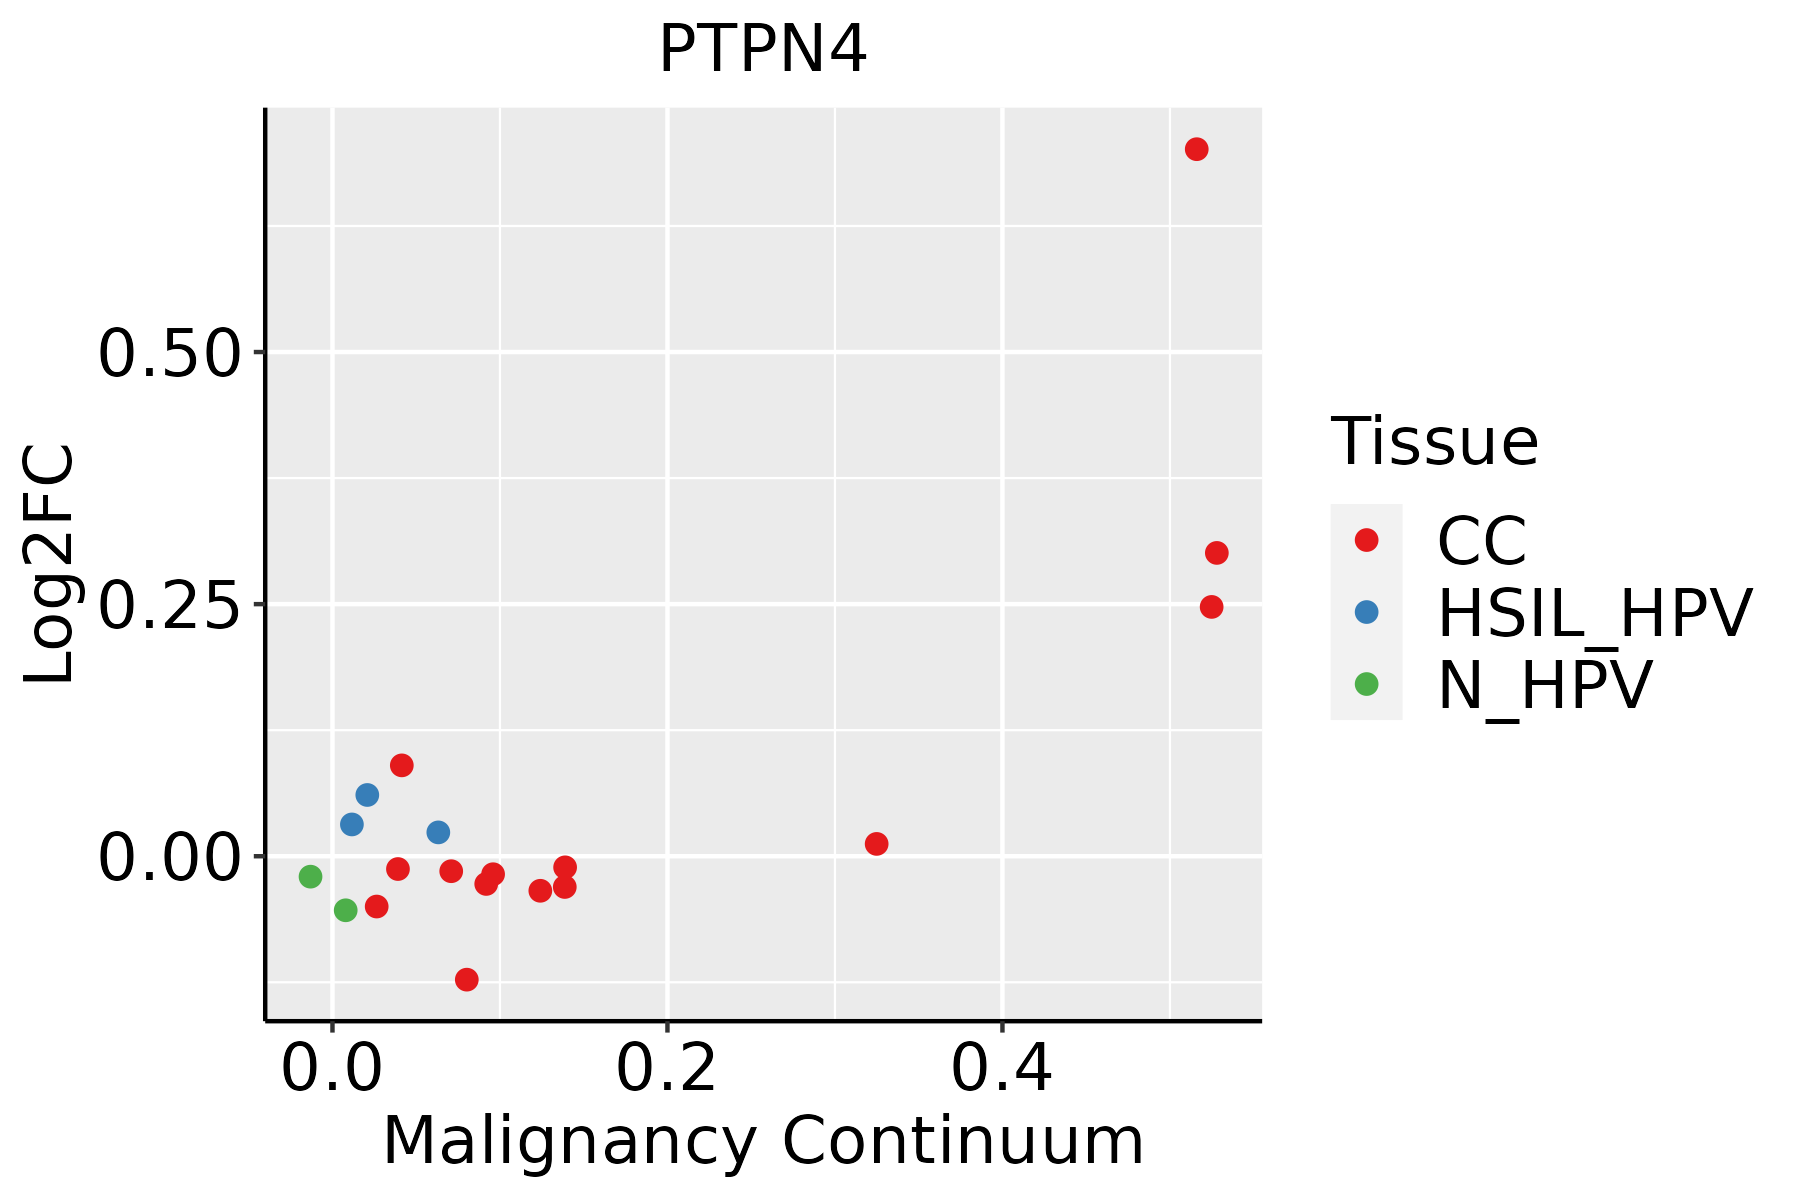 | CC: Cervix cancer |
| HSIL_HPV: HPV-infected high-grade squamous intraepithelial lesions | ||
| N_HPV: HPV-infected normal cervix | ||
| Colorectum (GSE201348) |  | FAP: Familial adenomatous polyposis |
| CRC: Colorectal cancer | ||
| Colorectum (HTA11) |  | AD: Adenomas |
| SER: Sessile serrated lesions | ||
| MSI-H: Microsatellite-high colorectal cancer | ||
| MSS: Microsatellite stable colorectal cancer | ||
| Endometrium | 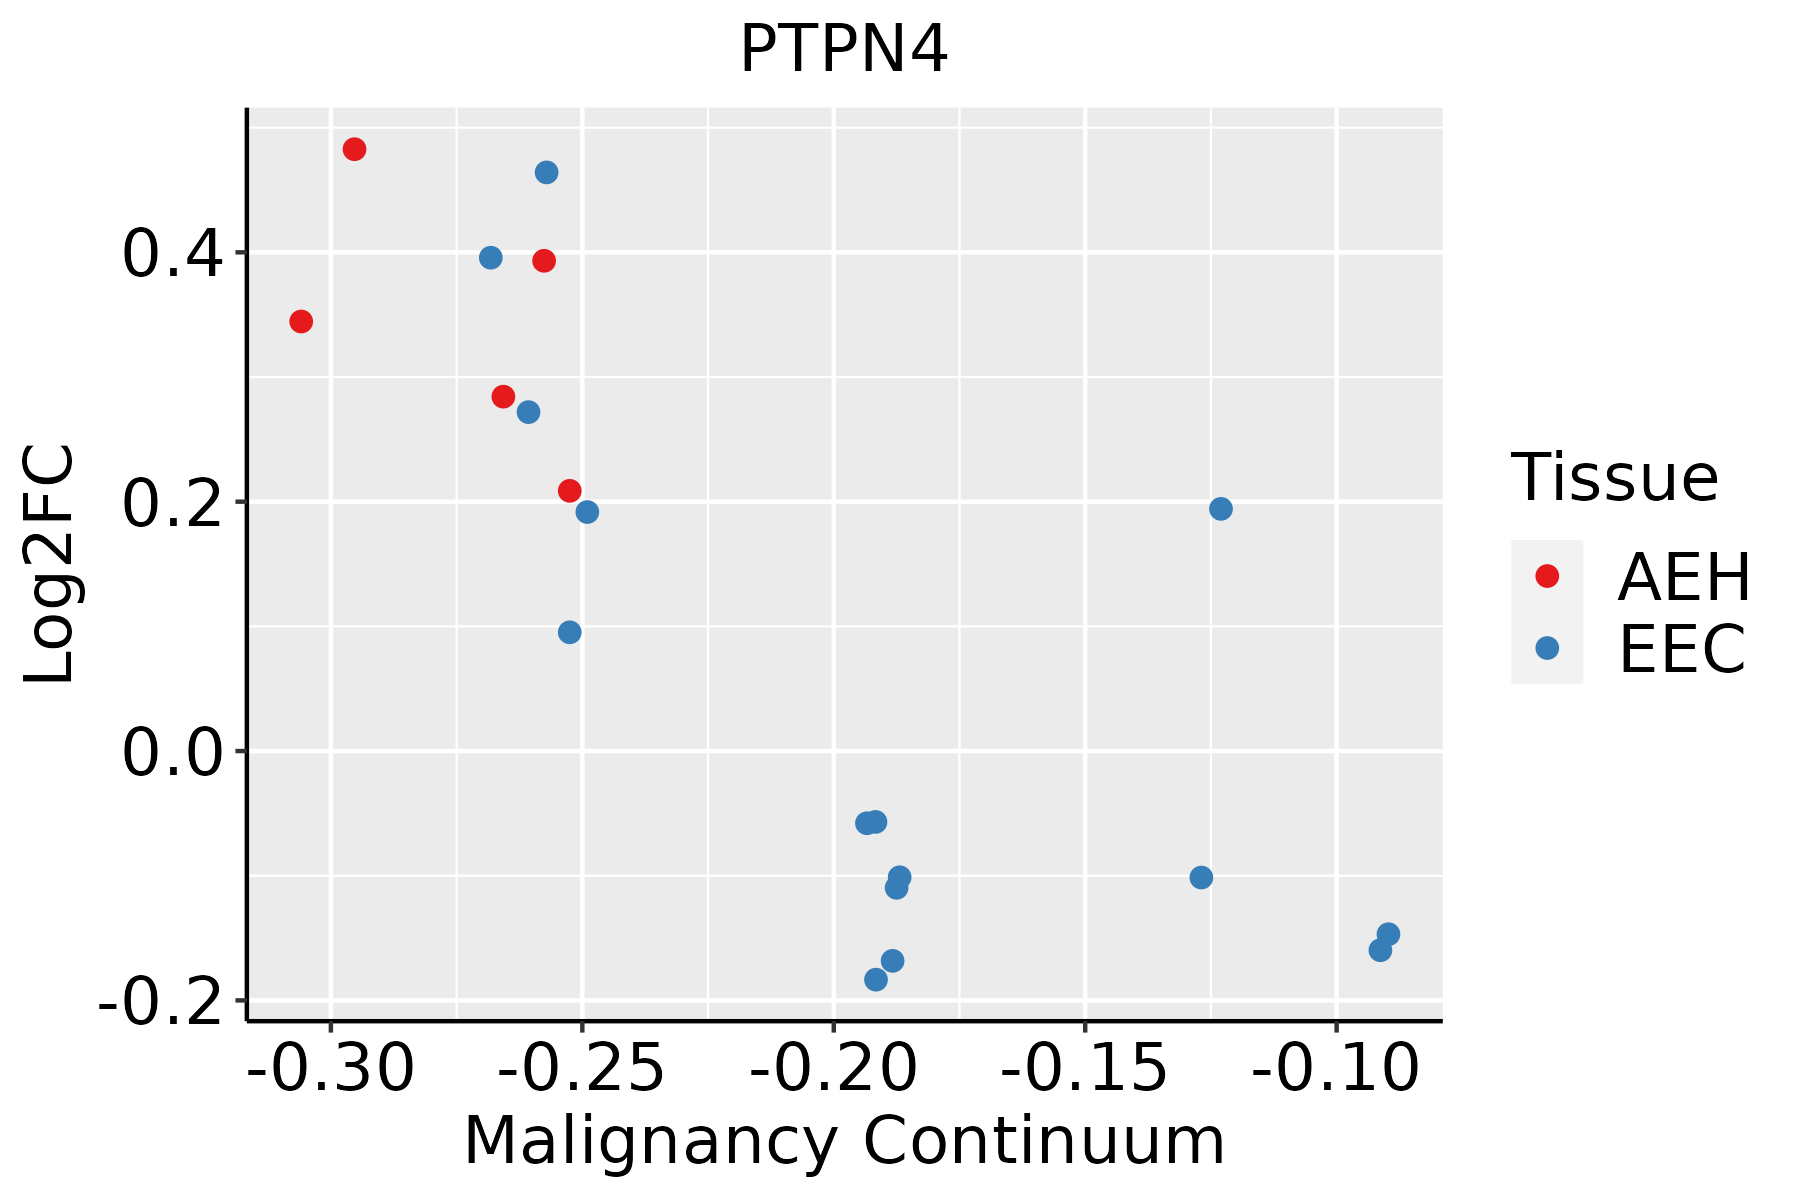 | AEH: Atypical endometrial hyperplasia |
| EEC: Endometrioid Cancer | ||
| Esophagus |  | ESCC: Esophageal squamous cell carcinoma |
| HGIN: High-grade intraepithelial neoplasias | ||
| LGIN: Low-grade intraepithelial neoplasias | ||
| Liver | 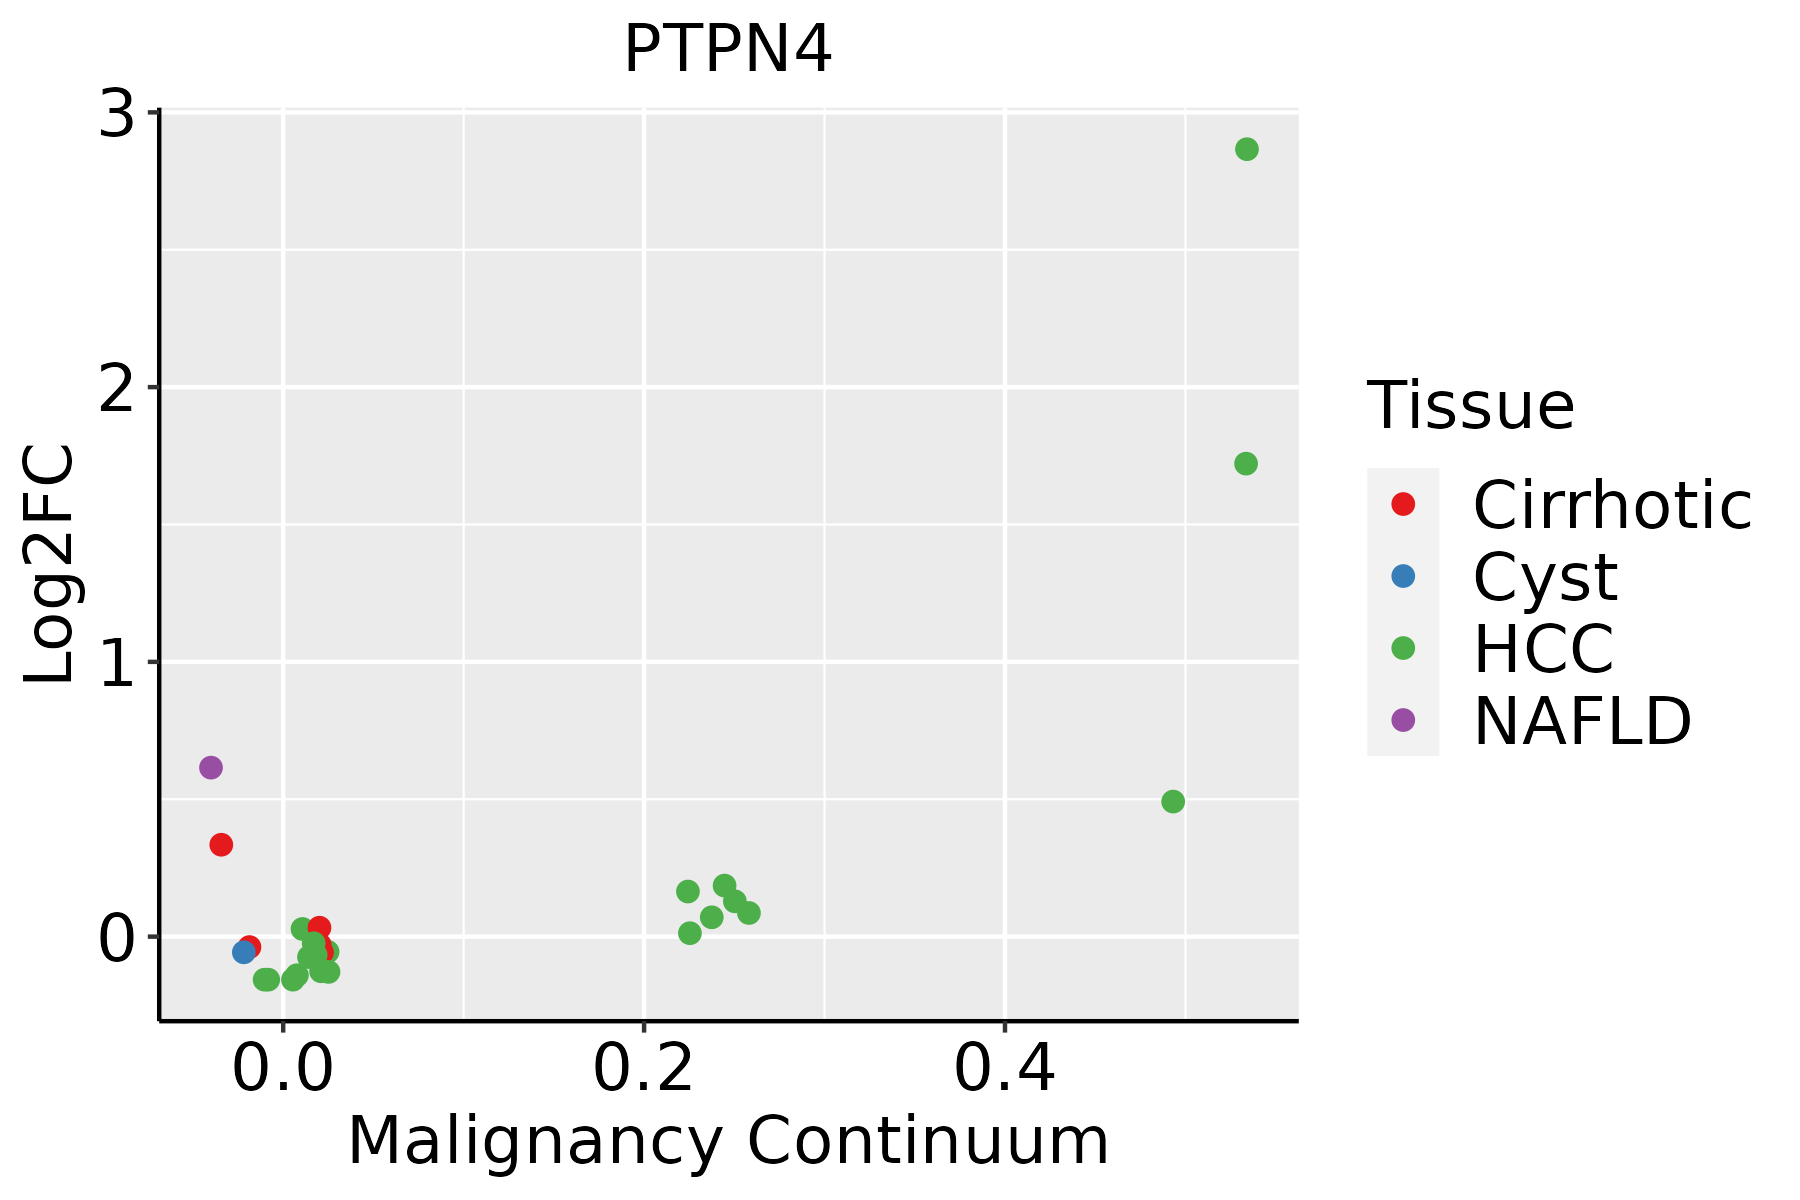 | HCC: Hepatocellular carcinoma |
| NAFLD: Non-alcoholic fatty liver disease | ||
| Lung | 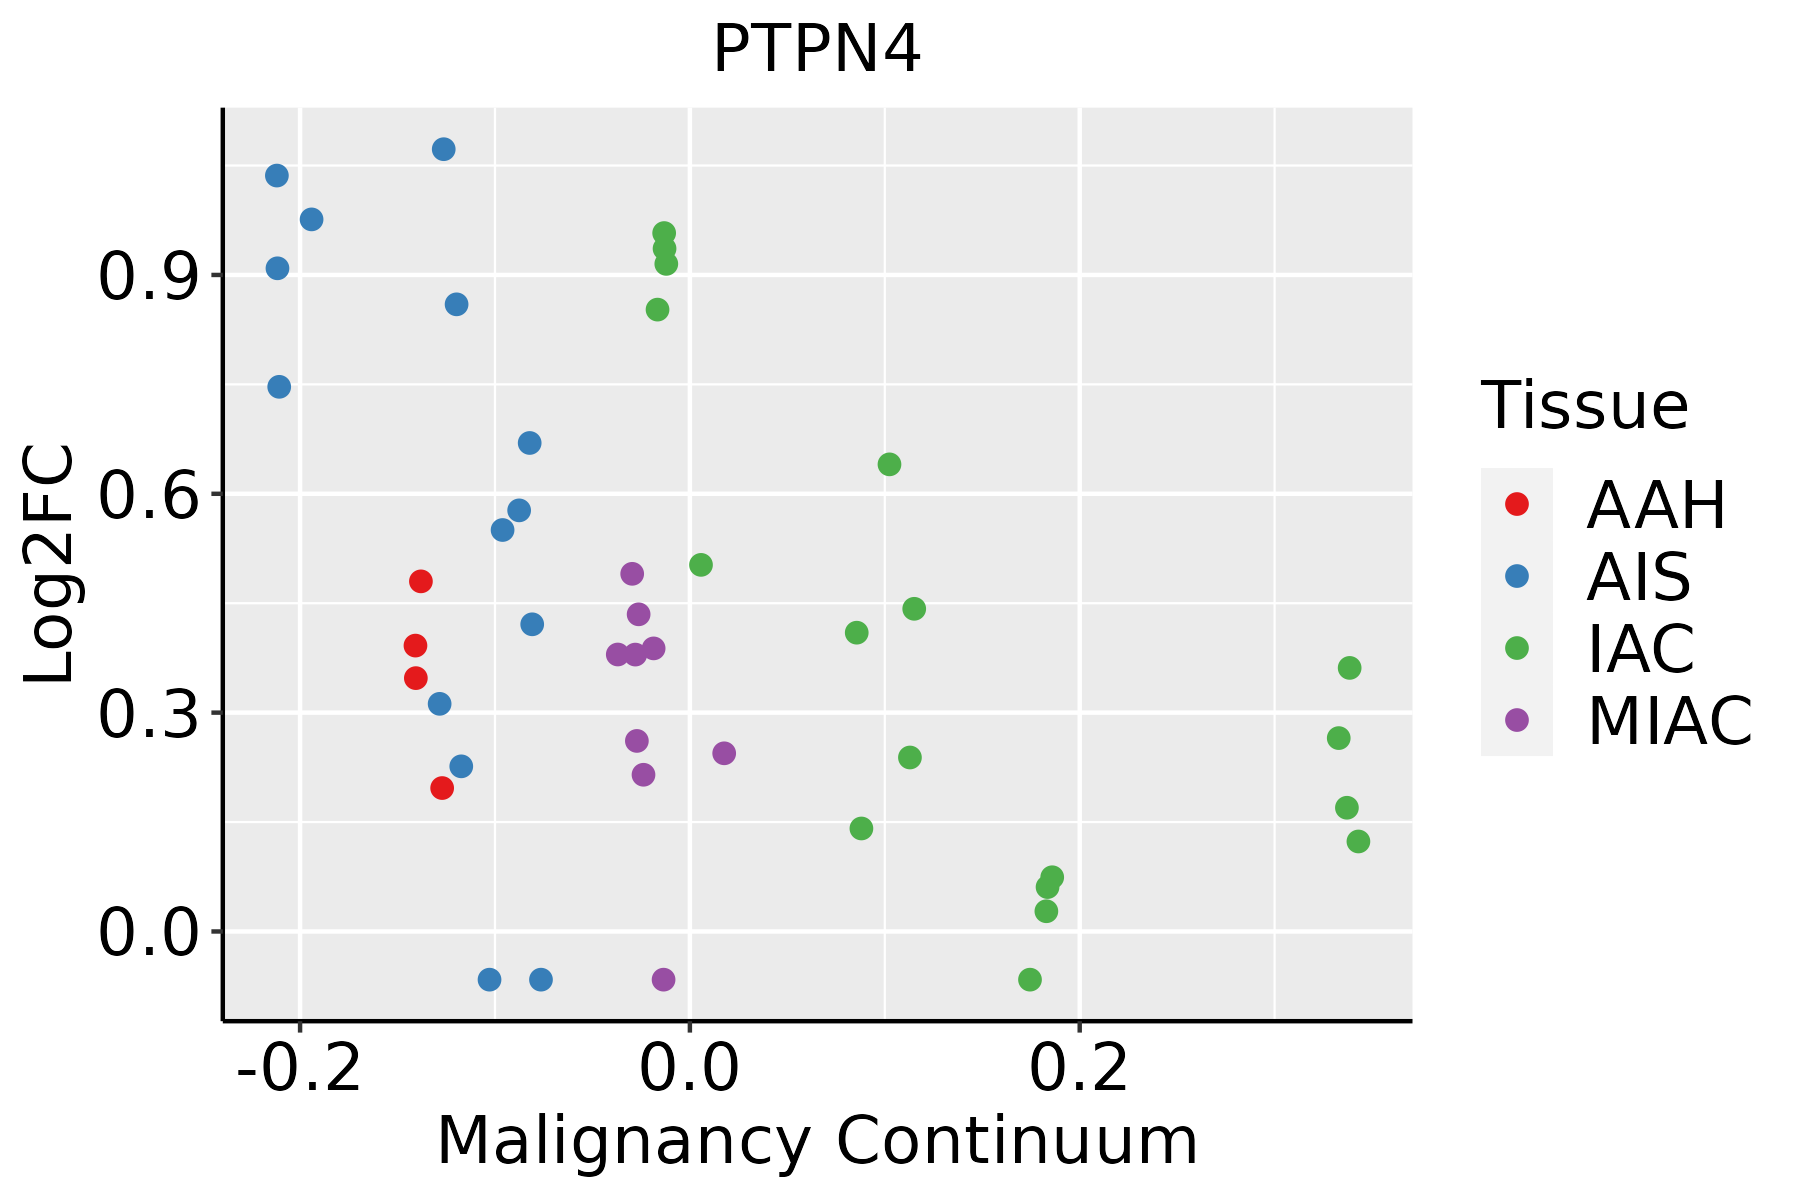 | AAH: Atypical adenomatous hyperplasia |
| AIS: Adenocarcinoma in situ | ||
| IAC: Invasive lung adenocarcinoma | ||
| MIA: Minimally invasive adenocarcinoma | ||
| Thyroid |  | ATC: Anaplastic thyroid cancer |
| HT: Hashimoto's thyroiditis | ||
| PTC: Papillary thyroid cancer |
| ∗log2FC in expression of this searched gene in stem-like cells from each diseased tissue sample relative to stem-like cells in normal samples in each tissue plotted against the malignancy continuum. Samples are colored based on if they are from different disease stage. |
Top |
Malignant transformation related pathway analysis |
| Find out the enriched GO biological processes and KEGG pathways involved in transition from healthy to precancer to cancer |
| Tissue | Disease Stage | Enriched GO biological Processes |
| Colorectum | AD |  |
| Colorectum | SER |  |
| Colorectum | MSS |  |
| Colorectum | MSI-H |  |
| Colorectum | FAP |  |
| ∗Top 15 enriched GO BP terms are showed in the bar plot of each disease state in each tissue. Each row represents a significant GO biological process which is colored according to the -log10(p.adjust). |
| Page: 1 2 3 4 5 6 7 8 9 |
| GO ID | Tissue | Disease Stage | Description | Gene Ratio | Bg Ratio | pvalue | p.adjust | Count |
| GO:00064708 | Cervix | CC | protein dephosphorylation | 60/2311 | 281/18723 | 1.33e-05 | 2.68e-04 | 60 |
| GO:00163117 | Cervix | CC | dephosphorylation | 73/2311 | 417/18723 | 1.23e-03 | 9.87e-03 | 73 |
| GO:0016311 | Colorectum | AD | dephosphorylation | 123/3918 | 417/18723 | 1.84e-05 | 3.82e-04 | 123 |
| GO:0006470 | Colorectum | AD | protein dephosphorylation | 88/3918 | 281/18723 | 2.56e-05 | 4.89e-04 | 88 |
| GO:00064702 | Colorectum | MSS | protein dephosphorylation | 73/3467 | 281/18723 | 1.15e-03 | 1.12e-02 | 73 |
| GO:00163112 | Colorectum | MSS | dephosphorylation | 101/3467 | 417/18723 | 1.98e-03 | 1.70e-02 | 101 |
| GO:00163113 | Colorectum | FAP | dephosphorylation | 95/2622 | 417/18723 | 7.07e-07 | 3.32e-05 | 95 |
| GO:00064704 | Colorectum | FAP | protein dephosphorylation | 69/2622 | 281/18723 | 1.47e-06 | 6.39e-05 | 69 |
| GO:0035335 | Colorectum | FAP | peptidyl-tyrosine dephosphorylation | 23/2622 | 97/18723 | 6.95e-03 | 4.26e-02 | 23 |
| GO:00163114 | Colorectum | CRC | dephosphorylation | 79/2078 | 417/18723 | 1.27e-06 | 7.21e-05 | 79 |
| GO:00064705 | Colorectum | CRC | protein dephosphorylation | 57/2078 | 281/18723 | 4.49e-06 | 1.87e-04 | 57 |
| GO:00064709 | Endometrium | AEH | protein dephosphorylation | 50/2100 | 281/18723 | 6.41e-04 | 6.23e-03 | 50 |
| GO:000647013 | Endometrium | EEC | protein dephosphorylation | 51/2168 | 281/18723 | 7.38e-04 | 7.01e-03 | 51 |
| GO:001631110 | Esophagus | ESCC | dephosphorylation | 251/8552 | 417/18723 | 1.26e-09 | 2.99e-08 | 251 |
| GO:000647018 | Esophagus | ESCC | protein dephosphorylation | 177/8552 | 281/18723 | 3.13e-09 | 6.72e-08 | 177 |
| GO:00163115 | Liver | NAFLD | dephosphorylation | 69/1882 | 417/18723 | 2.27e-05 | 6.23e-04 | 69 |
| GO:00064706 | Liver | NAFLD | protein dephosphorylation | 50/1882 | 281/18723 | 4.53e-05 | 1.09e-03 | 50 |
| GO:000647011 | Liver | Cirrhotic | protein dephosphorylation | 96/4634 | 281/18723 | 2.32e-04 | 2.11e-03 | 96 |
| GO:001631111 | Liver | Cirrhotic | dephosphorylation | 130/4634 | 417/18723 | 1.58e-03 | 1.03e-02 | 130 |
| GO:001631121 | Liver | HCC | dephosphorylation | 230/7958 | 417/18723 | 1.00e-07 | 1.96e-06 | 230 |
| Page: 1 2 |
| Pathway ID | Tissue | Disease Stage | Description | Gene Ratio | Bg Ratio | pvalue | p.adjust | qvalue | Count |
| Page: 1 |
Top |
Cell-cell communication analysis |
| Identification of potential cell-cell interactions between two cell types and their ligand-receptor pairs for different disease states |
| Ligand | Receptor | LRpair | Pathway | Tissue | Disease Stage |
| Page: 1 |
Top |
Single-cell gene regulatory network inference analysis |
| Find out the significant the regulons (TFs) and the target genes of each regulon across cell types for different disease states |
| TF | Cell Type | Tissue | Disease Stage | Target Gene | RSS | Regulon Activity |
| ∗The dot plots of a searched regulon are shown for all cell subpopulations in each disease state of each tissue based on the regulon specific score inferred using pySCENIC and by calculating the average expression. |
| Page: 1 |
Top |
Somatic mutation of malignant transformation related genes |
| Annotation of somatic variants for genes involved in malignant transformation |
| Hugo Symbol | Variant Class | Variant Classification | dbSNP RS | HGVSc | HGVSp | HGVSp Short | SWISSPROT | BIOTYPE | SIFT | PolyPhen | Tumor Sample Barcode | Tissue | Histology | Sex | Age | Stage | Therapy Types | Drugs | Outcome |
| PTPN4 | SNV | Missense_Mutation | rs753446666 | c.2344A>C | p.Thr782Pro | p.T782P | P29074 | protein_coding | tolerated(0.26) | possibly_damaging(0.581) | TCGA-A7-A26G-01 | Breast | breast invasive carcinoma | Female | <65 | I/II | Chemotherapy | taxotere | SD |
| PTPN4 | SNV | Missense_Mutation | c.921N>G | p.Phe307Leu | p.F307L | P29074 | protein_coding | deleterious(0) | probably_damaging(0.997) | TCGA-AC-A23H-01 | Breast | breast invasive carcinoma | Female | >=65 | I/II | Unknown | Unknown | PD | |
| PTPN4 | SNV | Missense_Mutation | rs745743917 | c.2269G>C | p.Glu757Gln | p.E757Q | P29074 | protein_coding | deleterious(0) | probably_damaging(0.997) | TCGA-AN-A0XW-01 | Breast | breast invasive carcinoma | Female | <65 | III/IV | Unknown | Unknown | SD |
| PTPN4 | SNV | Missense_Mutation | c.517N>A | p.Asp173Asn | p.D173N | P29074 | protein_coding | tolerated(0.46) | benign(0.263) | TCGA-AR-A24Q-01 | Breast | breast invasive carcinoma | Female | <65 | I/II | Chemotherapy | doxorubicin | SD | |
| PTPN4 | SNV | Missense_Mutation | rs776699595 | c.1403N>C | p.Lys468Thr | p.K468T | P29074 | protein_coding | tolerated(0.42) | probably_damaging(0.987) | TCGA-BH-A0DH-01 | Breast | breast invasive carcinoma | Female | <65 | I/II | Chemotherapy | cyclophosphamide | SD |
| PTPN4 | SNV | Missense_Mutation | c.1404N>C | p.Lys468Asn | p.K468N | P29074 | protein_coding | tolerated(0.29) | probably_damaging(0.987) | TCGA-BH-A0DH-01 | Breast | breast invasive carcinoma | Female | <65 | I/II | Chemotherapy | cyclophosphamide | SD | |
| PTPN4 | SNV | Missense_Mutation | rs765409271 | c.2624N>G | p.Asn875Ser | p.N875S | P29074 | protein_coding | tolerated(0.2) | benign(0) | TCGA-BH-A0EA-01 | Breast | breast invasive carcinoma | Female | >=65 | I/II | Chemotherapy | taxotere | CR |
| PTPN4 | SNV | Missense_Mutation | novel | c.2679N>T | p.Met893Ile | p.M893I | P29074 | protein_coding | deleterious(0.01) | benign(0.058) | TCGA-C5-A7X5-01 | Cervix | cervical & endocervical cancer | Female | >=65 | I/II | Chemotherapy | carboplatin | PD |
| PTPN4 | SNV | Missense_Mutation | rs536503892 | c.2542N>A | p.Val848Ile | p.V848I | P29074 | protein_coding | tolerated(0.33) | benign(0.001) | TCGA-EA-A3HS-01 | Cervix | cervical & endocervical cancer | Female | <65 | I/II | Unknown | Unknown | SD |
| PTPN4 | SNV | Missense_Mutation | c.1397N>G | p.Pro466Arg | p.P466R | P29074 | protein_coding | tolerated(0.05) | probably_damaging(0.996) | TCGA-EA-A3QE-01 | Cervix | cervical & endocervical cancer | Female | <65 | I/II | Unknown | Unknown | SD |
| Page: 1 2 3 4 5 6 7 8 9 10 11 |
Top |
Related drugs of malignant transformation related genes |
| Identification of chemicals and drugs interact with genes involved in malignant transfromation |
| (DGIdb 4.0) |
| Entrez ID | Symbol | Category | Interaction Types | Drug Claim Name | Drug Name | PMIDs |
| 5775 | PTPN4 | PROTEIN PHOSPHATASE, DRUGGABLE GENOME | ALENDRONATE | ALENDRONIC ACID |
| Page: 1 |

Copyright 2023-Present -The University of Texas Health Science Center at Houston |