
|
|||||
|
 | |
| |
| |
| |
| |
| |
|
Gene: PTPN3 |
Gene summary for PTPN3 |
| Gene information | Species | Human | Gene symbol | PTPN3 | Gene ID | 5774 |
| Gene name | protein tyrosine phosphatase non-receptor type 3 | |
| Gene Alias | PTP-H1 | |
| Cytomap | 9q31.3 | |
| Gene Type | protein-coding | GO ID | GO:0000165 | UniProtAcc | B7Z9V1 |
Top |
Malignant transformation analysis |
| Identification of the aberrant gene expression in precancerous and cancerous lesions by comparing the gene expression of stem-like cells in diseased tissues with normal stem cells |
| Entrez ID | Symbol | Replicates | Species | Organ | Tissue | Adj P-value | Log2FC | Malignancy |
| 5774 | PTPN3 | HTA11_1938_2000001011 | Human | Colorectum | AD | 7.93e-03 | 3.89e-01 | -0.0811 |
| 5774 | PTPN3 | HTA11_347_2000001011 | Human | Colorectum | AD | 5.13e-05 | 4.35e-01 | -0.1954 |
| 5774 | PTPN3 | HTA11_1391_2000001011 | Human | Colorectum | AD | 3.20e-04 | 6.31e-01 | -0.059 |
| 5774 | PTPN3 | HTA11_99999965104_69814 | Human | Colorectum | MSS | 2.61e-11 | 8.21e-01 | 0.281 |
| 5774 | PTPN3 | A015-C-203 | Human | Colorectum | FAP | 2.11e-17 | -3.26e-01 | -0.1294 |
| 5774 | PTPN3 | A002-C-201 | Human | Colorectum | FAP | 7.50e-09 | -3.25e-01 | 0.0324 |
| 5774 | PTPN3 | A002-C-203 | Human | Colorectum | FAP | 1.93e-02 | -3.41e-02 | 0.2786 |
| 5774 | PTPN3 | A001-C-119 | Human | Colorectum | FAP | 2.80e-07 | -4.21e-01 | -0.1557 |
| 5774 | PTPN3 | A001-C-108 | Human | Colorectum | FAP | 7.78e-09 | -1.66e-01 | -0.0272 |
| 5774 | PTPN3 | A002-C-205 | Human | Colorectum | FAP | 1.96e-15 | -3.47e-01 | -0.1236 |
| 5774 | PTPN3 | A015-C-006 | Human | Colorectum | FAP | 2.87e-08 | -2.94e-01 | -0.0994 |
| 5774 | PTPN3 | A015-C-106 | Human | Colorectum | FAP | 1.95e-06 | -7.05e-02 | -0.0511 |
| 5774 | PTPN3 | A002-C-114 | Human | Colorectum | FAP | 7.54e-13 | -4.05e-01 | -0.1561 |
| 5774 | PTPN3 | A015-C-104 | Human | Colorectum | FAP | 1.27e-18 | -2.95e-01 | -0.1899 |
| 5774 | PTPN3 | A001-C-014 | Human | Colorectum | FAP | 3.42e-08 | -1.52e-01 | 0.0135 |
| 5774 | PTPN3 | A002-C-016 | Human | Colorectum | FAP | 1.38e-19 | -2.87e-01 | 0.0521 |
| 5774 | PTPN3 | A015-C-002 | Human | Colorectum | FAP | 8.32e-10 | -5.03e-01 | -0.0763 |
| 5774 | PTPN3 | A001-C-203 | Human | Colorectum | FAP | 5.95e-06 | -3.68e-02 | -0.0481 |
| 5774 | PTPN3 | A002-C-116 | Human | Colorectum | FAP | 9.81e-26 | -3.58e-01 | -0.0452 |
| 5774 | PTPN3 | A014-C-008 | Human | Colorectum | FAP | 3.93e-07 | -2.55e-01 | -0.191 |
| Page: 1 2 3 4 |
| Tissue | Expression Dynamics | Abbreviation |
| Colorectum (GSE201348) |  | FAP: Familial adenomatous polyposis |
| CRC: Colorectal cancer | ||
| Colorectum (HTA11) |  | AD: Adenomas |
| SER: Sessile serrated lesions | ||
| MSI-H: Microsatellite-high colorectal cancer | ||
| MSS: Microsatellite stable colorectal cancer | ||
| Liver | 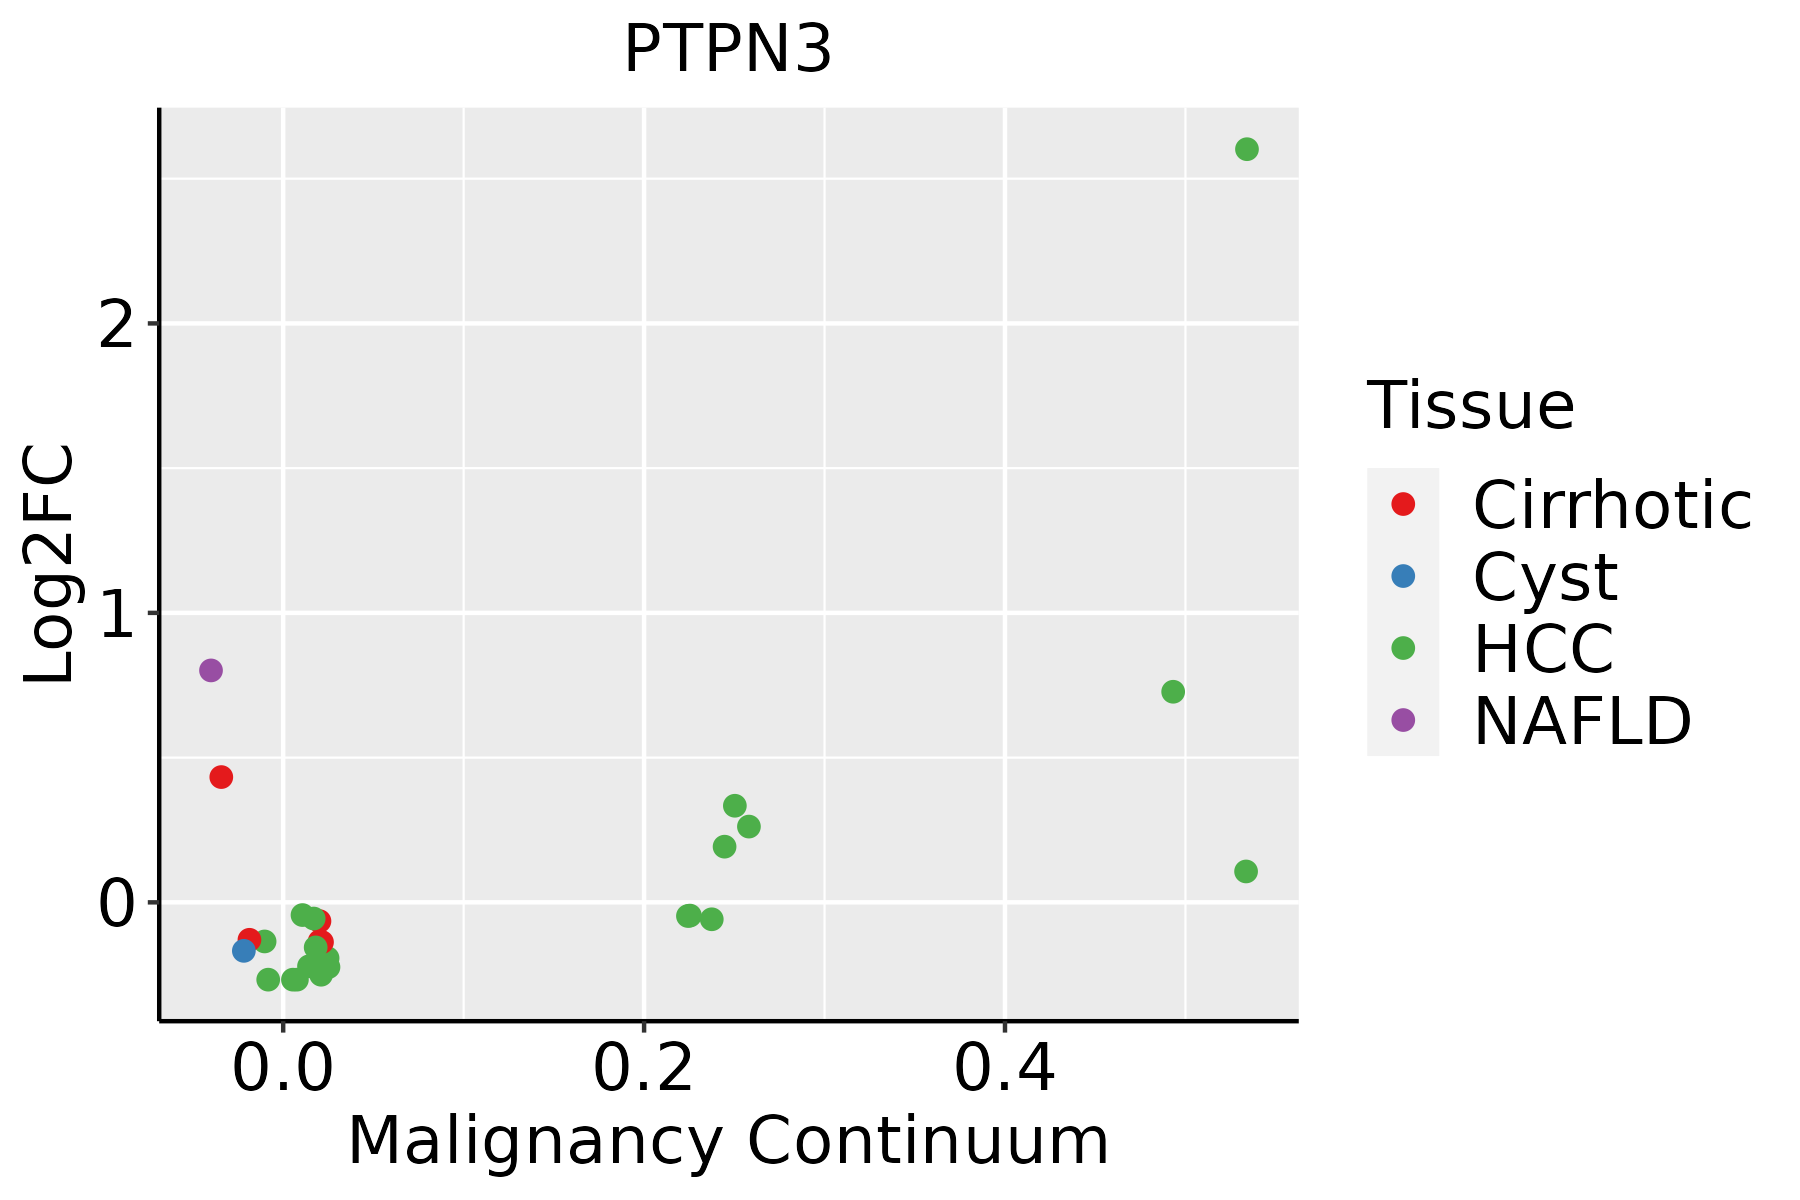 | HCC: Hepatocellular carcinoma |
| NAFLD: Non-alcoholic fatty liver disease | ||
| Oral Cavity |  | EOLP: Erosive Oral lichen planus |
| LP: leukoplakia | ||
| NEOLP: Non-erosive oral lichen planus | ||
| OSCC: Oral squamous cell carcinoma | ||
| Prostate |  | BPH: Benign Prostatic Hyperplasia |
| Thyroid |  | ATC: Anaplastic thyroid cancer |
| HT: Hashimoto's thyroiditis | ||
| PTC: Papillary thyroid cancer |
| ∗log2FC in expression of this searched gene in stem-like cells from each diseased tissue sample relative to stem-like cells in normal samples in each tissue plotted against the malignancy continuum. Samples are colored based on if they are from different disease stage. |
Top |
Malignant transformation related pathway analysis |
| Find out the enriched GO biological processes and KEGG pathways involved in transition from healthy to precancer to cancer |
| Tissue | Disease Stage | Enriched GO biological Processes |
| Colorectum | AD |  |
| Colorectum | SER |  |
| Colorectum | MSS |  |
| Colorectum | MSI-H |  |
| Colorectum | FAP |  |
| ∗Top 15 enriched GO BP terms are showed in the bar plot of each disease state in each tissue. Each row represents a significant GO biological process which is colored according to the -log10(p.adjust). |
| Page: 1 2 3 4 5 6 7 8 9 |
| GO ID | Tissue | Disease Stage | Description | Gene Ratio | Bg Ratio | pvalue | p.adjust | Count |
| GO:0042176 | Colorectum | AD | regulation of protein catabolic process | 160/3918 | 391/18723 | 1.06e-19 | 7.34e-17 | 160 |
| GO:0009895 | Colorectum | AD | negative regulation of catabolic process | 124/3918 | 320/18723 | 1.66e-13 | 3.35e-11 | 124 |
| GO:0031330 | Colorectum | AD | negative regulation of cellular catabolic process | 104/3918 | 262/18723 | 2.66e-12 | 3.96e-10 | 104 |
| GO:0048732 | Colorectum | AD | gland development | 149/3918 | 436/18723 | 6.07e-11 | 6.33e-09 | 149 |
| GO:0038127 | Colorectum | AD | ERBB signaling pathway | 55/3918 | 121/18723 | 1.19e-09 | 8.85e-08 | 55 |
| GO:0042177 | Colorectum | AD | negative regulation of protein catabolic process | 55/3918 | 121/18723 | 1.19e-09 | 8.85e-08 | 55 |
| GO:0007173 | Colorectum | AD | epidermal growth factor receptor signaling pathway | 50/3918 | 108/18723 | 3.08e-09 | 2.07e-07 | 50 |
| GO:1901185 | Colorectum | AD | negative regulation of ERBB signaling pathway | 19/3918 | 32/18723 | 2.39e-06 | 6.98e-05 | 19 |
| GO:0061008 | Colorectum | AD | hepaticobiliary system development | 55/3918 | 150/18723 | 6.34e-06 | 1.59e-04 | 55 |
| GO:0001889 | Colorectum | AD | liver development | 54/3918 | 147/18723 | 7.20e-06 | 1.77e-04 | 54 |
| GO:1901184 | Colorectum | AD | regulation of ERBB signaling pathway | 34/3918 | 79/18723 | 7.46e-06 | 1.82e-04 | 34 |
| GO:0016311 | Colorectum | AD | dephosphorylation | 123/3918 | 417/18723 | 1.84e-05 | 3.82e-04 | 123 |
| GO:0045861 | Colorectum | AD | negative regulation of proteolysis | 106/3918 | 351/18723 | 2.33e-05 | 4.57e-04 | 106 |
| GO:0006470 | Colorectum | AD | protein dephosphorylation | 88/3918 | 281/18723 | 2.56e-05 | 4.89e-04 | 88 |
| GO:0042058 | Colorectum | AD | regulation of epidermal growth factor receptor signaling pathway | 31/3918 | 73/18723 | 2.56e-05 | 4.89e-04 | 31 |
| GO:0002028 | Colorectum | AD | regulation of sodium ion transport | 36/3918 | 90/18723 | 2.89e-05 | 5.37e-04 | 36 |
| GO:0042059 | Colorectum | AD | negative regulation of epidermal growth factor receptor signaling pathway | 16/3918 | 28/18723 | 2.96e-05 | 5.46e-04 | 16 |
| GO:0097421 | Colorectum | AD | liver regeneration | 18/3918 | 35/18723 | 6.33e-05 | 1.05e-03 | 18 |
| GO:1902305 | Colorectum | AD | regulation of sodium ion transmembrane transport | 27/3918 | 68/18723 | 3.19e-04 | 3.80e-03 | 27 |
| GO:2000649 | Colorectum | AD | regulation of sodium ion transmembrane transporter activity | 23/3918 | 58/18723 | 8.82e-04 | 8.53e-03 | 23 |
| Page: 1 2 3 4 5 6 7 8 9 10 11 12 13 14 15 |
| Pathway ID | Tissue | Disease Stage | Description | Gene Ratio | Bg Ratio | pvalue | p.adjust | qvalue | Count |
| Page: 1 |
Top |
Cell-cell communication analysis |
| Identification of potential cell-cell interactions between two cell types and their ligand-receptor pairs for different disease states |
| Ligand | Receptor | LRpair | Pathway | Tissue | Disease Stage |
| Page: 1 |
Top |
Single-cell gene regulatory network inference analysis |
| Find out the significant the regulons (TFs) and the target genes of each regulon across cell types for different disease states |
| TF | Cell Type | Tissue | Disease Stage | Target Gene | RSS | Regulon Activity |
| ∗The dot plots of a searched regulon are shown for all cell subpopulations in each disease state of each tissue based on the regulon specific score inferred using pySCENIC and by calculating the average expression. |
| Page: 1 |
Top |
Somatic mutation of malignant transformation related genes |
| Annotation of somatic variants for genes involved in malignant transformation |
| Hugo Symbol | Variant Class | Variant Classification | dbSNP RS | HGVSc | HGVSp | HGVSp Short | SWISSPROT | BIOTYPE | SIFT | PolyPhen | Tumor Sample Barcode | Tissue | Histology | Sex | Age | Stage | Therapy Types | Drugs | Outcome |
| PTPN3 | SNV | Missense_Mutation | novel | c.1734N>A | p.Phe578Leu | p.F578L | P26045 | protein_coding | tolerated(0.21) | benign(0.267) | TCGA-A2-A0CL-01 | Breast | breast invasive carcinoma | Female | <65 | III/IV | Chemotherapy | cytoxan | SD |
| PTPN3 | SNV | Missense_Mutation | rs750440450 | c.2231N>T | p.Thr744Met | p.T744M | P26045 | protein_coding | deleterious(0) | probably_damaging(1) | TCGA-A2-A1FV-01 | Breast | breast invasive carcinoma | Female | >=65 | I/II | Chemotherapy | cyclophosphamide | SD |
| PTPN3 | SNV | Missense_Mutation | rs200472346 | c.406N>A | p.Glu136Lys | p.E136K | P26045 | protein_coding | tolerated(0.09) | possibly_damaging(0.851) | TCGA-AN-A046-01 | Breast | breast invasive carcinoma | Female | >=65 | I/II | Unknown | Unknown | SD |
| PTPN3 | SNV | Missense_Mutation | c.2488T>C | p.Ser830Pro | p.S830P | P26045 | protein_coding | tolerated(0.4) | benign(0.003) | TCGA-B6-A0RS-01 | Breast | breast invasive carcinoma | Female | <65 | I/II | Unknown | Unknown | PD | |
| PTPN3 | SNV | Missense_Mutation | c.1750N>C | p.Glu584Gln | p.E584Q | P26045 | protein_coding | deleterious(0) | possibly_damaging(0.491) | TCGA-D8-A1J8-01 | Breast | breast invasive carcinoma | Female | >=65 | I/II | Hormone Therapy | nolvadex | SD | |
| PTPN3 | deletion | Frame_Shift_Del | novel | c.170_174delNNNNN | p.Met57ThrfsTer8 | p.M57Tfs*8 | P26045 | protein_coding | TCGA-AC-A3QQ-01 | Breast | breast invasive carcinoma | Female | <65 | I/II | Unknown | Unknown | SD | ||
| PTPN3 | deletion | Frame_Shift_Del | novel | c.2191delN | p.Val731LeufsTer13 | p.V731Lfs*13 | P26045 | protein_coding | TCGA-D8-A27V-01 | Breast | breast invasive carcinoma | Female | <65 | I/II | Hormone Therapy | tamoxiphen | SD | ||
| PTPN3 | SNV | Missense_Mutation | rs547988784 | c.113N>A | p.Gly38Asp | p.G38D | P26045 | protein_coding | tolerated(0.68) | benign(0.398) | TCGA-2W-A8YY-01 | Cervix | cervical & endocervical cancer | Female | <65 | I/II | Chemotherapy | cisplatin | CR |
| PTPN3 | SNV | Missense_Mutation | c.538N>G | p.Gln180Glu | p.Q180E | P26045 | protein_coding | deleterious(0) | probably_damaging(0.983) | TCGA-C5-A1BK-01 | Cervix | cervical & endocervical cancer | Female | <65 | I/II | Unknown | Unknown | SD | |
| PTPN3 | SNV | Missense_Mutation | rs200472346 | c.406G>A | p.Glu136Lys | p.E136K | P26045 | protein_coding | tolerated(0.09) | possibly_damaging(0.851) | TCGA-FU-A3HZ-01 | Cervix | cervical & endocervical cancer | Female | <65 | I/II | Chemotherapy | cisplatin | CR |
| Page: 1 2 3 4 5 6 7 8 9 10 11 |
Top |
Related drugs of malignant transformation related genes |
| Identification of chemicals and drugs interact with genes involved in malignant transfromation |
| (DGIdb 4.0) |
| Entrez ID | Symbol | Category | Interaction Types | Drug Claim Name | Drug Name | PMIDs |
| Page: 1 |

Copyright 2023-Present -The University of Texas Health Science Center at Houston |