
|
|||||
|
 | |
| |
| |
| |
| |
| |
|
Gene: PTPN23 |
Gene summary for PTPN23 |
| Gene information | Species | Human | Gene symbol | PTPN23 | Gene ID | 25930 |
| Gene name | protein tyrosine phosphatase non-receptor type 23 | |
| Gene Alias | HD-PTP | |
| Cytomap | 3p21.31 | |
| Gene Type | protein-coding | GO ID | GO:0001667 | UniProtAcc | B4DST5 |
Top |
Malignant transformation analysis |
| Identification of the aberrant gene expression in precancerous and cancerous lesions by comparing the gene expression of stem-like cells in diseased tissues with normal stem cells |
| Entrez ID | Symbol | Replicates | Species | Organ | Tissue | Adj P-value | Log2FC | Malignancy |
| 25930 | PTPN23 | LZE2T | Human | Esophagus | ESCC | 1.28e-02 | 3.54e-01 | 0.082 |
| 25930 | PTPN23 | LZE4T | Human | Esophagus | ESCC | 2.68e-02 | 3.83e-02 | 0.0811 |
| 25930 | PTPN23 | LZE24T | Human | Esophagus | ESCC | 1.32e-10 | 1.78e-01 | 0.0596 |
| 25930 | PTPN23 | LZE21T | Human | Esophagus | ESCC | 1.82e-02 | 1.21e-01 | 0.0655 |
| 25930 | PTPN23 | P4T-E | Human | Esophagus | ESCC | 9.69e-09 | 6.12e-02 | 0.1323 |
| 25930 | PTPN23 | P5T-E | Human | Esophagus | ESCC | 4.38e-04 | 3.57e-02 | 0.1327 |
| 25930 | PTPN23 | P8T-E | Human | Esophagus | ESCC | 3.78e-12 | 1.77e-01 | 0.0889 |
| 25930 | PTPN23 | P9T-E | Human | Esophagus | ESCC | 1.04e-14 | 1.15e-01 | 0.1131 |
| 25930 | PTPN23 | P10T-E | Human | Esophagus | ESCC | 5.11e-06 | 9.98e-02 | 0.116 |
| 25930 | PTPN23 | P11T-E | Human | Esophagus | ESCC | 3.47e-05 | 2.05e-01 | 0.1426 |
| 25930 | PTPN23 | P12T-E | Human | Esophagus | ESCC | 6.00e-09 | 1.37e-01 | 0.1122 |
| 25930 | PTPN23 | P15T-E | Human | Esophagus | ESCC | 5.51e-09 | 1.47e-01 | 0.1149 |
| 25930 | PTPN23 | P16T-E | Human | Esophagus | ESCC | 1.72e-08 | 6.37e-02 | 0.1153 |
| 25930 | PTPN23 | P17T-E | Human | Esophagus | ESCC | 2.33e-03 | 1.29e-01 | 0.1278 |
| 25930 | PTPN23 | P20T-E | Human | Esophagus | ESCC | 4.69e-07 | 9.15e-02 | 0.1124 |
| 25930 | PTPN23 | P21T-E | Human | Esophagus | ESCC | 5.98e-12 | 2.62e-01 | 0.1617 |
| 25930 | PTPN23 | P22T-E | Human | Esophagus | ESCC | 5.90e-06 | 8.76e-02 | 0.1236 |
| 25930 | PTPN23 | P23T-E | Human | Esophagus | ESCC | 1.33e-16 | 1.39e-01 | 0.108 |
| 25930 | PTPN23 | P24T-E | Human | Esophagus | ESCC | 1.64e-10 | 1.68e-01 | 0.1287 |
| 25930 | PTPN23 | P26T-E | Human | Esophagus | ESCC | 3.65e-04 | 1.14e-01 | 0.1276 |
| Page: 1 2 3 4 |
| Tissue | Expression Dynamics | Abbreviation |
| Esophagus | 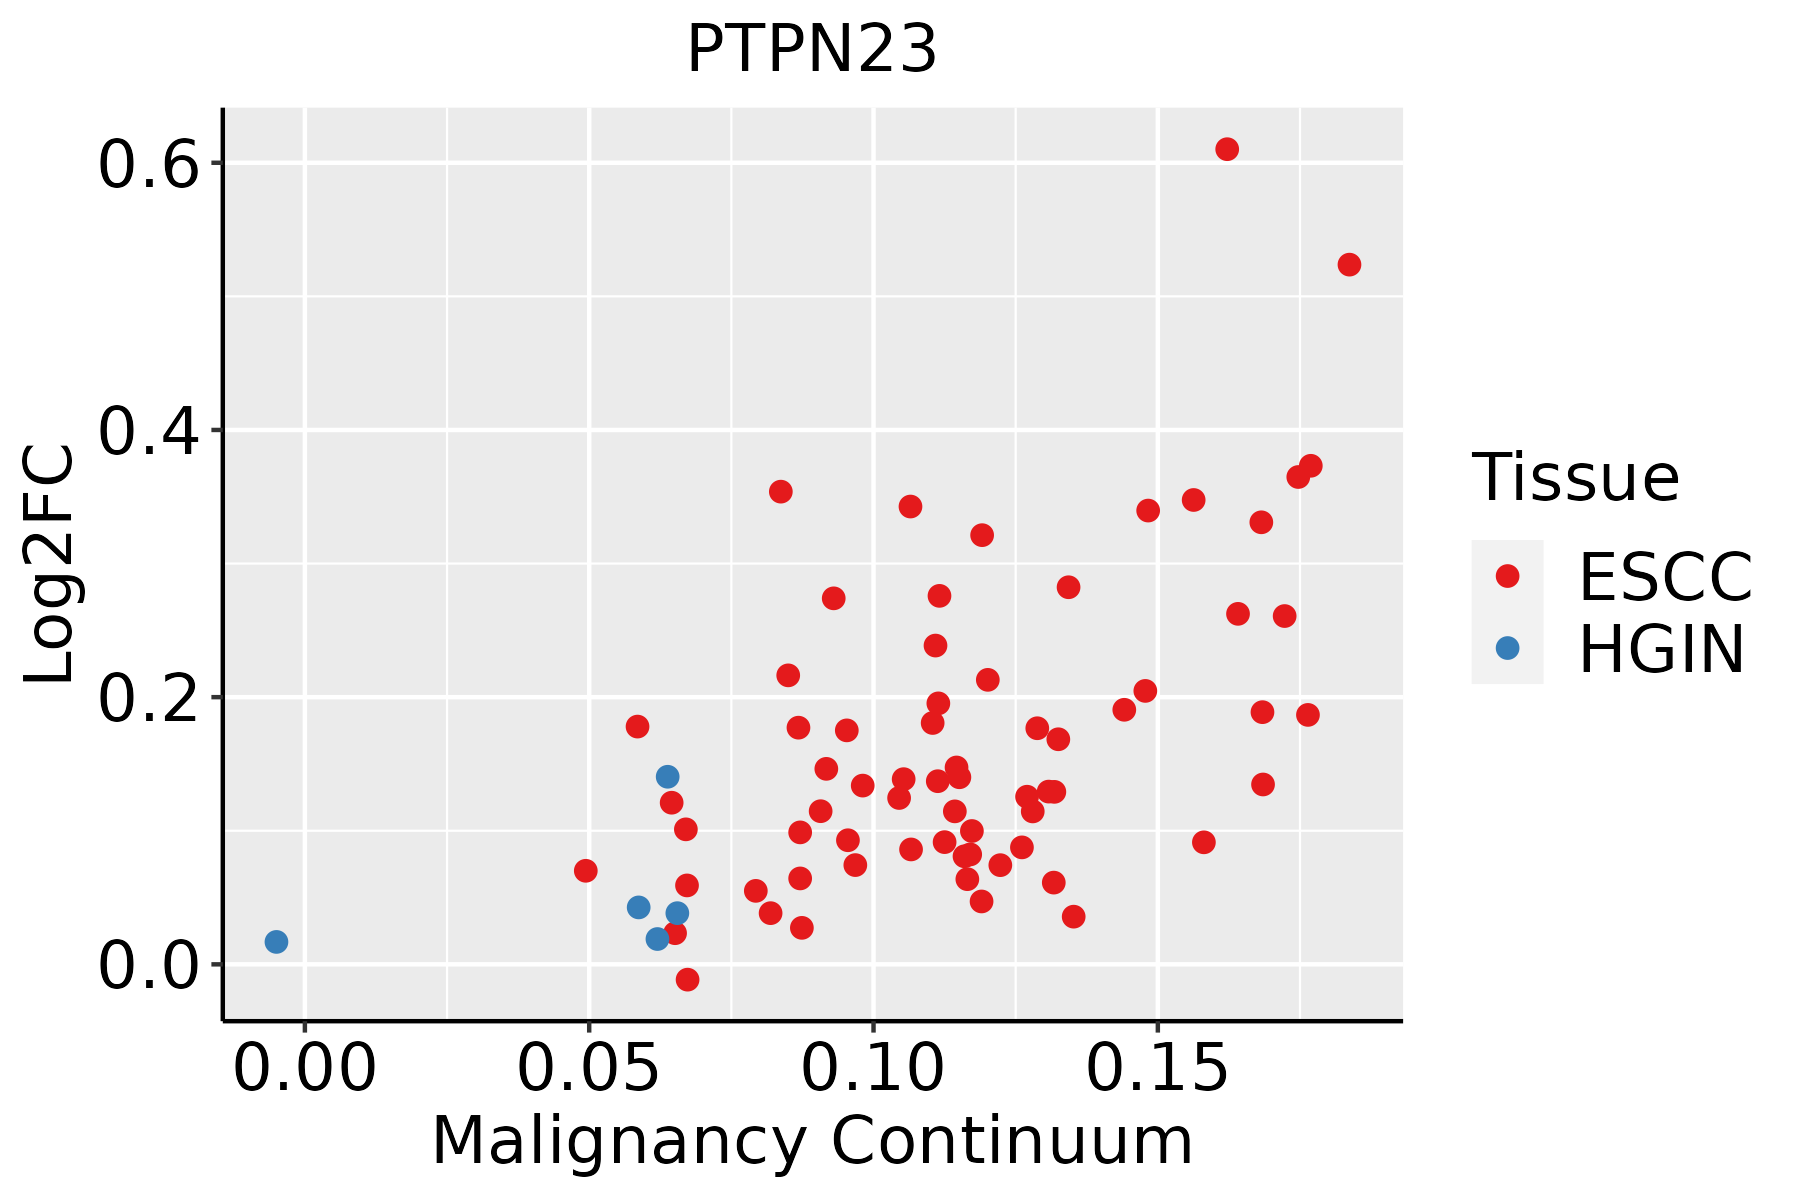 | ESCC: Esophageal squamous cell carcinoma |
| HGIN: High-grade intraepithelial neoplasias | ||
| LGIN: Low-grade intraepithelial neoplasias | ||
| Liver |  | HCC: Hepatocellular carcinoma |
| NAFLD: Non-alcoholic fatty liver disease |
| ∗log2FC in expression of this searched gene in stem-like cells from each diseased tissue sample relative to stem-like cells in normal samples in each tissue plotted against the malignancy continuum. Samples are colored based on if they are from different disease stage. |
Top |
Malignant transformation related pathway analysis |
| Find out the enriched GO biological processes and KEGG pathways involved in transition from healthy to precancer to cancer |
| Tissue | Disease Stage | Enriched GO biological Processes |
| Colorectum | AD |  |
| Colorectum | SER |  |
| Colorectum | MSS |  |
| Colorectum | MSI-H |  |
| Colorectum | FAP |  |
| ∗Top 15 enriched GO BP terms are showed in the bar plot of each disease state in each tissue. Each row represents a significant GO biological process which is colored according to the -log10(p.adjust). |
| Page: 1 2 3 4 5 6 7 8 9 |
| GO ID | Tissue | Disease Stage | Description | Gene Ratio | Bg Ratio | pvalue | p.adjust | Count |
| GO:003238618 | Esophagus | ESCC | regulation of intracellular transport | 243/8552 | 337/18723 | 3.20e-23 | 7.25e-21 | 243 |
| GO:0032388110 | Esophagus | ESCC | positive regulation of intracellular transport | 152/8552 | 202/18723 | 7.89e-18 | 7.36e-16 | 152 |
| GO:001619715 | Esophagus | ESCC | endosomal transport | 168/8552 | 230/18723 | 2.28e-17 | 1.93e-15 | 168 |
| GO:1904951111 | Esophagus | ESCC | positive regulation of establishment of protein localization | 216/8552 | 319/18723 | 1.01e-15 | 6.86e-14 | 216 |
| GO:0051222111 | Esophagus | ESCC | positive regulation of protein transport | 204/8552 | 303/18723 | 1.56e-14 | 8.38e-13 | 204 |
| GO:001648210 | Esophagus | ESCC | cytosolic transport | 124/8552 | 168/18723 | 9.69e-14 | 4.69e-12 | 124 |
| GO:009887615 | Esophagus | ESCC | vesicle-mediated transport to the plasma membrane | 99/8552 | 136/18723 | 1.13e-10 | 3.39e-09 | 99 |
| GO:019873817 | Esophagus | ESCC | cell-cell signaling by wnt | 269/8552 | 446/18723 | 2.41e-10 | 6.79e-09 | 269 |
| GO:001631110 | Esophagus | ESCC | dephosphorylation | 251/8552 | 417/18723 | 1.26e-09 | 2.99e-08 | 251 |
| GO:000647018 | Esophagus | ESCC | protein dephosphorylation | 177/8552 | 281/18723 | 3.13e-09 | 6.72e-08 | 177 |
| GO:004578527 | Esophagus | ESCC | positive regulation of cell adhesion | 255/8552 | 437/18723 | 5.07e-08 | 9.11e-07 | 255 |
| GO:00989278 | Esophagus | ESCC | vesicle-mediated transport between endosomal compartments | 36/8552 | 43/18723 | 2.90e-07 | 4.20e-06 | 36 |
| GO:00450226 | Esophagus | ESCC | early endosome to late endosome transport | 33/8552 | 40/18723 | 1.80e-06 | 2.11e-05 | 33 |
| GO:00324565 | Esophagus | ESCC | endocytic recycling | 51/8552 | 73/18723 | 2.47e-05 | 2.10e-04 | 51 |
| GO:00431623 | Esophagus | ESCC | ubiquitin-dependent protein catabolic process via the multivesicular body sorting pathway | 19/8552 | 23/18723 | 3.12e-04 | 1.85e-03 | 19 |
| GO:19036496 | Esophagus | ESCC | regulation of cytoplasmic transport | 22/8552 | 28/18723 | 3.95e-04 | 2.26e-03 | 22 |
| GO:002240720 | Esophagus | ESCC | regulation of cell-cell adhesion | 239/8552 | 448/18723 | 5.88e-04 | 3.19e-03 | 239 |
| GO:004521620 | Esophagus | ESCC | cell-cell junction organization | 114/8552 | 200/18723 | 8.04e-04 | 4.16e-03 | 114 |
| GO:20006413 | Esophagus | ESCC | regulation of early endosome to late endosome transport | 15/8552 | 18/18723 | 1.20e-03 | 5.88e-03 | 15 |
| GO:000166720 | Esophagus | ESCC | ameboidal-type cell migration | 250/8552 | 475/18723 | 1.22e-03 | 5.97e-03 | 250 |
| Page: 1 2 3 |
| Pathway ID | Tissue | Disease Stage | Description | Gene Ratio | Bg Ratio | pvalue | p.adjust | qvalue | Count |
| Page: 1 |
Top |
Cell-cell communication analysis |
| Identification of potential cell-cell interactions between two cell types and their ligand-receptor pairs for different disease states |
| Ligand | Receptor | LRpair | Pathway | Tissue | Disease Stage |
| Page: 1 |
Top |
Single-cell gene regulatory network inference analysis |
| Find out the significant the regulons (TFs) and the target genes of each regulon across cell types for different disease states |
| TF | Cell Type | Tissue | Disease Stage | Target Gene | RSS | Regulon Activity |
| ∗The dot plots of a searched regulon are shown for all cell subpopulations in each disease state of each tissue based on the regulon specific score inferred using pySCENIC and by calculating the average expression. |
| Page: 1 |
Top |
Somatic mutation of malignant transformation related genes |
| Annotation of somatic variants for genes involved in malignant transformation |
| Hugo Symbol | Variant Class | Variant Classification | dbSNP RS | HGVSc | HGVSp | HGVSp Short | SWISSPROT | BIOTYPE | SIFT | PolyPhen | Tumor Sample Barcode | Tissue | Histology | Sex | Age | Stage | Therapy Types | Drugs | Outcome |
| PTPN23 | SNV | Missense_Mutation | c.1990N>C | p.Ala664Pro | p.A664P | Q9H3S7 | protein_coding | deleterious(0) | probably_damaging(0.993) | TCGA-A7-A13G-01 | Breast | breast invasive carcinoma | Female | >=65 | I/II | Hormone Therapy | arimidex | PD | |
| PTPN23 | SNV | Missense_Mutation | c.1987N>A | p.Glu663Lys | p.E663K | Q9H3S7 | protein_coding | deleterious(0) | possibly_damaging(0.82) | TCGA-AC-A23H-01 | Breast | breast invasive carcinoma | Female | >=65 | I/II | Unknown | Unknown | PD | |
| PTPN23 | SNV | Missense_Mutation | rs746807105 | c.1609N>T | p.Arg537Trp | p.R537W | Q9H3S7 | protein_coding | deleterious(0) | probably_damaging(0.981) | TCGA-AN-A0AK-01 | Breast | breast invasive carcinoma | Female | >=65 | I/II | Unknown | Unknown | SD |
| PTPN23 | SNV | Missense_Mutation | rs755103681 | c.3709N>T | p.Arg1237Cys | p.R1237C | Q9H3S7 | protein_coding | deleterious(0.05) | possibly_damaging(0.877) | TCGA-AO-A128-01 | Breast | breast invasive carcinoma | Female | <65 | I/II | Chemotherapy | doxorubicin | SD |
| PTPN23 | SNV | Missense_Mutation | c.3610C>G | p.His1204Asp | p.H1204D | Q9H3S7 | protein_coding | deleterious(0) | benign(0.003) | TCGA-E2-A1LH-01 | Breast | breast invasive carcinoma | Female | <65 | I/II | Chemotherapy | adriamycin | SD | |
| PTPN23 | SNV | Missense_Mutation | novel | c.1067N>C | p.Ile356Thr | p.I356T | Q9H3S7 | protein_coding | deleterious(0) | probably_damaging(0.934) | TCGA-PE-A5DC-01 | Breast | breast invasive carcinoma | Female | >=65 | III/IV | Unknown | Unknown | SD |
| PTPN23 | SNV | Missense_Mutation | rs150002416 | c.1579C>T | p.Arg527Cys | p.R527C | Q9H3S7 | protein_coding | deleterious(0) | probably_damaging(0.994) | TCGA-2W-A8YY-01 | Cervix | cervical & endocervical cancer | Female | <65 | I/II | Chemotherapy | cisplatin | CR |
| PTPN23 | SNV | Missense_Mutation | c.436C>T | p.His146Tyr | p.H146Y | Q9H3S7 | protein_coding | deleterious(0) | probably_damaging(0.997) | TCGA-Q1-A73O-01 | Cervix | cervical & endocervical cancer | Female | <65 | I/II | Chemotherapy | cisplatin | CR | |
| PTPN23 | SNV | Missense_Mutation | c.428N>T | p.Ser143Phe | p.S143F | Q9H3S7 | protein_coding | deleterious(0) | probably_damaging(1) | TCGA-A6-4107-01 | Colorectum | colon adenocarcinoma | Female | <65 | III/IV | Chemotherapy | 5 | SD | |
| PTPN23 | SNV | Missense_Mutation | rs547301372 | c.2098N>T | p.Arg700Cys | p.R700C | Q9H3S7 | protein_coding | tolerated(0.08) | probably_damaging(0.939) | TCGA-A6-5665-01 | Colorectum | colon adenocarcinoma | Female | >=65 | I/II | Unknown | Unknown | PD |
| Page: 1 2 3 4 5 6 7 8 9 10 11 |
Top |
Related drugs of malignant transformation related genes |
| Identification of chemicals and drugs interact with genes involved in malignant transfromation |
| (DGIdb 4.0) |
| Entrez ID | Symbol | Category | Interaction Types | Drug Claim Name | Drug Name | PMIDs |
| Page: 1 |

Copyright 2023-Present -The University of Texas Health Science Center at Houston |