| Tissue | Expression Dynamics | Abbreviation |
| Cervix | 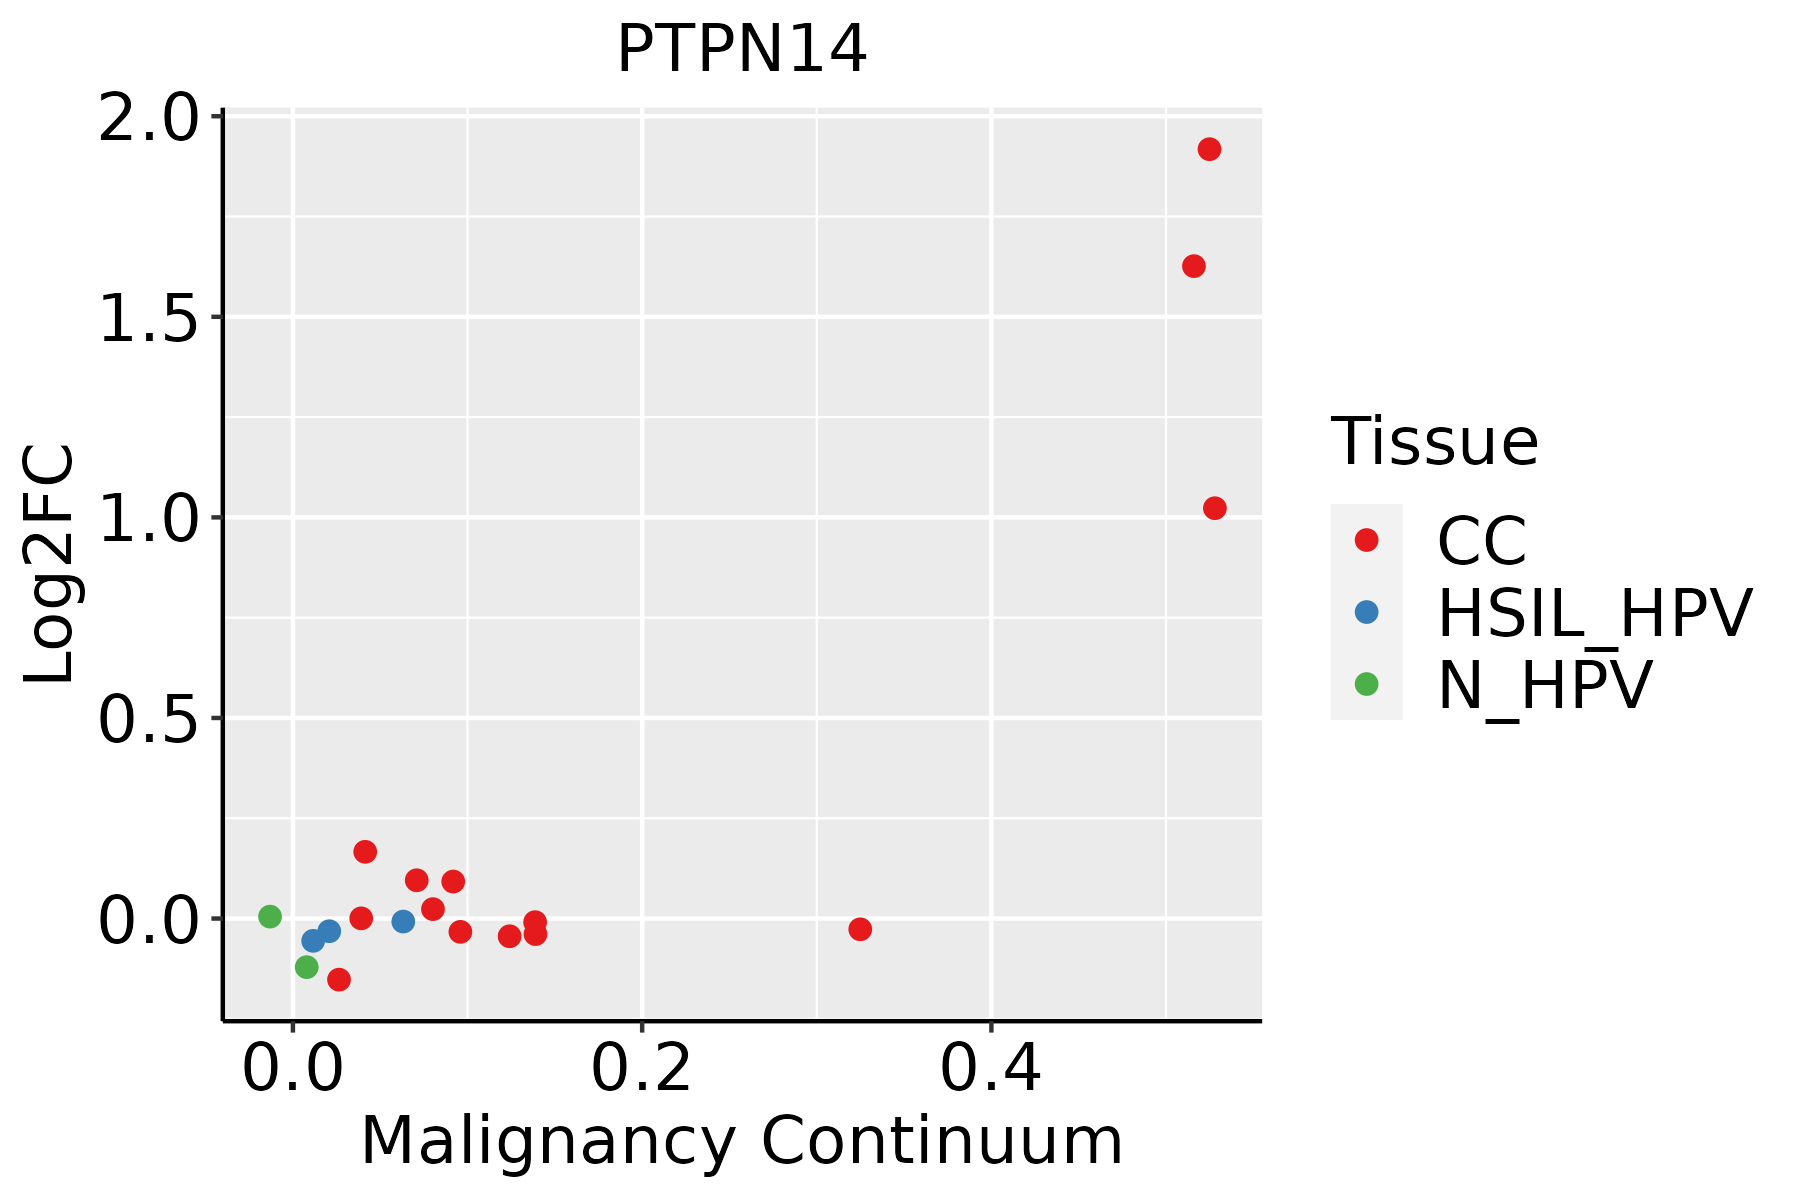 | CC: Cervix cancer |
| HSIL_HPV: HPV-infected high-grade squamous intraepithelial lesions |
| N_HPV: HPV-infected normal cervix |
| Endometrium | 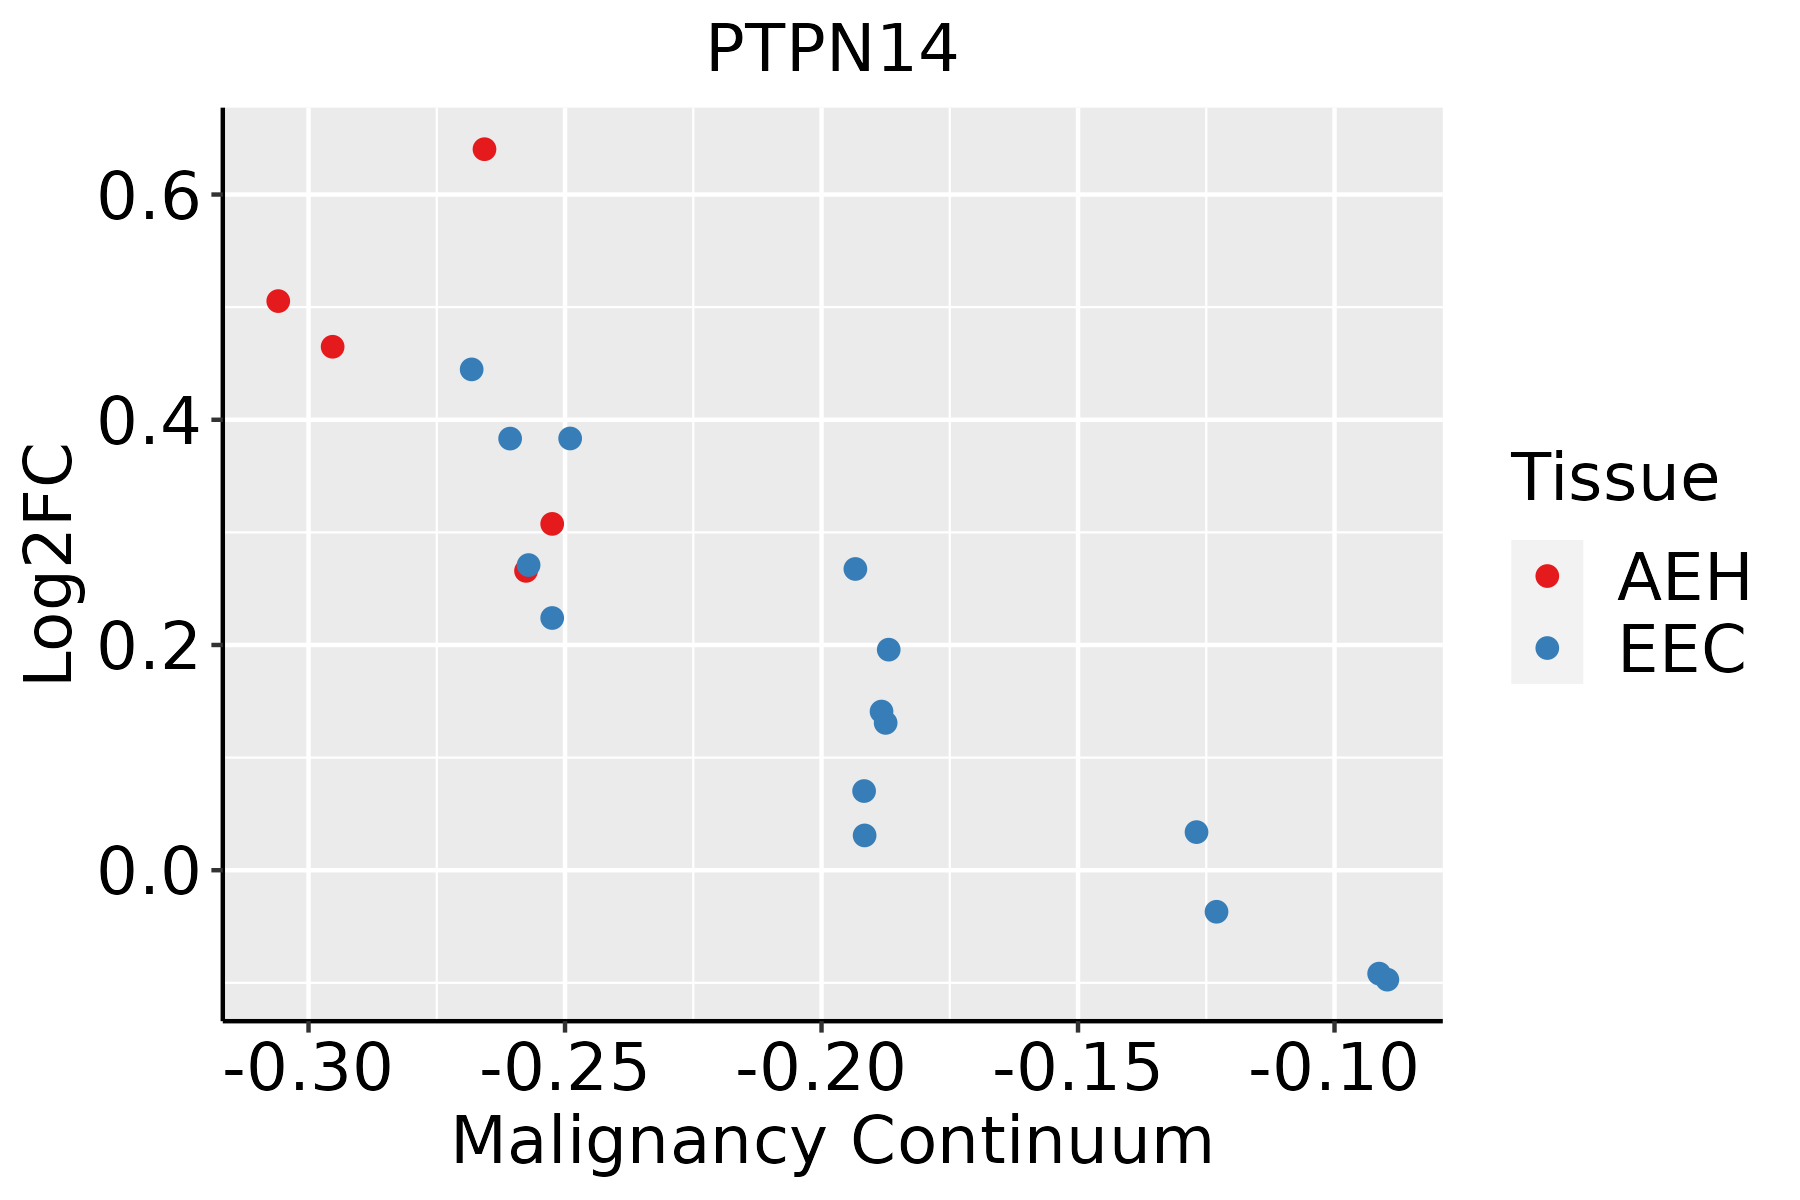 | AEH: Atypical endometrial hyperplasia |
| EEC: Endometrioid Cancer |
| Esophagus |  | ESCC: Esophageal squamous cell carcinoma |
| HGIN: High-grade intraepithelial neoplasias |
| LGIN: Low-grade intraepithelial neoplasias |
| Liver |  | HCC: Hepatocellular carcinoma |
| NAFLD: Non-alcoholic fatty liver disease |
| Lung |  | AAH: Atypical adenomatous hyperplasia |
| AIS: Adenocarcinoma in situ |
| IAC: Invasive lung adenocarcinoma |
| MIA: Minimally invasive adenocarcinoma |
| Oral Cavity | 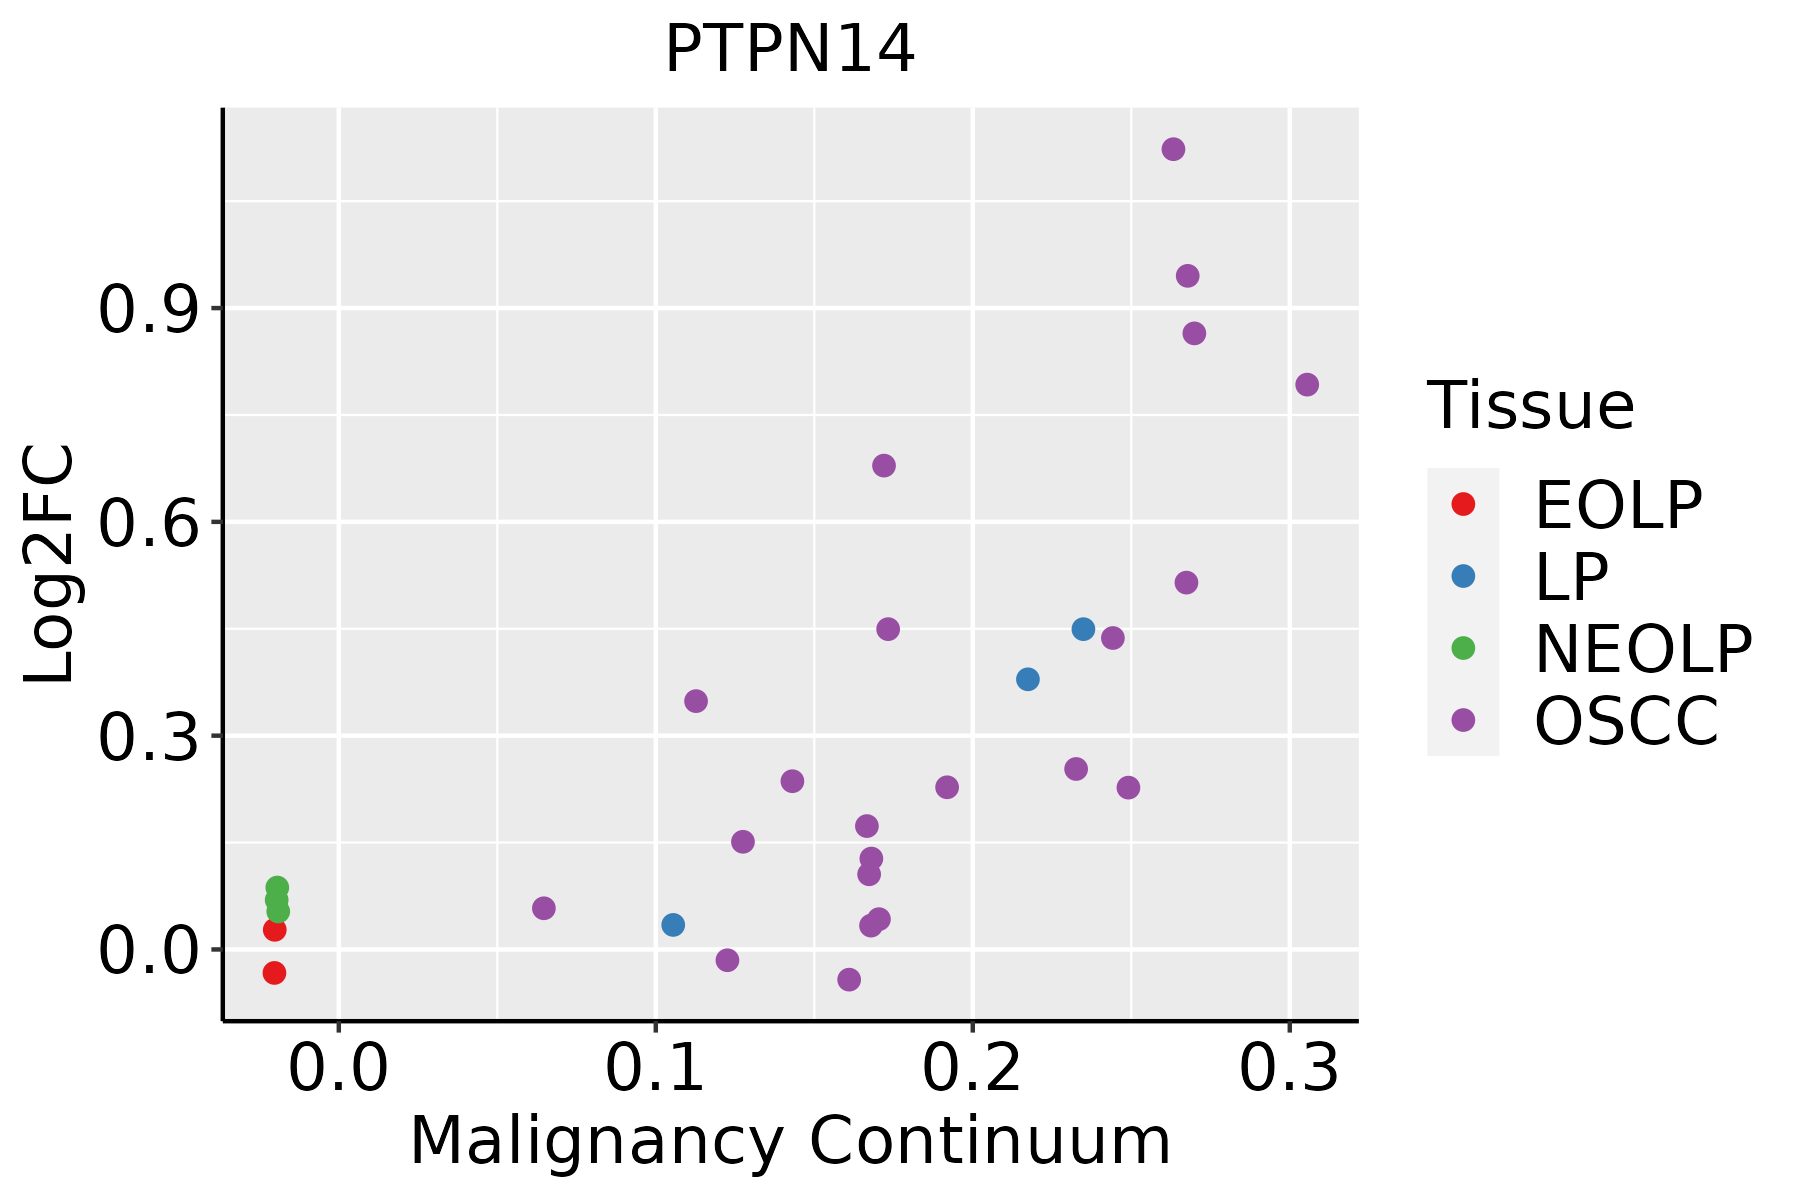 | EOLP: Erosive Oral lichen planus |
| LP: leukoplakia |
| NEOLP: Non-erosive oral lichen planus |
| OSCC: Oral squamous cell carcinoma |
| Prostate |  | BPH: Benign Prostatic Hyperplasia |
| Skin | 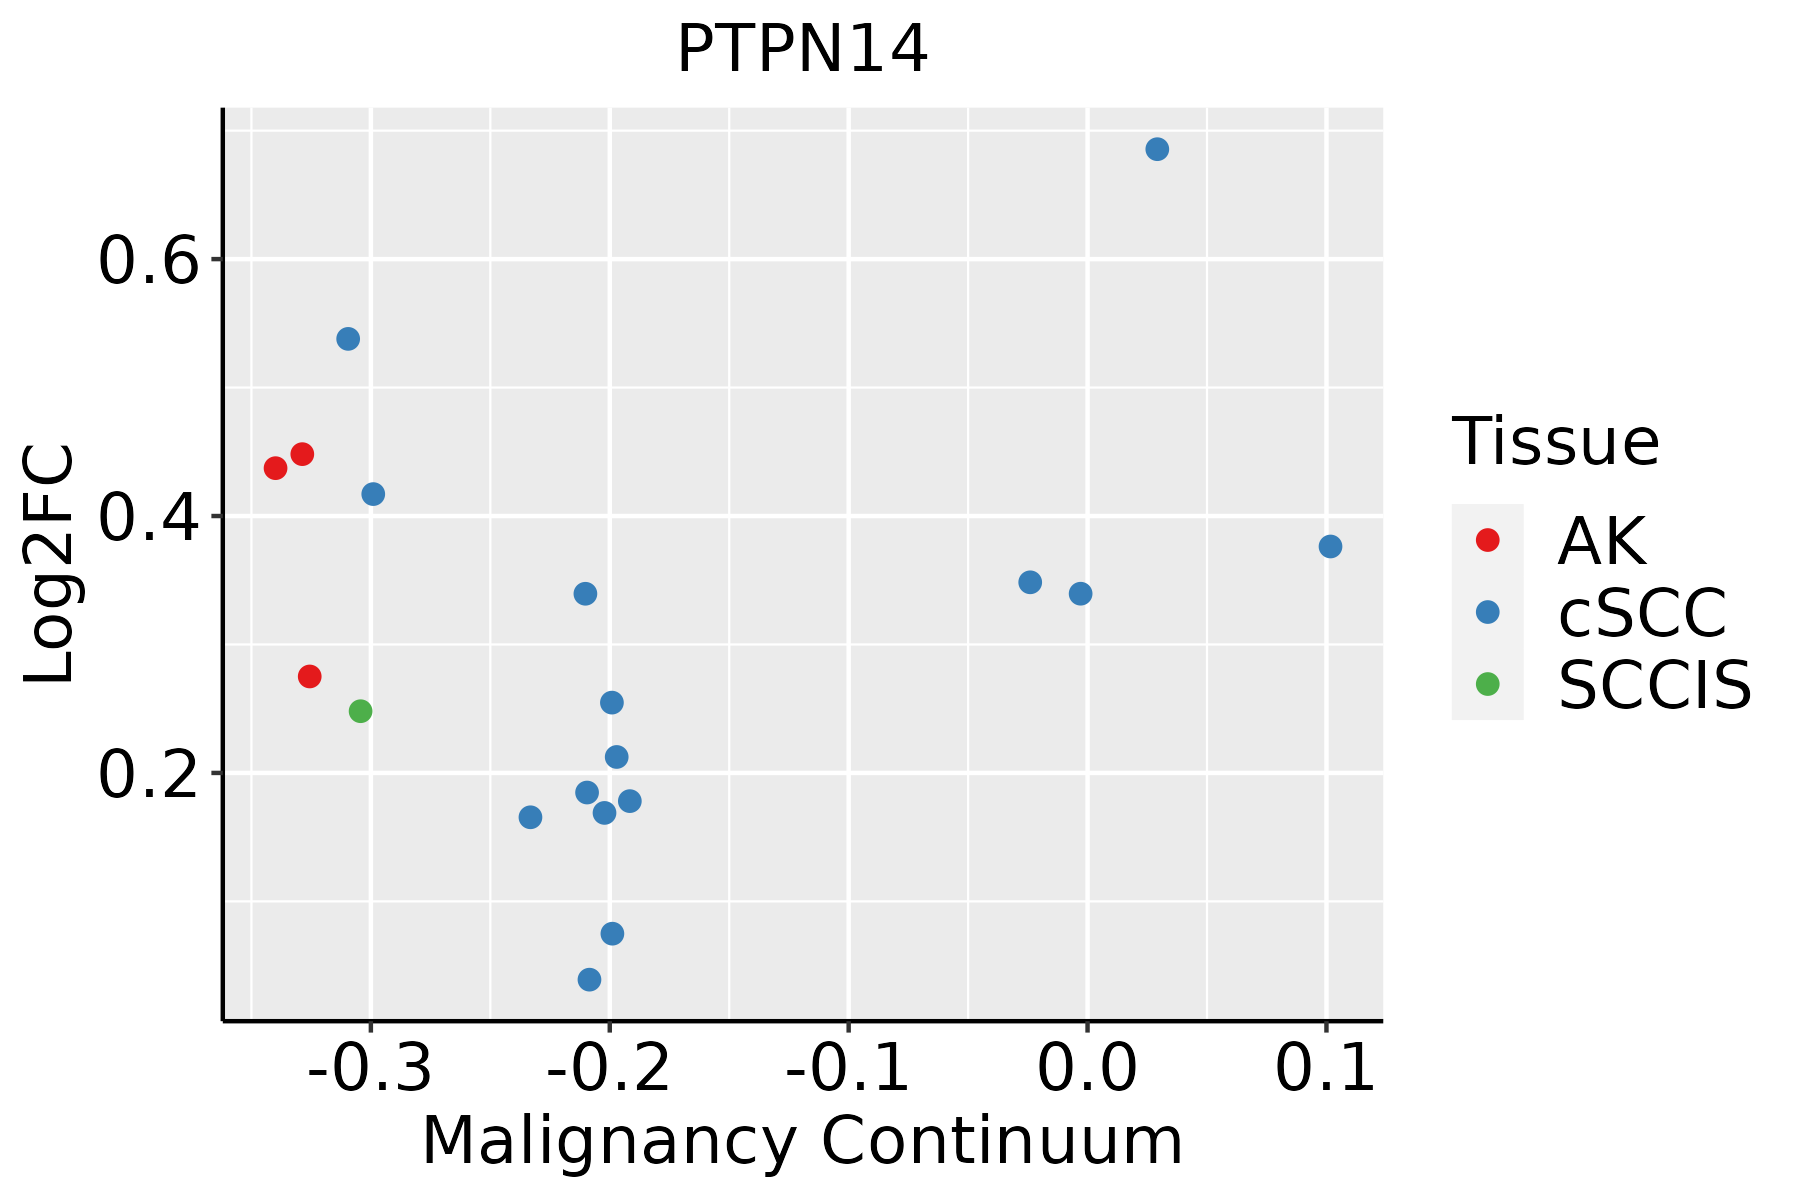 | AK: Actinic keratosis |
| cSCC: Cutaneous squamous cell carcinoma |
| SCCIS:squamous cell carcinoma in situ |
| Thyroid | 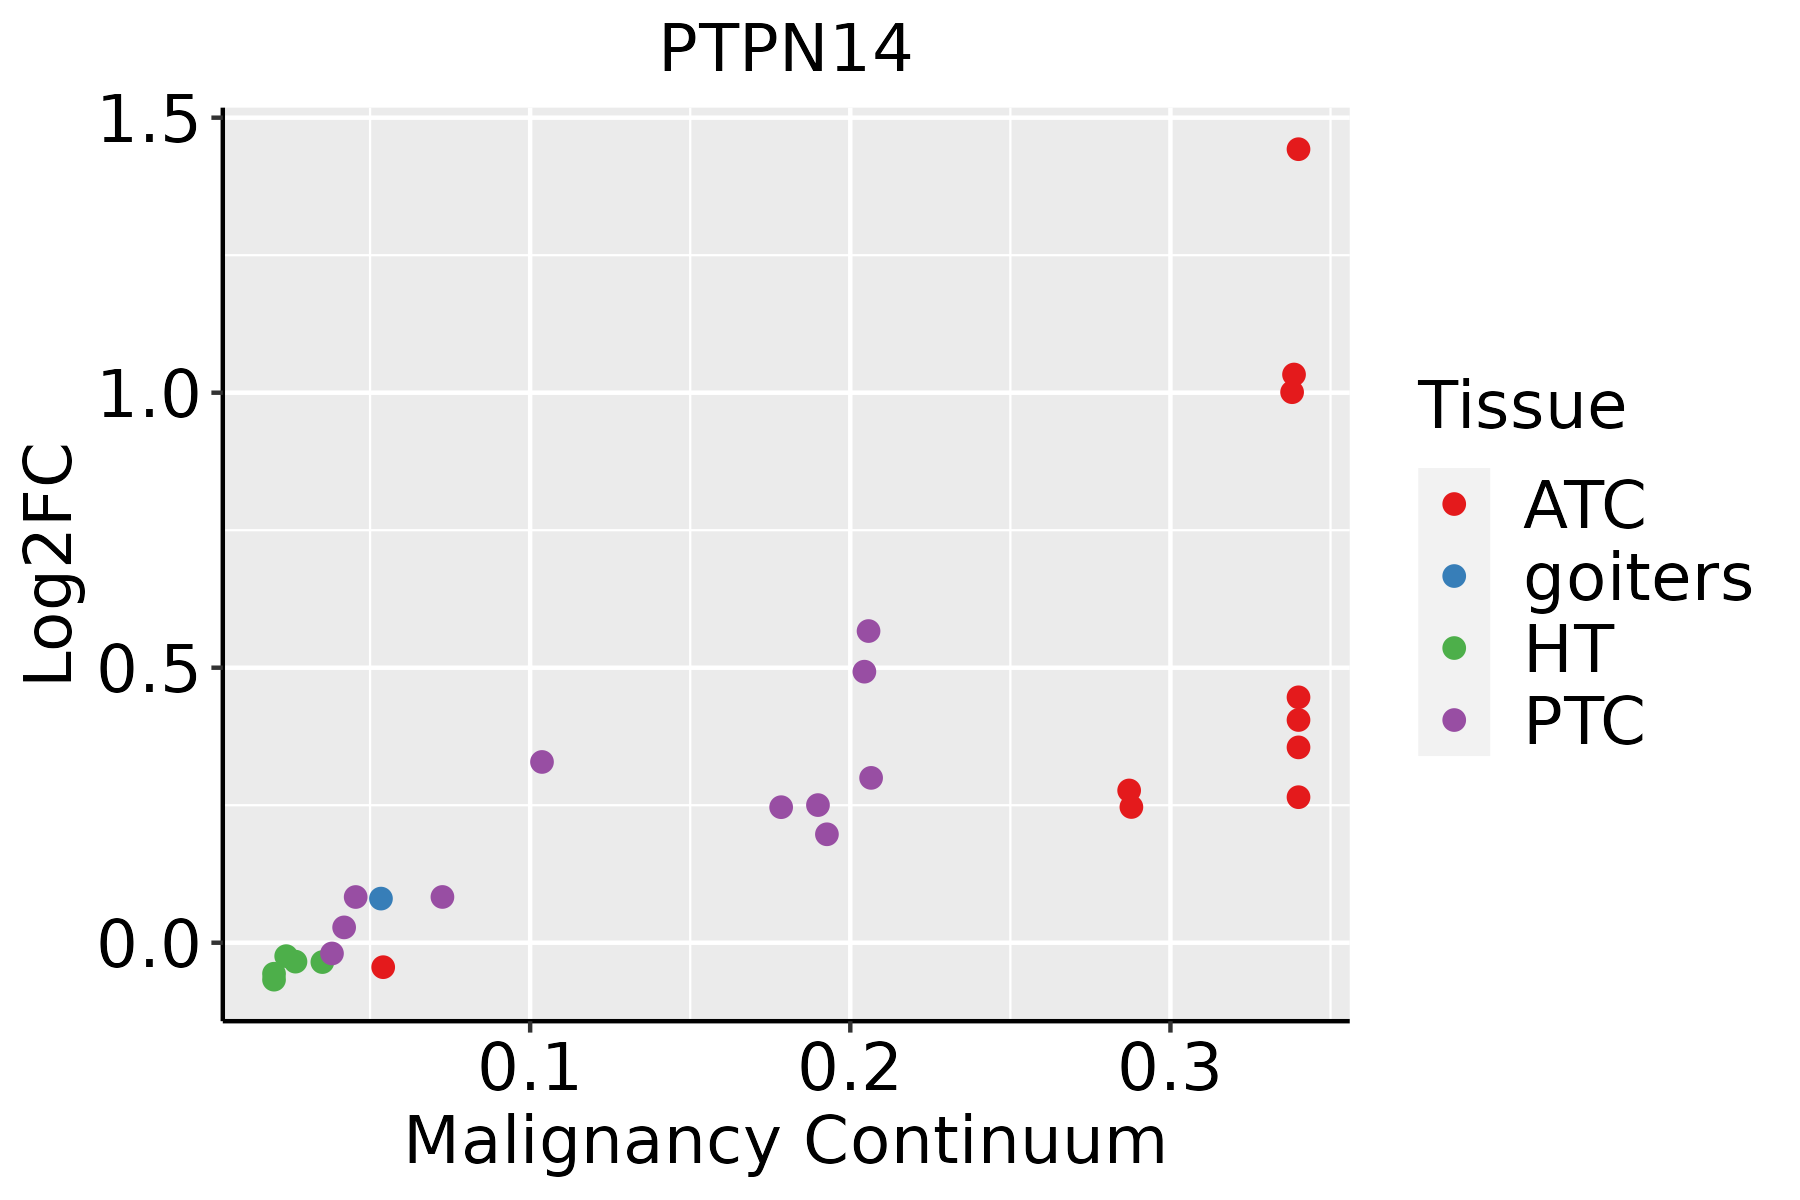 | ATC: Anaplastic thyroid cancer |
| HT: Hashimoto's thyroiditis |
| PTC: Papillary thyroid cancer |
| GO ID | Tissue | Disease Stage | Description | Gene Ratio | Bg Ratio | pvalue | p.adjust | Count |
| GO:00069139 | Cervix | CC | nucleocytoplasmic transport | 71/2311 | 301/18723 | 4.04e-08 | 2.54e-06 | 71 |
| GO:00511699 | Cervix | CC | nuclear transport | 71/2311 | 301/18723 | 4.04e-08 | 2.54e-06 | 71 |
| GO:00468229 | Cervix | CC | regulation of nucleocytoplasmic transport | 31/2311 | 106/18723 | 2.68e-06 | 7.87e-05 | 31 |
| GO:00323868 | Cervix | CC | regulation of intracellular transport | 71/2311 | 337/18723 | 3.70e-06 | 9.74e-05 | 71 |
| GO:00331579 | Cervix | CC | regulation of intracellular protein transport | 52/2311 | 229/18723 | 8.16e-06 | 1.88e-04 | 52 |
| GO:00064708 | Cervix | CC | protein dephosphorylation | 60/2311 | 281/18723 | 1.33e-05 | 2.68e-04 | 60 |
| GO:00511689 | Cervix | CC | nuclear export | 38/2311 | 154/18723 | 1.86e-05 | 3.46e-04 | 38 |
| GO:00468259 | Cervix | CC | regulation of protein export from nucleus | 12/2311 | 30/18723 | 1.23e-04 | 1.53e-03 | 12 |
| GO:00066116 | Cervix | CC | protein export from nucleus | 17/2311 | 57/18723 | 3.61e-04 | 3.75e-03 | 17 |
| GO:00163117 | Cervix | CC | dephosphorylation | 73/2311 | 417/18723 | 1.23e-03 | 9.87e-03 | 73 |
| GO:003315710 | Endometrium | AEH | regulation of intracellular protein transport | 51/2100 | 229/18723 | 1.13e-06 | 3.75e-05 | 51 |
| GO:00323869 | Endometrium | AEH | regulation of intracellular transport | 66/2100 | 337/18723 | 4.18e-06 | 1.10e-04 | 66 |
| GO:00066117 | Endometrium | AEH | protein export from nucleus | 17/2100 | 57/18723 | 1.13e-04 | 1.60e-03 | 17 |
| GO:004682510 | Endometrium | AEH | regulation of protein export from nucleus | 11/2100 | 30/18723 | 2.46e-04 | 2.93e-03 | 11 |
| GO:000691310 | Endometrium | AEH | nucleocytoplasmic transport | 54/2100 | 301/18723 | 3.24e-04 | 3.62e-03 | 54 |
| GO:005116910 | Endometrium | AEH | nuclear transport | 54/2100 | 301/18723 | 3.24e-04 | 3.62e-03 | 54 |
| GO:005116810 | Endometrium | AEH | nuclear export | 32/2100 | 154/18723 | 4.02e-04 | 4.29e-03 | 32 |
| GO:004682210 | Endometrium | AEH | regulation of nucleocytoplasmic transport | 24/2100 | 106/18723 | 5.69e-04 | 5.66e-03 | 24 |
| GO:00064709 | Endometrium | AEH | protein dephosphorylation | 50/2100 | 281/18723 | 6.41e-04 | 6.23e-03 | 50 |
| GO:003315715 | Endometrium | EEC | regulation of intracellular protein transport | 51/2168 | 229/18723 | 2.89e-06 | 8.09e-05 | 51 |
| Hugo Symbol | Variant Class | Variant Classification | dbSNP RS | HGVSc | HGVSp | HGVSp Short | SWISSPROT | BIOTYPE | SIFT | PolyPhen | Tumor Sample Barcode | Tissue | Histology | Sex | Age | Stage | Therapy Types | Drugs | Outcome |
| PTPN14 | SNV | Missense_Mutation | rs200531948 | c.1601N>T | p.Ser534Leu | p.S534L | Q15678 | protein_coding | tolerated(0.69) | benign(0.332) | TCGA-A2-A0CS-01 | Breast | breast invasive carcinoma | Female | >=65 | III/IV | Hormone Therapy | anastrozole | SD |
| PTPN14 | SNV | Missense_Mutation | | c.1702C>T | p.Pro568Ser | p.P568S | Q15678 | protein_coding | tolerated(0.06) | probably_damaging(0.996) | TCGA-A8-A09T-01 | Breast | breast invasive carcinoma | Female | >=65 | I/II | Hormone Therapy | anastrozole | SD |
| PTPN14 | SNV | Missense_Mutation | | c.3433G>A | p.Glu1145Lys | p.E1145K | Q15678 | protein_coding | deleterious(0.02) | probably_damaging(0.994) | TCGA-AN-A046-01 | Breast | breast invasive carcinoma | Female | >=65 | I/II | Unknown | Unknown | SD |
| PTPN14 | SNV | Missense_Mutation | | c.540N>T | p.Glu180Asp | p.E180D | Q15678 | protein_coding | tolerated(0.11) | probably_damaging(0.992) | TCGA-AN-A0AK-01 | Breast | breast invasive carcinoma | Female | >=65 | I/II | Unknown | Unknown | SD |
| PTPN14 | SNV | Missense_Mutation | novel | c.1622A>T | p.Glu541Val | p.E541V | Q15678 | protein_coding | deleterious(0) | probably_damaging(0.991) | TCGA-BH-A8FZ-01 | Breast | breast invasive carcinoma | Female | <65 | I/II | Unknown | Unknown | SD |
| PTPN14 | SNV | Missense_Mutation | | c.1548N>C | p.Gln516His | p.Q516H | Q15678 | protein_coding | tolerated(0.54) | benign(0) | TCGA-EW-A1J5-01 | Breast | breast invasive carcinoma | Female | <65 | I/II | Chemotherapy | adriamycin | SD |
| PTPN14 | insertion | Frame_Shift_Ins | novel | c.1934_1935insATGTCTAGCTTTGTATTCAGATTTTCTTTCAATAG | p.Met646CysfsTer13 | p.M646Cfs*13 | Q15678 | protein_coding | | | TCGA-A2-A04Y-01 | Breast | breast invasive carcinoma | Female | <65 | I/II | Chemotherapy | cytoxan | SD |
| PTPN14 | insertion | Nonsense_Mutation | novel | c.2661_2662insTAACAGTCTCTTTATCATTAG | p.Asp887_Ala888insTer | p.D887_A888ins* | Q15678 | protein_coding | | | TCGA-A8-A08H-01 | Breast | breast invasive carcinoma | Female | >=65 | I/II | Unknown | Unknown | SD |
| PTPN14 | SNV | Missense_Mutation | novel | c.116T>C | p.Val39Ala | p.V39A | Q15678 | protein_coding | tolerated(0.18) | probably_damaging(0.994) | TCGA-2W-A8YY-01 | Cervix | cervical & endocervical cancer | Female | <65 | I/II | Chemotherapy | cisplatin | CR |
| PTPN14 | SNV | Missense_Mutation | | c.3181N>T | p.Leu1061Phe | p.L1061F | Q15678 | protein_coding | deleterious(0.01) | probably_damaging(0.976) | TCGA-DG-A2KM-01 | Cervix | cervical & endocervical cancer | Female | <65 | I/II | Chemotherapy | cisplatin | SD |


