
|
|||||
|
 | |
| |
| |
| |
| |
| |
|
Gene: PTPN13 |
Gene summary for PTPN13 |
| Gene information | Species | Human | Gene symbol | PTPN13 | Gene ID | 5783 |
| Gene name | protein tyrosine phosphatase non-receptor type 13 | |
| Gene Alias | FAP-1 | |
| Cytomap | 4q21.3 | |
| Gene Type | protein-coding | GO ID | GO:0001932 | UniProtAcc | Q12923 |
Top |
Malignant transformation analysis |
| Identification of the aberrant gene expression in precancerous and cancerous lesions by comparing the gene expression of stem-like cells in diseased tissues with normal stem cells |
| Entrez ID | Symbol | Replicates | Species | Organ | Tissue | Adj P-value | Log2FC | Malignancy |
| 5783 | PTPN13 | CA_HPV_1 | Human | Cervix | CC | 7.48e-04 | -2.00e-01 | 0.0264 |
| 5783 | PTPN13 | CA_HPV_3 | Human | Cervix | CC | 1.33e-04 | 1.73e-01 | 0.0414 |
| 5783 | PTPN13 | CCI_1 | Human | Cervix | CC | 1.08e-24 | 2.12e+00 | 0.528 |
| 5783 | PTPN13 | CCI_2 | Human | Cervix | CC | 9.33e-13 | 1.65e+00 | 0.5249 |
| 5783 | PTPN13 | CCI_3 | Human | Cervix | CC | 2.16e-28 | 1.54e+00 | 0.516 |
| 5783 | PTPN13 | CCII_1 | Human | Cervix | CC | 3.35e-07 | 5.06e-01 | 0.3249 |
| 5783 | PTPN13 | Tumor | Human | Cervix | CC | 2.81e-07 | 3.34e-01 | 0.1241 |
| 5783 | PTPN13 | sample3 | Human | Cervix | CC | 2.94e-16 | 4.31e-01 | 0.1387 |
| 5783 | PTPN13 | T3 | Human | Cervix | CC | 8.91e-14 | 3.73e-01 | 0.1389 |
| 5783 | PTPN13 | HTA11_78_2000001011 | Human | Colorectum | AD | 3.44e-07 | 4.08e-01 | -0.1088 |
| 5783 | PTPN13 | HTA11_99999970781_79442 | Human | Colorectum | MSS | 9.17e-32 | 7.76e-01 | 0.294 |
| 5783 | PTPN13 | A001-C-207 | Human | Colorectum | FAP | 1.08e-03 | 4.60e-01 | 0.1278 |
| 5783 | PTPN13 | A002-C-203 | Human | Colorectum | FAP | 6.33e-10 | 4.94e-01 | 0.2786 |
| 5783 | PTPN13 | A001-C-104 | Human | Colorectum | FAP | 1.23e-08 | 5.34e-01 | 0.0184 |
| 5783 | PTPN13 | LZE2T | Human | Esophagus | ESCC | 3.29e-03 | 5.15e-01 | 0.082 |
| 5783 | PTPN13 | LZE22D1 | Human | Esophagus | HGIN | 1.75e-03 | 1.36e-01 | 0.0595 |
| 5783 | PTPN13 | LZE22T | Human | Esophagus | ESCC | 6.35e-04 | 3.53e-01 | 0.068 |
| 5783 | PTPN13 | LZE24T | Human | Esophagus | ESCC | 2.80e-06 | 2.72e-01 | 0.0596 |
| 5783 | PTPN13 | P1T-E | Human | Esophagus | ESCC | 3.47e-03 | 5.05e-01 | 0.0875 |
| 5783 | PTPN13 | P2T-E | Human | Esophagus | ESCC | 1.39e-24 | 3.72e-01 | 0.1177 |
| Page: 1 2 3 4 5 6 7 8 |
| Tissue | Expression Dynamics | Abbreviation |
| Cervix | 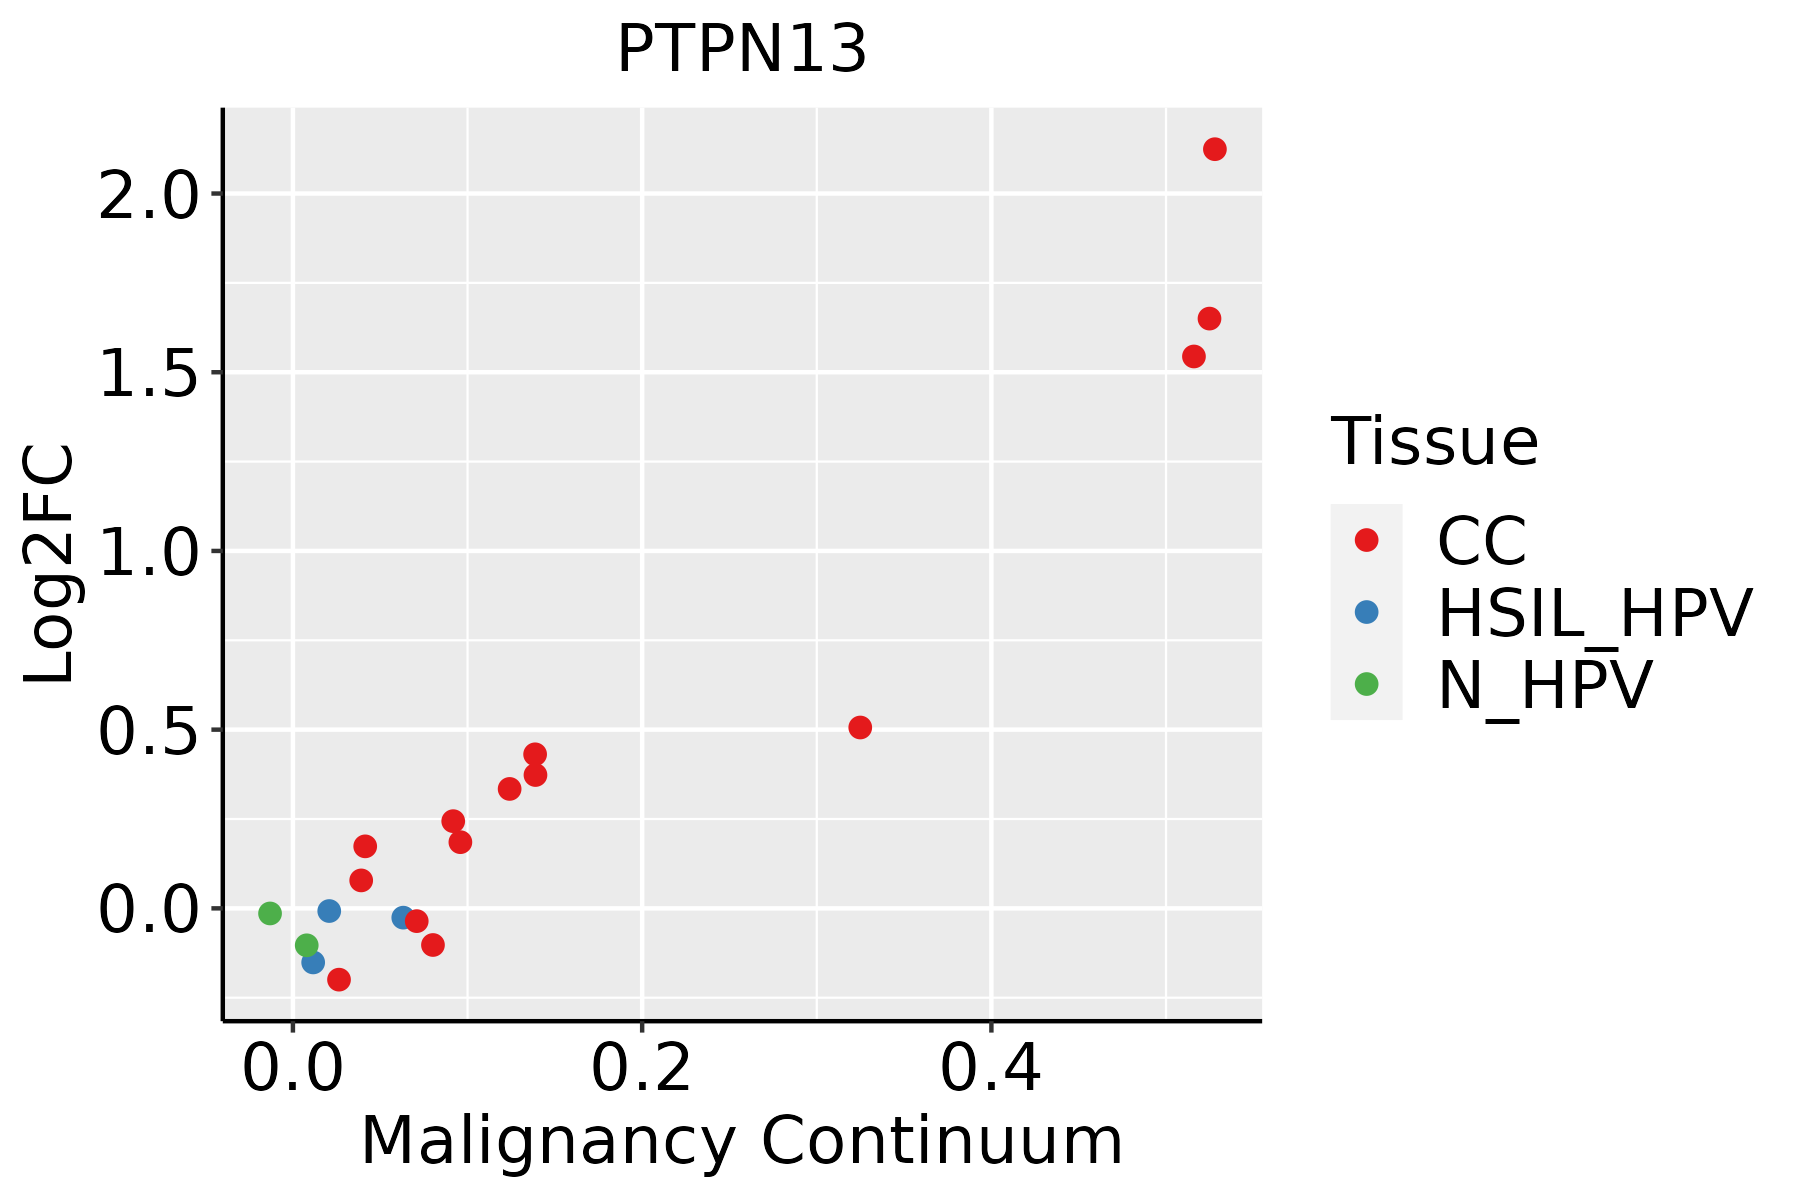 | CC: Cervix cancer |
| HSIL_HPV: HPV-infected high-grade squamous intraepithelial lesions | ||
| N_HPV: HPV-infected normal cervix | ||
| Colorectum (GSE201348) |  | FAP: Familial adenomatous polyposis |
| CRC: Colorectal cancer | ||
| Colorectum (HTA11) |  | AD: Adenomas |
| SER: Sessile serrated lesions | ||
| MSI-H: Microsatellite-high colorectal cancer | ||
| MSS: Microsatellite stable colorectal cancer | ||
| Esophagus | 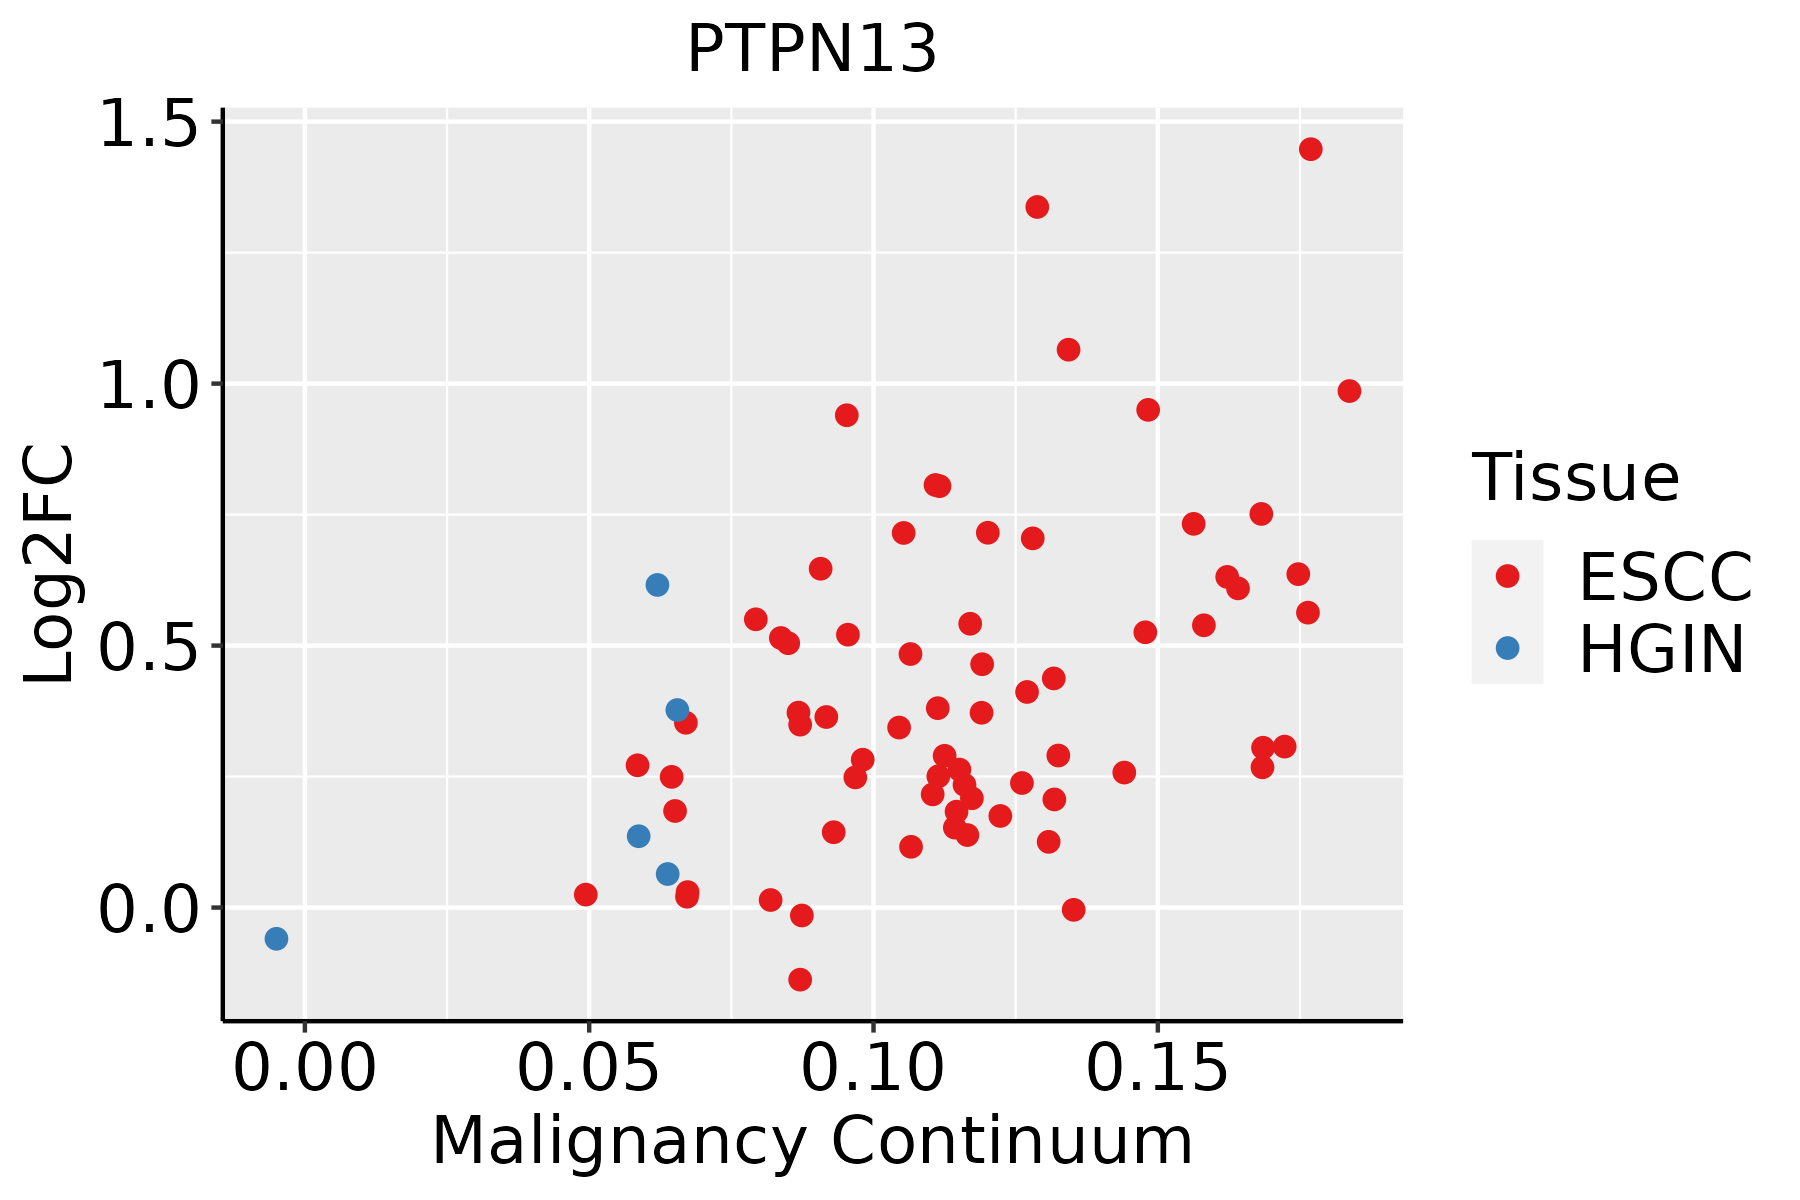 | ESCC: Esophageal squamous cell carcinoma |
| HGIN: High-grade intraepithelial neoplasias | ||
| LGIN: Low-grade intraepithelial neoplasias | ||
| Lung |  | AAH: Atypical adenomatous hyperplasia |
| AIS: Adenocarcinoma in situ | ||
| IAC: Invasive lung adenocarcinoma | ||
| MIA: Minimally invasive adenocarcinoma | ||
| Oral Cavity |  | EOLP: Erosive Oral lichen planus |
| LP: leukoplakia | ||
| NEOLP: Non-erosive oral lichen planus | ||
| OSCC: Oral squamous cell carcinoma | ||
| Prostate | 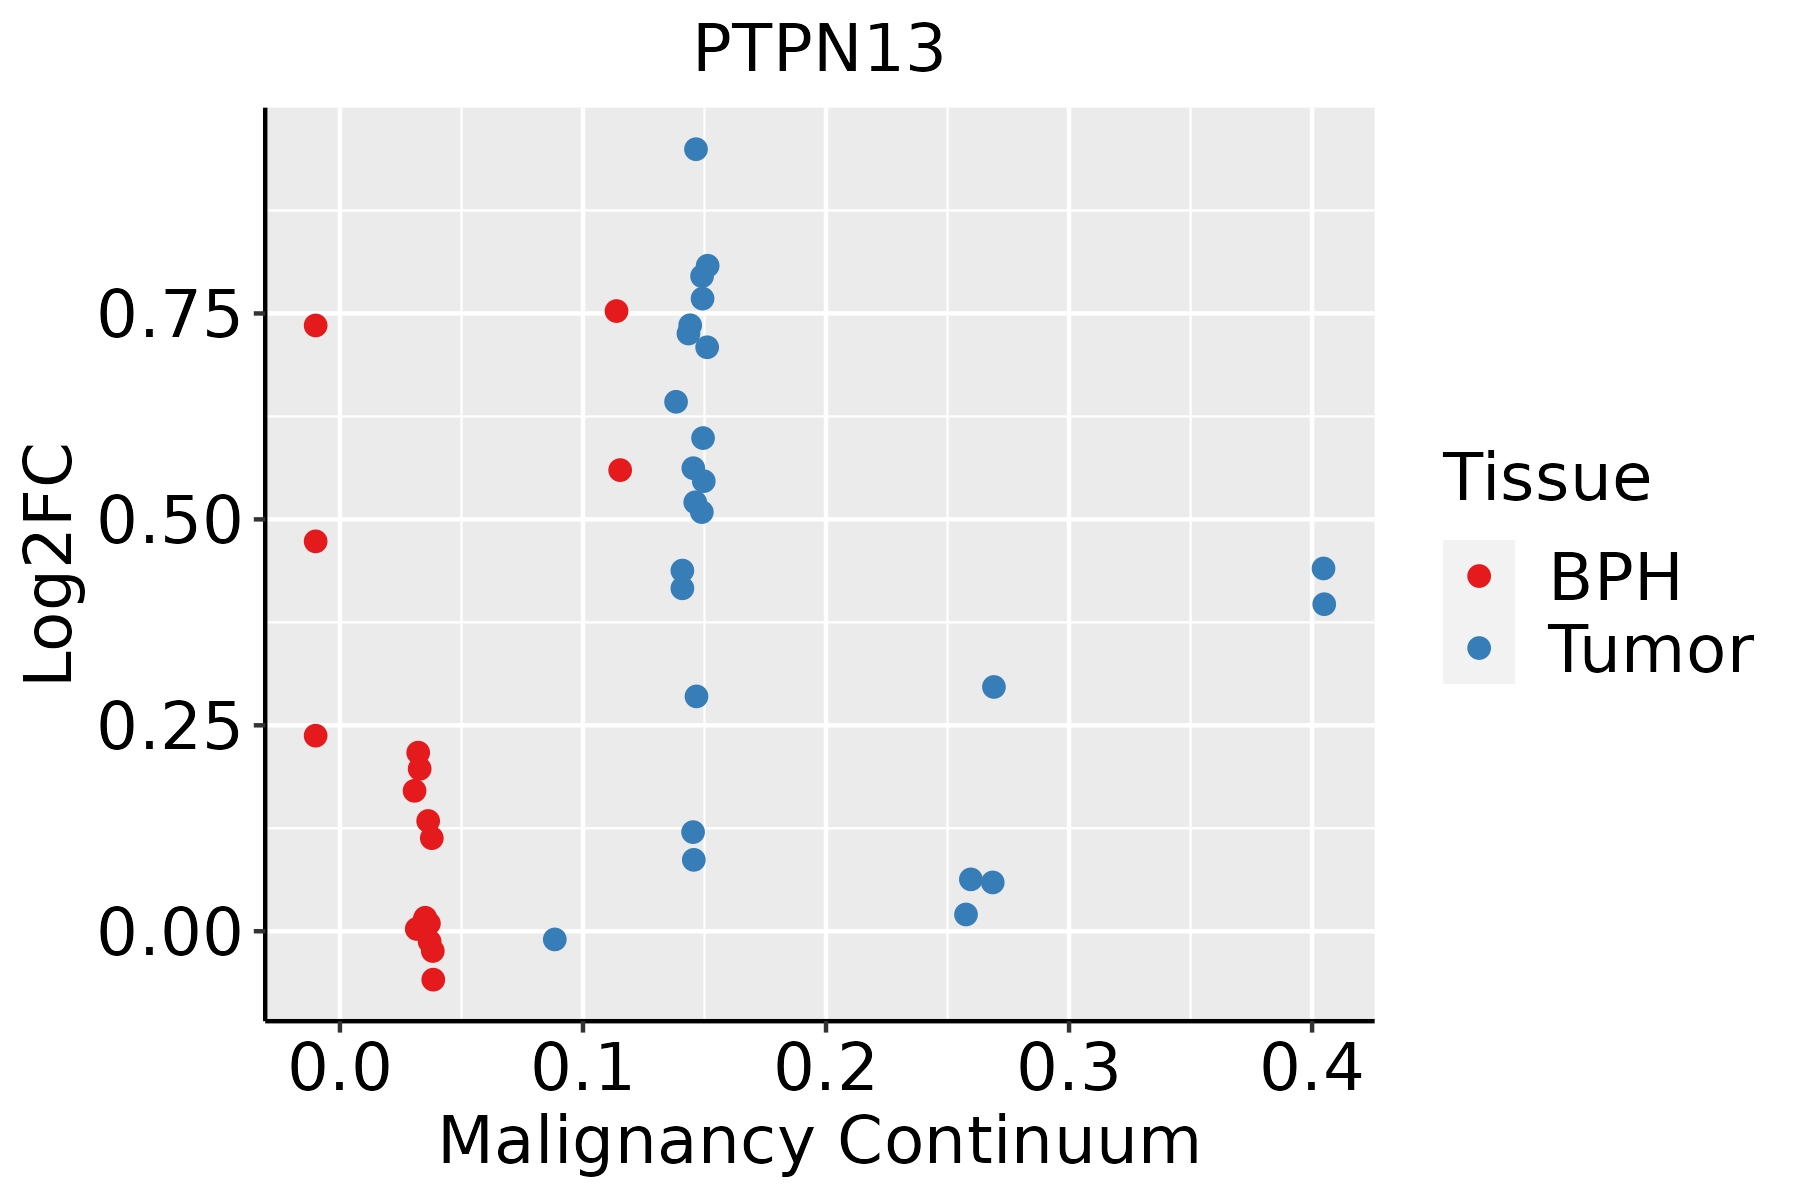 | BPH: Benign Prostatic Hyperplasia |
| Skin | 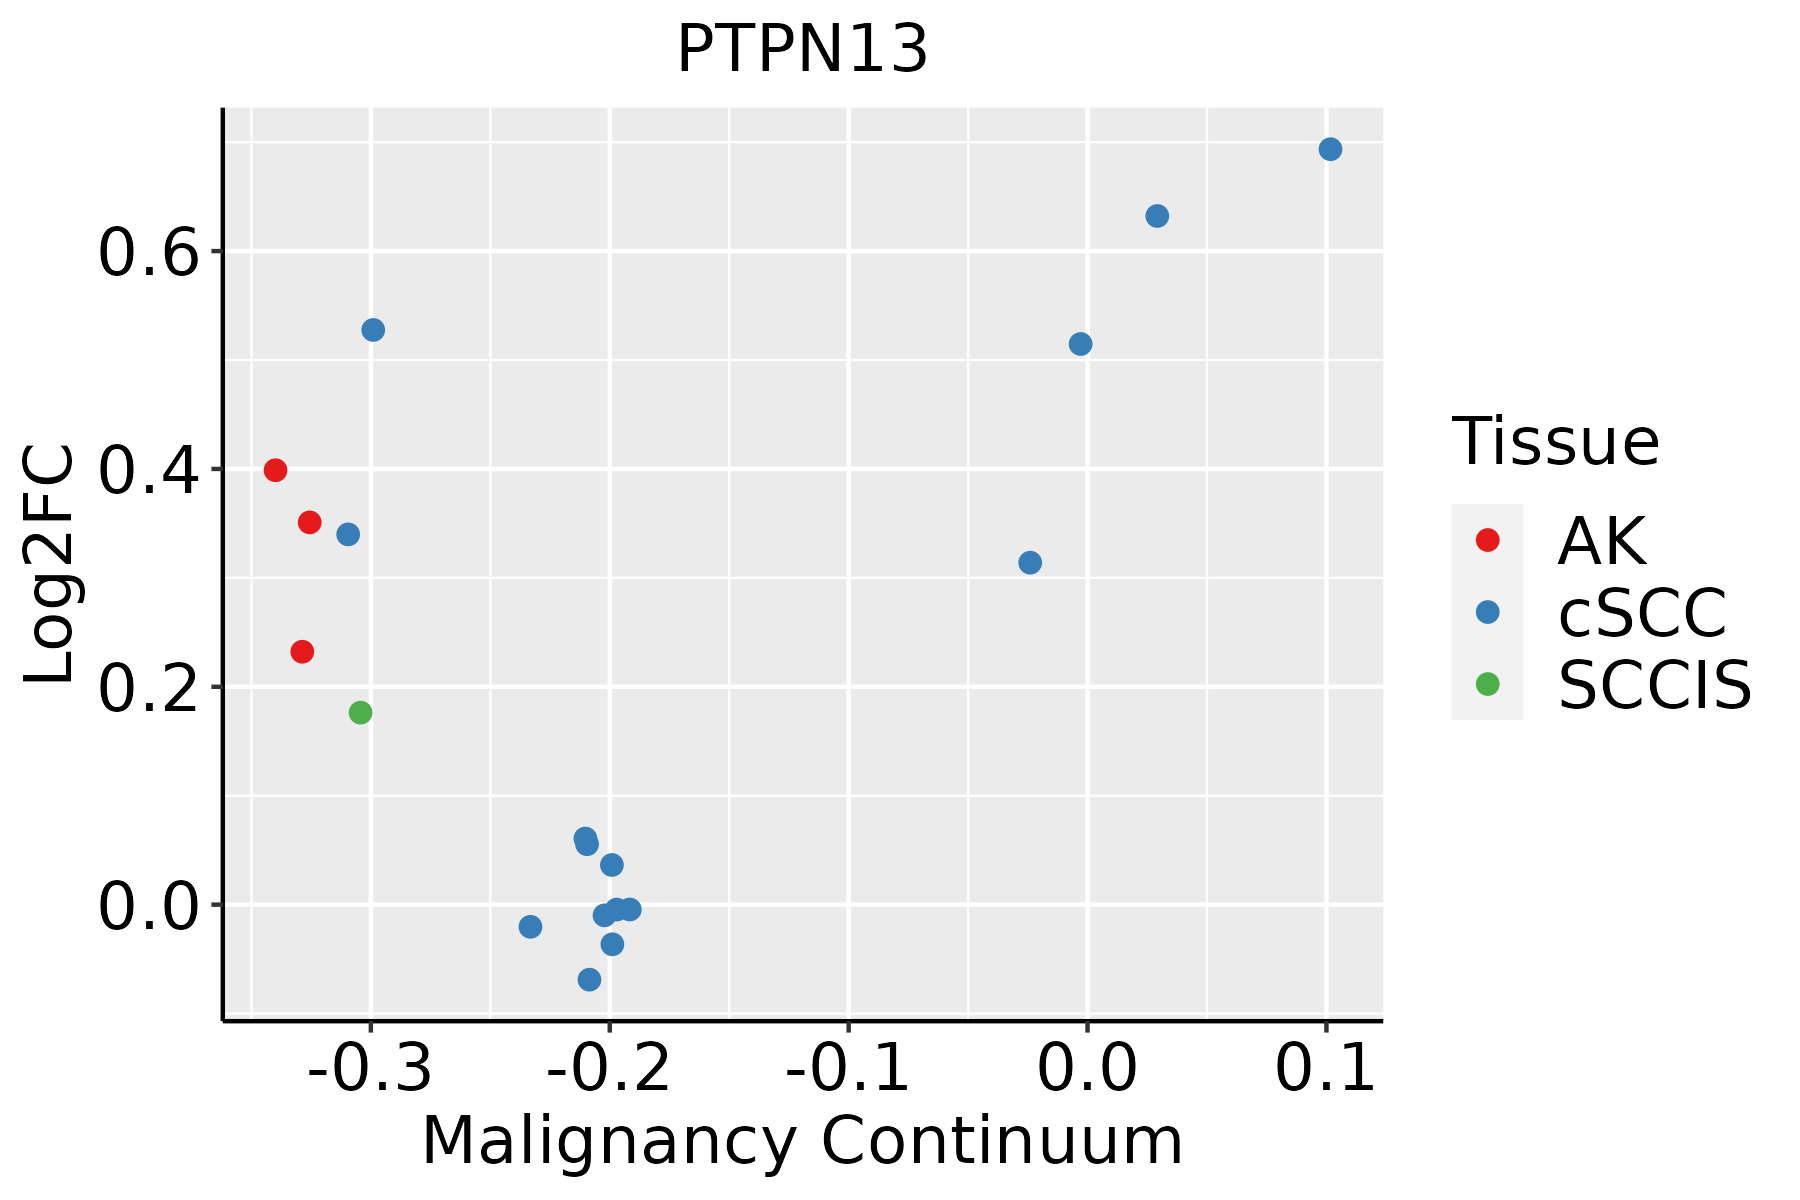 | AK: Actinic keratosis |
| cSCC: Cutaneous squamous cell carcinoma | ||
| SCCIS:squamous cell carcinoma in situ | ||
| Thyroid | 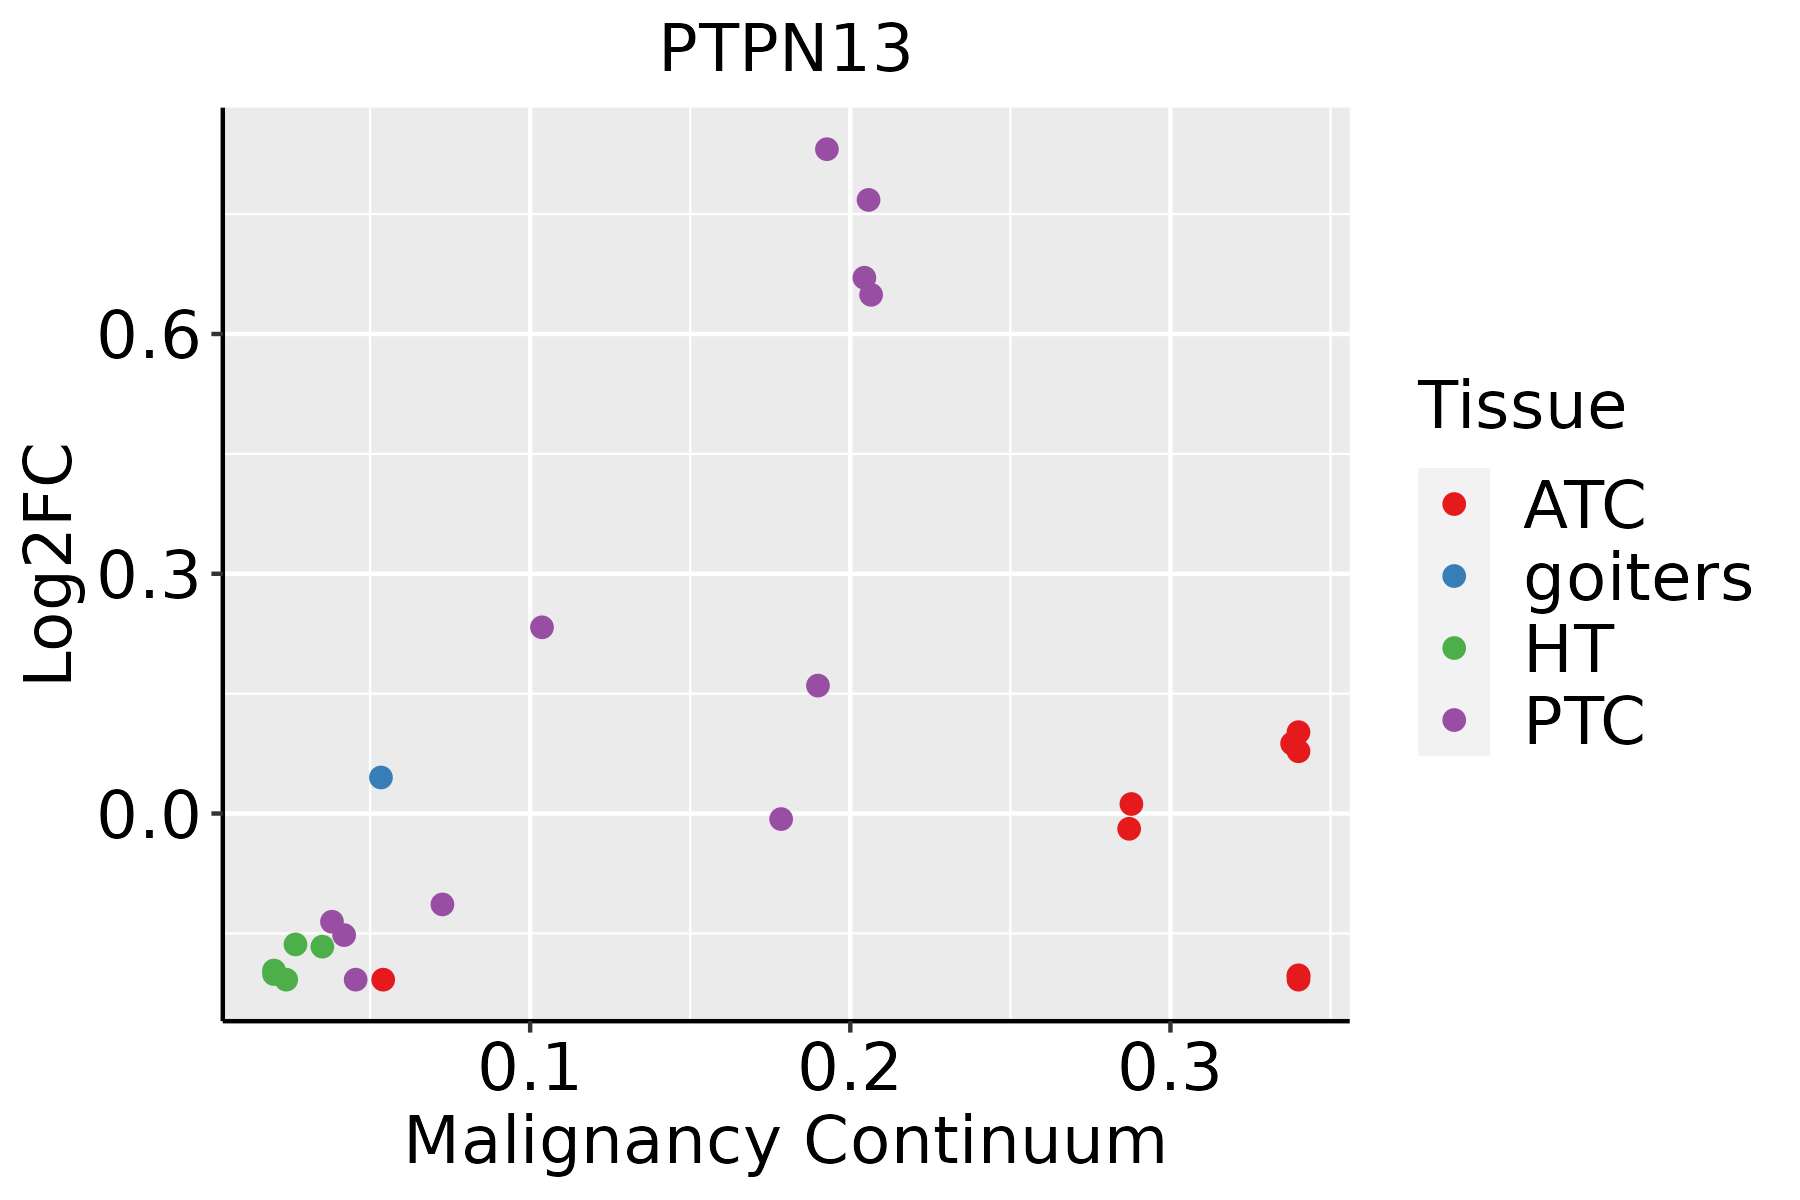 | ATC: Anaplastic thyroid cancer |
| HT: Hashimoto's thyroiditis | ||
| PTC: Papillary thyroid cancer |
| ∗log2FC in expression of this searched gene in stem-like cells from each diseased tissue sample relative to stem-like cells in normal samples in each tissue plotted against the malignancy continuum. Samples are colored based on if they are from different disease stage. |
Top |
Malignant transformation related pathway analysis |
| Find out the enriched GO biological processes and KEGG pathways involved in transition from healthy to precancer to cancer |
| Tissue | Disease Stage | Enriched GO biological Processes |
| Colorectum | AD |  |
| Colorectum | SER |  |
| Colorectum | MSS |  |
| Colorectum | MSI-H |  |
| Colorectum | FAP |  |
| ∗Top 15 enriched GO BP terms are showed in the bar plot of each disease state in each tissue. Each row represents a significant GO biological process which is colored according to the -log10(p.adjust). |
| Page: 1 2 3 4 5 6 7 8 9 |
| GO ID | Tissue | Disease Stage | Description | Gene Ratio | Bg Ratio | pvalue | p.adjust | Count |
| GO:004593610 | Cervix | CC | negative regulation of phosphate metabolic process | 88/2311 | 441/18723 | 2.92e-06 | 8.27e-05 | 88 |
| GO:001056310 | Cervix | CC | negative regulation of phosphorus metabolic process | 88/2311 | 442/18723 | 3.21e-06 | 8.77e-05 | 88 |
| GO:004232610 | Cervix | CC | negative regulation of phosphorylation | 77/2311 | 385/18723 | 1.09e-05 | 2.38e-04 | 77 |
| GO:00064708 | Cervix | CC | protein dephosphorylation | 60/2311 | 281/18723 | 1.33e-05 | 2.68e-04 | 60 |
| GO:000193310 | Cervix | CC | negative regulation of protein phosphorylation | 69/2311 | 342/18723 | 2.29e-05 | 4.01e-04 | 69 |
| GO:00163117 | Cervix | CC | dephosphorylation | 73/2311 | 417/18723 | 1.23e-03 | 9.87e-03 | 73 |
| GO:0014065 | Cervix | CC | phosphatidylinositol 3-kinase signaling | 28/2311 | 144/18723 | 9.50e-03 | 4.72e-02 | 28 |
| GO:0010563 | Colorectum | AD | negative regulation of phosphorus metabolic process | 130/3918 | 442/18723 | 1.26e-05 | 2.76e-04 | 130 |
| GO:0045936 | Colorectum | AD | negative regulation of phosphate metabolic process | 129/3918 | 441/18723 | 1.81e-05 | 3.76e-04 | 129 |
| GO:0016311 | Colorectum | AD | dephosphorylation | 123/3918 | 417/18723 | 1.84e-05 | 3.82e-04 | 123 |
| GO:0006470 | Colorectum | AD | protein dephosphorylation | 88/3918 | 281/18723 | 2.56e-05 | 4.89e-04 | 88 |
| GO:0042326 | Colorectum | AD | negative regulation of phosphorylation | 112/3918 | 385/18723 | 8.02e-05 | 1.27e-03 | 112 |
| GO:0001933 | Colorectum | AD | negative regulation of protein phosphorylation | 101/3918 | 342/18723 | 9.39e-05 | 1.42e-03 | 101 |
| GO:0048017 | Colorectum | AD | inositol lipid-mediated signaling | 53/3918 | 182/18723 | 5.35e-03 | 3.52e-02 | 53 |
| GO:0048015 | Colorectum | AD | phosphatidylinositol-mediated signaling | 52/3918 | 178/18723 | 5.37e-03 | 3.54e-02 | 52 |
| GO:00105632 | Colorectum | MSS | negative regulation of phosphorus metabolic process | 118/3467 | 442/18723 | 1.18e-05 | 2.77e-04 | 118 |
| GO:00459362 | Colorectum | MSS | negative regulation of phosphate metabolic process | 117/3467 | 441/18723 | 1.74e-05 | 3.84e-04 | 117 |
| GO:00423262 | Colorectum | MSS | negative regulation of phosphorylation | 103/3467 | 385/18723 | 3.76e-05 | 7.17e-04 | 103 |
| GO:00019332 | Colorectum | MSS | negative regulation of protein phosphorylation | 93/3467 | 342/18723 | 4.54e-05 | 8.35e-04 | 93 |
| GO:00064702 | Colorectum | MSS | protein dephosphorylation | 73/3467 | 281/18723 | 1.15e-03 | 1.12e-02 | 73 |
| Page: 1 2 3 4 5 6 |
| Pathway ID | Tissue | Disease Stage | Description | Gene Ratio | Bg Ratio | pvalue | p.adjust | qvalue | Count |
| hsa042109 | Cervix | CC | Apoptosis | 36/1267 | 136/8465 | 3.21e-04 | 1.68e-03 | 9.91e-04 | 36 |
| hsa0421014 | Cervix | CC | Apoptosis | 36/1267 | 136/8465 | 3.21e-04 | 1.68e-03 | 9.91e-04 | 36 |
| hsa04210 | Colorectum | MSS | Apoptosis | 44/1875 | 136/8465 | 3.66e-03 | 1.66e-02 | 1.01e-02 | 44 |
| hsa042101 | Colorectum | MSS | Apoptosis | 44/1875 | 136/8465 | 3.66e-03 | 1.66e-02 | 1.01e-02 | 44 |
| hsa0421020 | Esophagus | HGIN | Apoptosis | 36/1383 | 136/8465 | 1.67e-03 | 1.52e-02 | 1.20e-02 | 36 |
| hsa04210110 | Esophagus | HGIN | Apoptosis | 36/1383 | 136/8465 | 1.67e-03 | 1.52e-02 | 1.20e-02 | 36 |
| hsa0421027 | Esophagus | ESCC | Apoptosis | 102/4205 | 136/8465 | 1.05e-09 | 1.21e-08 | 6.21e-09 | 102 |
| hsa0421037 | Esophagus | ESCC | Apoptosis | 102/4205 | 136/8465 | 1.05e-09 | 1.21e-08 | 6.21e-09 | 102 |
| hsa042107 | Lung | IAC | Apoptosis | 30/1053 | 136/8465 | 1.11e-03 | 7.82e-03 | 5.19e-03 | 30 |
| hsa0421012 | Lung | IAC | Apoptosis | 30/1053 | 136/8465 | 1.11e-03 | 7.82e-03 | 5.19e-03 | 30 |
| hsa0421021 | Lung | AIS | Apoptosis | 25/961 | 136/8465 | 9.83e-03 | 4.20e-02 | 2.69e-02 | 25 |
| hsa0421031 | Lung | AIS | Apoptosis | 25/961 | 136/8465 | 9.83e-03 | 4.20e-02 | 2.69e-02 | 25 |
| hsa0421018 | Oral cavity | OSCC | Apoptosis | 101/3704 | 136/8465 | 3.34e-13 | 7.00e-12 | 3.56e-12 | 101 |
| hsa0421019 | Oral cavity | OSCC | Apoptosis | 101/3704 | 136/8465 | 3.34e-13 | 7.00e-12 | 3.56e-12 | 101 |
| hsa0421026 | Oral cavity | LP | Apoptosis | 65/2418 | 136/8465 | 1.33e-06 | 1.48e-05 | 9.53e-06 | 65 |
| hsa0421036 | Oral cavity | LP | Apoptosis | 65/2418 | 136/8465 | 1.33e-06 | 1.48e-05 | 9.53e-06 | 65 |
| hsa0421016 | Prostate | BPH | Apoptosis | 46/1718 | 136/8465 | 1.41e-04 | 8.31e-04 | 5.14e-04 | 46 |
| hsa0421017 | Prostate | BPH | Apoptosis | 46/1718 | 136/8465 | 1.41e-04 | 8.31e-04 | 5.14e-04 | 46 |
| hsa0421025 | Prostate | Tumor | Apoptosis | 48/1791 | 136/8465 | 9.03e-05 | 6.10e-04 | 3.78e-04 | 48 |
| hsa0421035 | Prostate | Tumor | Apoptosis | 48/1791 | 136/8465 | 9.03e-05 | 6.10e-04 | 3.78e-04 | 48 |
| Page: 1 |
Top |
Cell-cell communication analysis |
| Identification of potential cell-cell interactions between two cell types and their ligand-receptor pairs for different disease states |
| Ligand | Receptor | LRpair | Pathway | Tissue | Disease Stage |
| Page: 1 |
Top |
Single-cell gene regulatory network inference analysis |
| Find out the significant the regulons (TFs) and the target genes of each regulon across cell types for different disease states |
| TF | Cell Type | Tissue | Disease Stage | Target Gene | RSS | Regulon Activity |
| ∗The dot plots of a searched regulon are shown for all cell subpopulations in each disease state of each tissue based on the regulon specific score inferred using pySCENIC and by calculating the average expression. |
| Page: 1 |
Top |
Somatic mutation of malignant transformation related genes |
| Annotation of somatic variants for genes involved in malignant transformation |
| Hugo Symbol | Variant Class | Variant Classification | dbSNP RS | HGVSc | HGVSp | HGVSp Short | SWISSPROT | BIOTYPE | SIFT | PolyPhen | Tumor Sample Barcode | Tissue | Histology | Sex | Age | Stage | Therapy Types | Drugs | Outcome |
| PTPN13 | SNV | Missense_Mutation | c.2330N>A | p.Gly777Glu | p.G777E | Q12923 | protein_coding | deleterious(0) | probably_damaging(1) | TCGA-A2-A0EY-01 | Breast | breast invasive carcinoma | Female | <65 | I/II | Chemotherapy | adriamycin | SD | |
| PTPN13 | SNV | Missense_Mutation | rs764669231 | c.3760G>T | p.Ala1254Ser | p.A1254S | Q12923 | protein_coding | tolerated(0.14) | probably_damaging(0.948) | TCGA-A7-A5ZW-01 | Breast | breast invasive carcinoma | Female | <65 | I/II | Chemotherapy | cyclophosphamide | CR |
| PTPN13 | SNV | Missense_Mutation | c.1555N>A | p.Asp519Asn | p.D519N | Q12923 | protein_coding | deleterious(0) | probably_damaging(0.995) | TCGA-A8-A09I-01 | Breast | breast invasive carcinoma | Female | >=65 | I/II | Hormone Therapy | anastrozole | SD | |
| PTPN13 | SNV | Missense_Mutation | c.353A>G | p.Gln118Arg | p.Q118R | Q12923 | protein_coding | deleterious(0) | possibly_damaging(0.849) | TCGA-A8-A09Z-01 | Breast | breast invasive carcinoma | Female | >=65 | I/II | Unknown | Unknown | SD | |
| PTPN13 | SNV | Missense_Mutation | rs184221078 | c.1673G>A | p.Arg558Gln | p.R558Q | Q12923 | protein_coding | tolerated(0.43) | benign(0.007) | TCGA-A8-A09Z-01 | Breast | breast invasive carcinoma | Female | >=65 | I/II | Unknown | Unknown | SD |
| PTPN13 | SNV | Missense_Mutation | c.6346N>C | p.Glu2116Gln | p.E2116Q | Q12923 | protein_coding | deleterious(0.01) | benign(0.024) | TCGA-AC-A23H-01 | Breast | breast invasive carcinoma | Female | >=65 | I/II | Unknown | Unknown | PD | |
| PTPN13 | SNV | Missense_Mutation | novel | c.2853A>C | p.Lys951Asn | p.K951N | Q12923 | protein_coding | tolerated(0.27) | possibly_damaging(0.549) | TCGA-AN-A046-01 | Breast | breast invasive carcinoma | Female | >=65 | I/II | Unknown | Unknown | SD |
| PTPN13 | SNV | Missense_Mutation | novel | c.4661A>G | p.Asp1554Gly | p.D1554G | Q12923 | protein_coding | tolerated(0.1) | benign(0.149) | TCGA-AN-A046-01 | Breast | breast invasive carcinoma | Female | >=65 | I/II | Unknown | Unknown | SD |
| PTPN13 | SNV | Missense_Mutation | novel | c.4803T>G | p.Ile1601Met | p.I1601M | Q12923 | protein_coding | tolerated(0.42) | benign(0.142) | TCGA-AN-A046-01 | Breast | breast invasive carcinoma | Female | >=65 | I/II | Unknown | Unknown | SD |
| PTPN13 | SNV | Missense_Mutation | novel | c.5266G>C | p.Asp1756His | p.D1756H | Q12923 | protein_coding | tolerated(0.06) | possibly_damaging(0.526) | TCGA-BH-A2L8-01 | Breast | breast invasive carcinoma | Female | <65 | I/II | Chemotherapy | cytoxan | CR |
| Page: 1 2 3 4 5 6 7 8 9 10 11 12 13 14 15 16 17 18 19 20 21 22 23 24 25 |
Top |
Related drugs of malignant transformation related genes |
| Identification of chemicals and drugs interact with genes involved in malignant transfromation |
| (DGIdb 4.0) |
| Entrez ID | Symbol | Category | Interaction Types | Drug Claim Name | Drug Name | PMIDs |
| 5783 | PTPN13 | DRUGGABLE GENOME, PROTEIN PHOSPHATASE, KINASE, CLINICALLY ACTIONABLE | ANTIESTROGENS | 15242314 |
| Page: 1 |

Copyright 2023-Present -The University of Texas Health Science Center at Houston |