
|
|||||
|
 | |
| |
| |
| |
| |
| |
|
Gene: PTPN11 |
Gene summary for PTPN11 |
| Gene information | Species | Human | Gene symbol | PTPN11 | Gene ID | 5781 |
| Gene name | protein tyrosine phosphatase non-receptor type 11 | |
| Gene Alias | BPTP3 | |
| Cytomap | 12q24.13 | |
| Gene Type | protein-coding | GO ID | GO:0000003 | UniProtAcc | Q06124 |
Top |
Malignant transformation analysis |
| Identification of the aberrant gene expression in precancerous and cancerous lesions by comparing the gene expression of stem-like cells in diseased tissues with normal stem cells |
| Entrez ID | Symbol | Replicates | Species | Organ | Tissue | Adj P-value | Log2FC | Malignancy |
| 5781 | PTPN11 | LZE4T | Human | Esophagus | ESCC | 3.57e-07 | 3.43e-01 | 0.0811 |
| 5781 | PTPN11 | LZE7T | Human | Esophagus | ESCC | 1.63e-04 | 5.39e-01 | 0.0667 |
| 5781 | PTPN11 | LZE8T | Human | Esophagus | ESCC | 4.12e-02 | 2.26e-01 | 0.067 |
| 5781 | PTPN11 | LZE22T | Human | Esophagus | ESCC | 4.19e-03 | 2.55e-01 | 0.068 |
| 5781 | PTPN11 | LZE24T | Human | Esophagus | ESCC | 1.62e-14 | 4.91e-01 | 0.0596 |
| 5781 | PTPN11 | LZE21T | Human | Esophagus | ESCC | 1.59e-04 | 3.69e-01 | 0.0655 |
| 5781 | PTPN11 | LZE6T | Human | Esophagus | ESCC | 2.41e-03 | 2.45e-01 | 0.0845 |
| 5781 | PTPN11 | P1T-E | Human | Esophagus | ESCC | 1.63e-04 | 4.45e-01 | 0.0875 |
| 5781 | PTPN11 | P2T-E | Human | Esophagus | ESCC | 6.64e-69 | 1.31e+00 | 0.1177 |
| 5781 | PTPN11 | P4T-E | Human | Esophagus | ESCC | 1.27e-30 | 6.92e-01 | 0.1323 |
| 5781 | PTPN11 | P5T-E | Human | Esophagus | ESCC | 5.87e-22 | 4.40e-01 | 0.1327 |
| 5781 | PTPN11 | P8T-E | Human | Esophagus | ESCC | 4.62e-21 | 5.57e-01 | 0.0889 |
| 5781 | PTPN11 | P9T-E | Human | Esophagus | ESCC | 5.36e-09 | 2.52e-01 | 0.1131 |
| 5781 | PTPN11 | P10T-E | Human | Esophagus | ESCC | 1.80e-26 | 5.38e-01 | 0.116 |
| 5781 | PTPN11 | P11T-E | Human | Esophagus | ESCC | 6.18e-23 | 7.56e-01 | 0.1426 |
| 5781 | PTPN11 | P12T-E | Human | Esophagus | ESCC | 1.87e-28 | 4.70e-01 | 0.1122 |
| 5781 | PTPN11 | P15T-E | Human | Esophagus | ESCC | 2.15e-20 | 5.32e-01 | 0.1149 |
| 5781 | PTPN11 | P16T-E | Human | Esophagus | ESCC | 9.33e-42 | 6.84e-01 | 0.1153 |
| 5781 | PTPN11 | P17T-E | Human | Esophagus | ESCC | 5.76e-07 | 5.29e-01 | 0.1278 |
| 5781 | PTPN11 | P19T-E | Human | Esophagus | ESCC | 4.84e-07 | 6.17e-01 | 0.1662 |
| Page: 1 2 3 4 5 6 |
| Tissue | Expression Dynamics | Abbreviation |
| Esophagus |  | ESCC: Esophageal squamous cell carcinoma |
| HGIN: High-grade intraepithelial neoplasias | ||
| LGIN: Low-grade intraepithelial neoplasias | ||
| Liver | 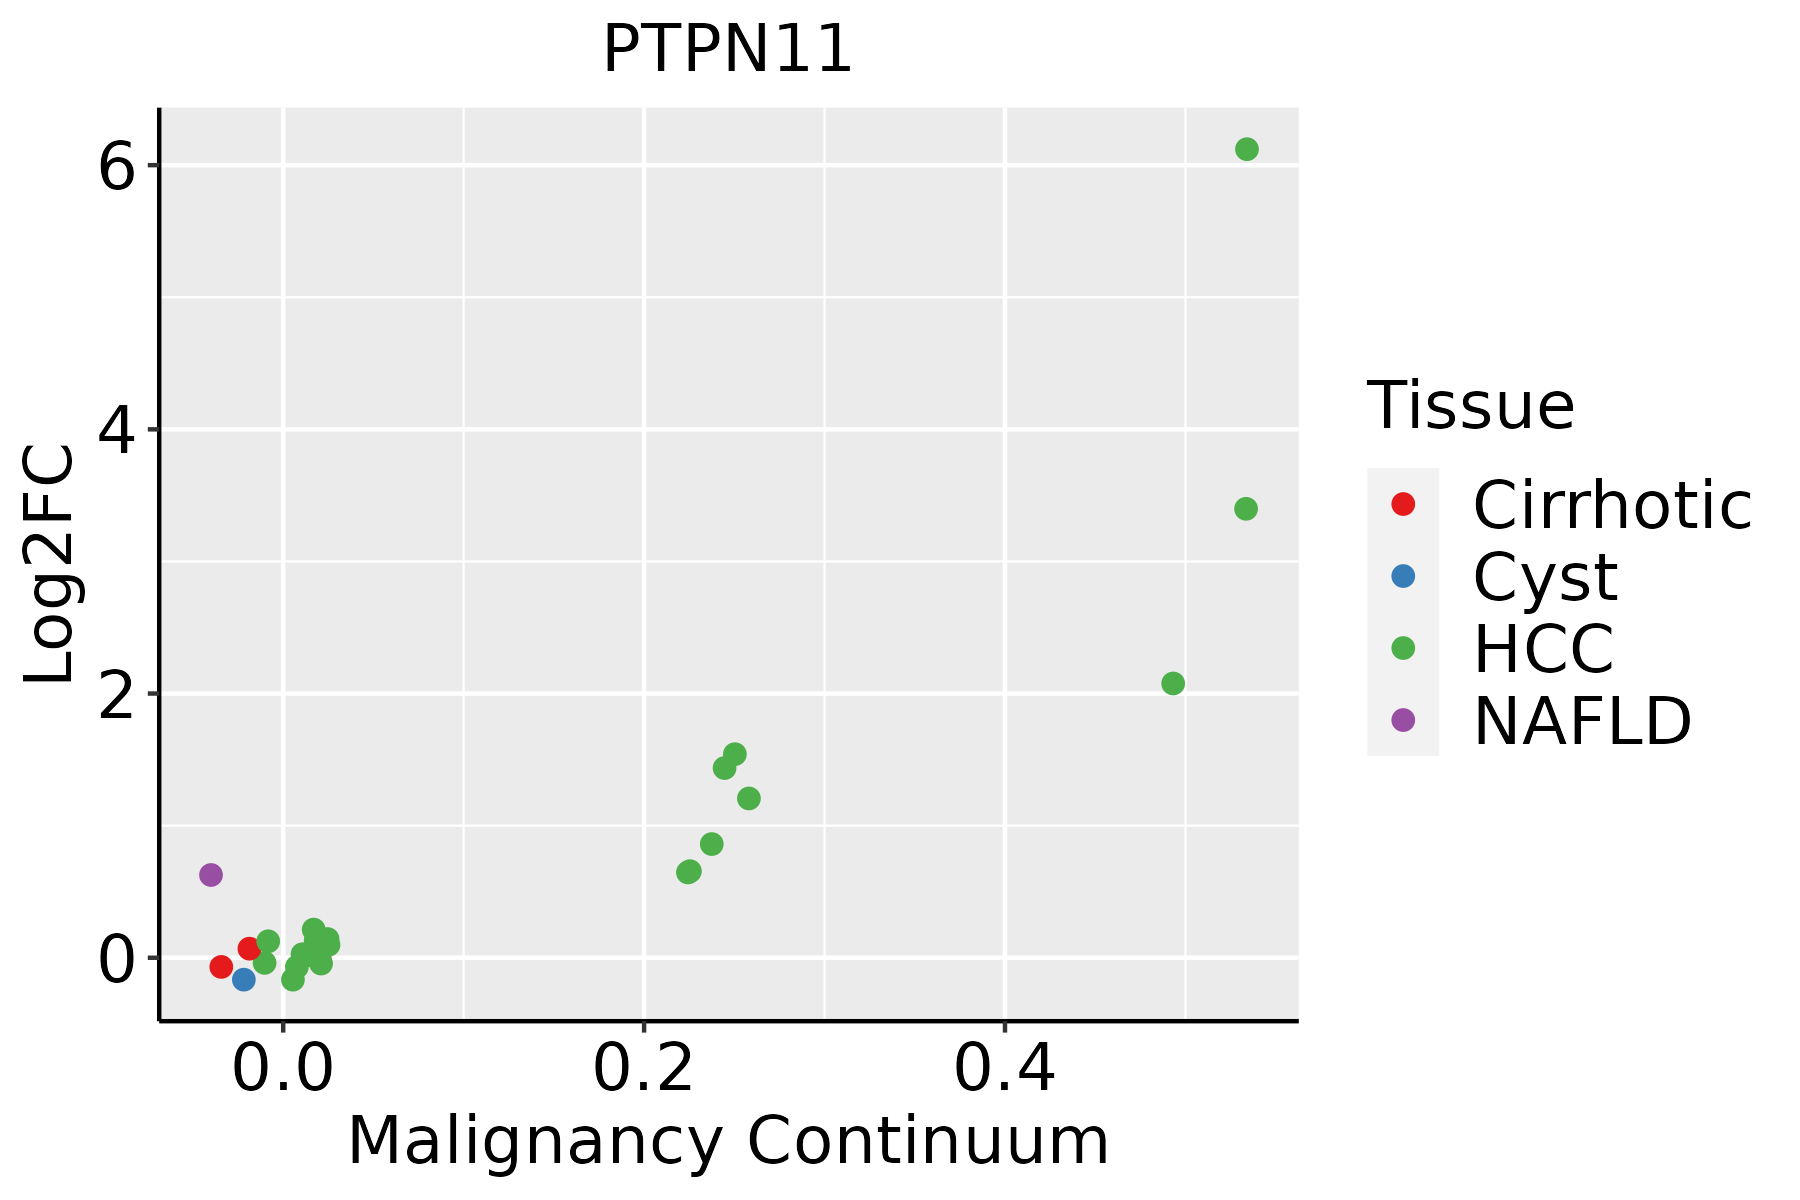 | HCC: Hepatocellular carcinoma |
| NAFLD: Non-alcoholic fatty liver disease | ||
| Oral Cavity | 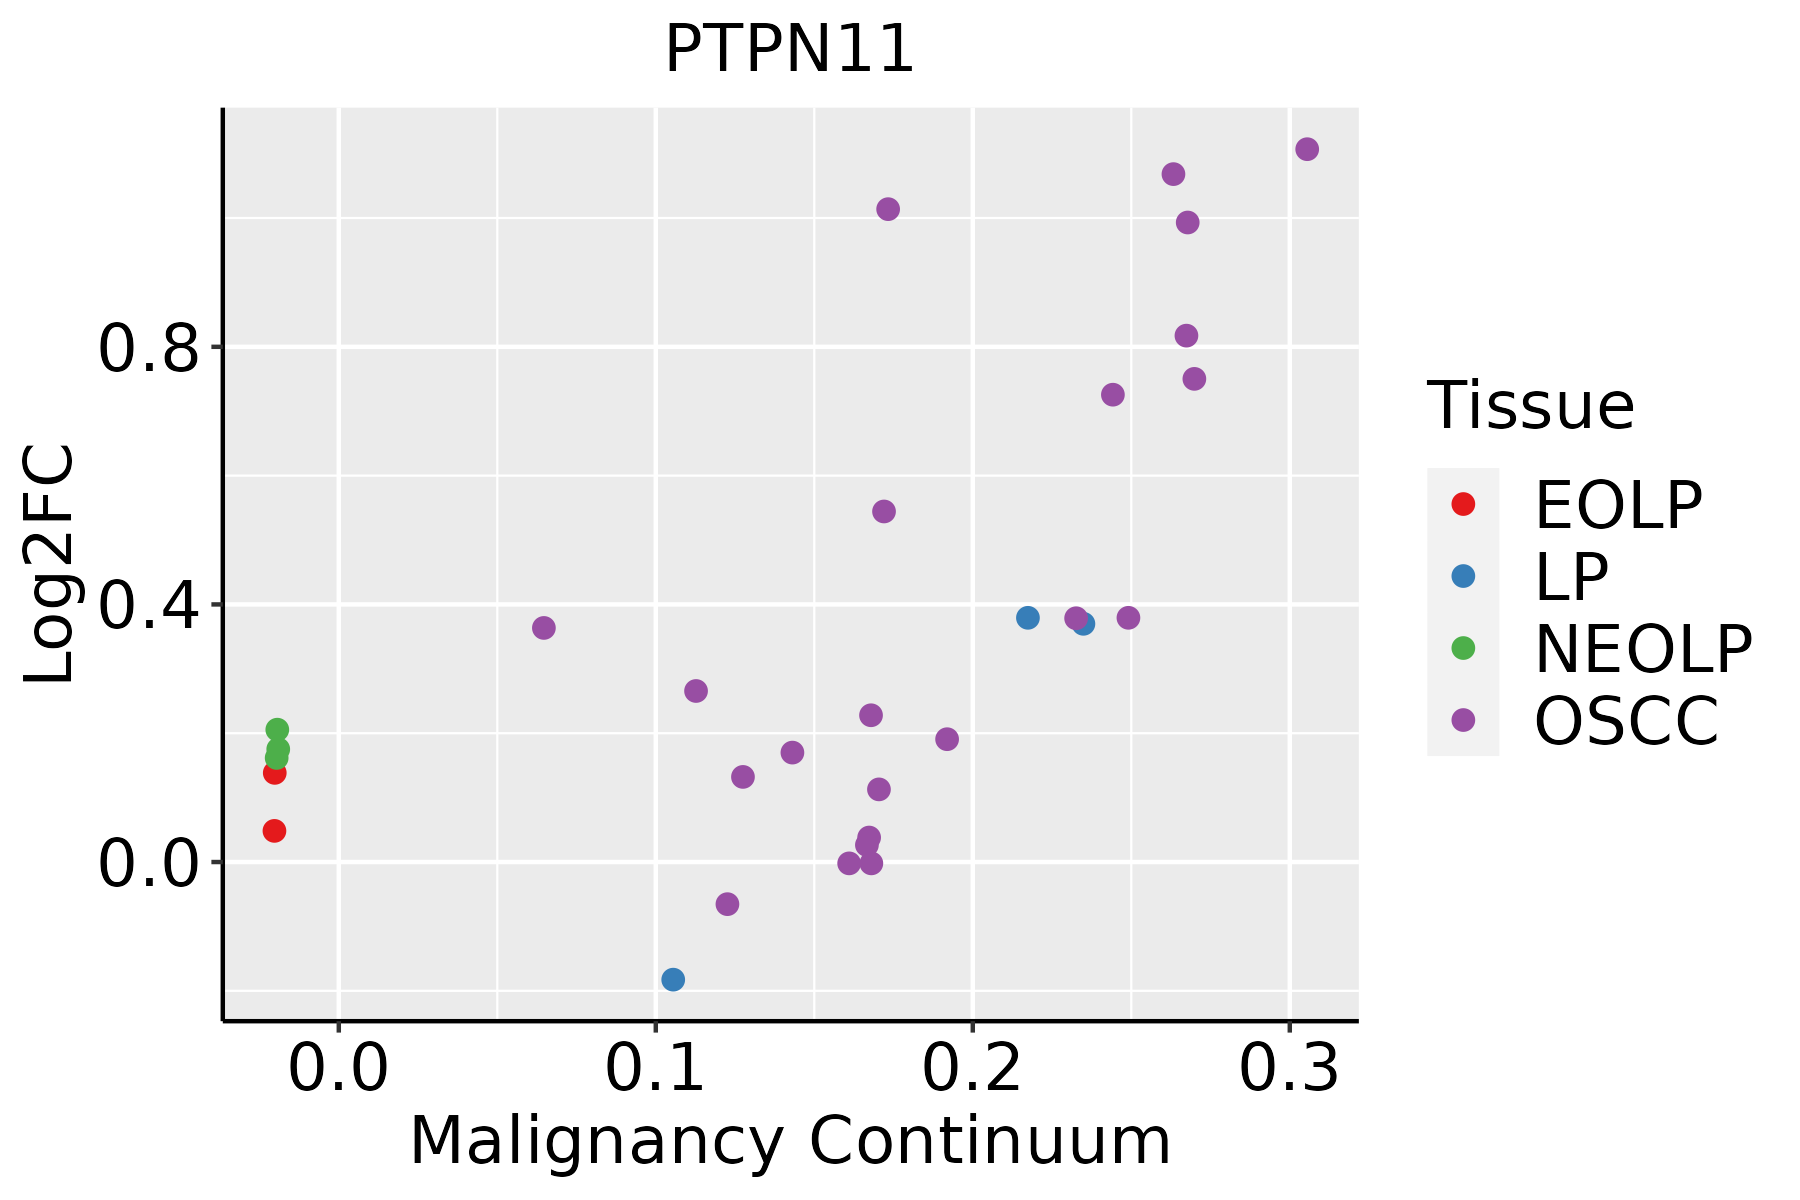 | EOLP: Erosive Oral lichen planus |
| LP: leukoplakia | ||
| NEOLP: Non-erosive oral lichen planus | ||
| OSCC: Oral squamous cell carcinoma | ||
| Skin | 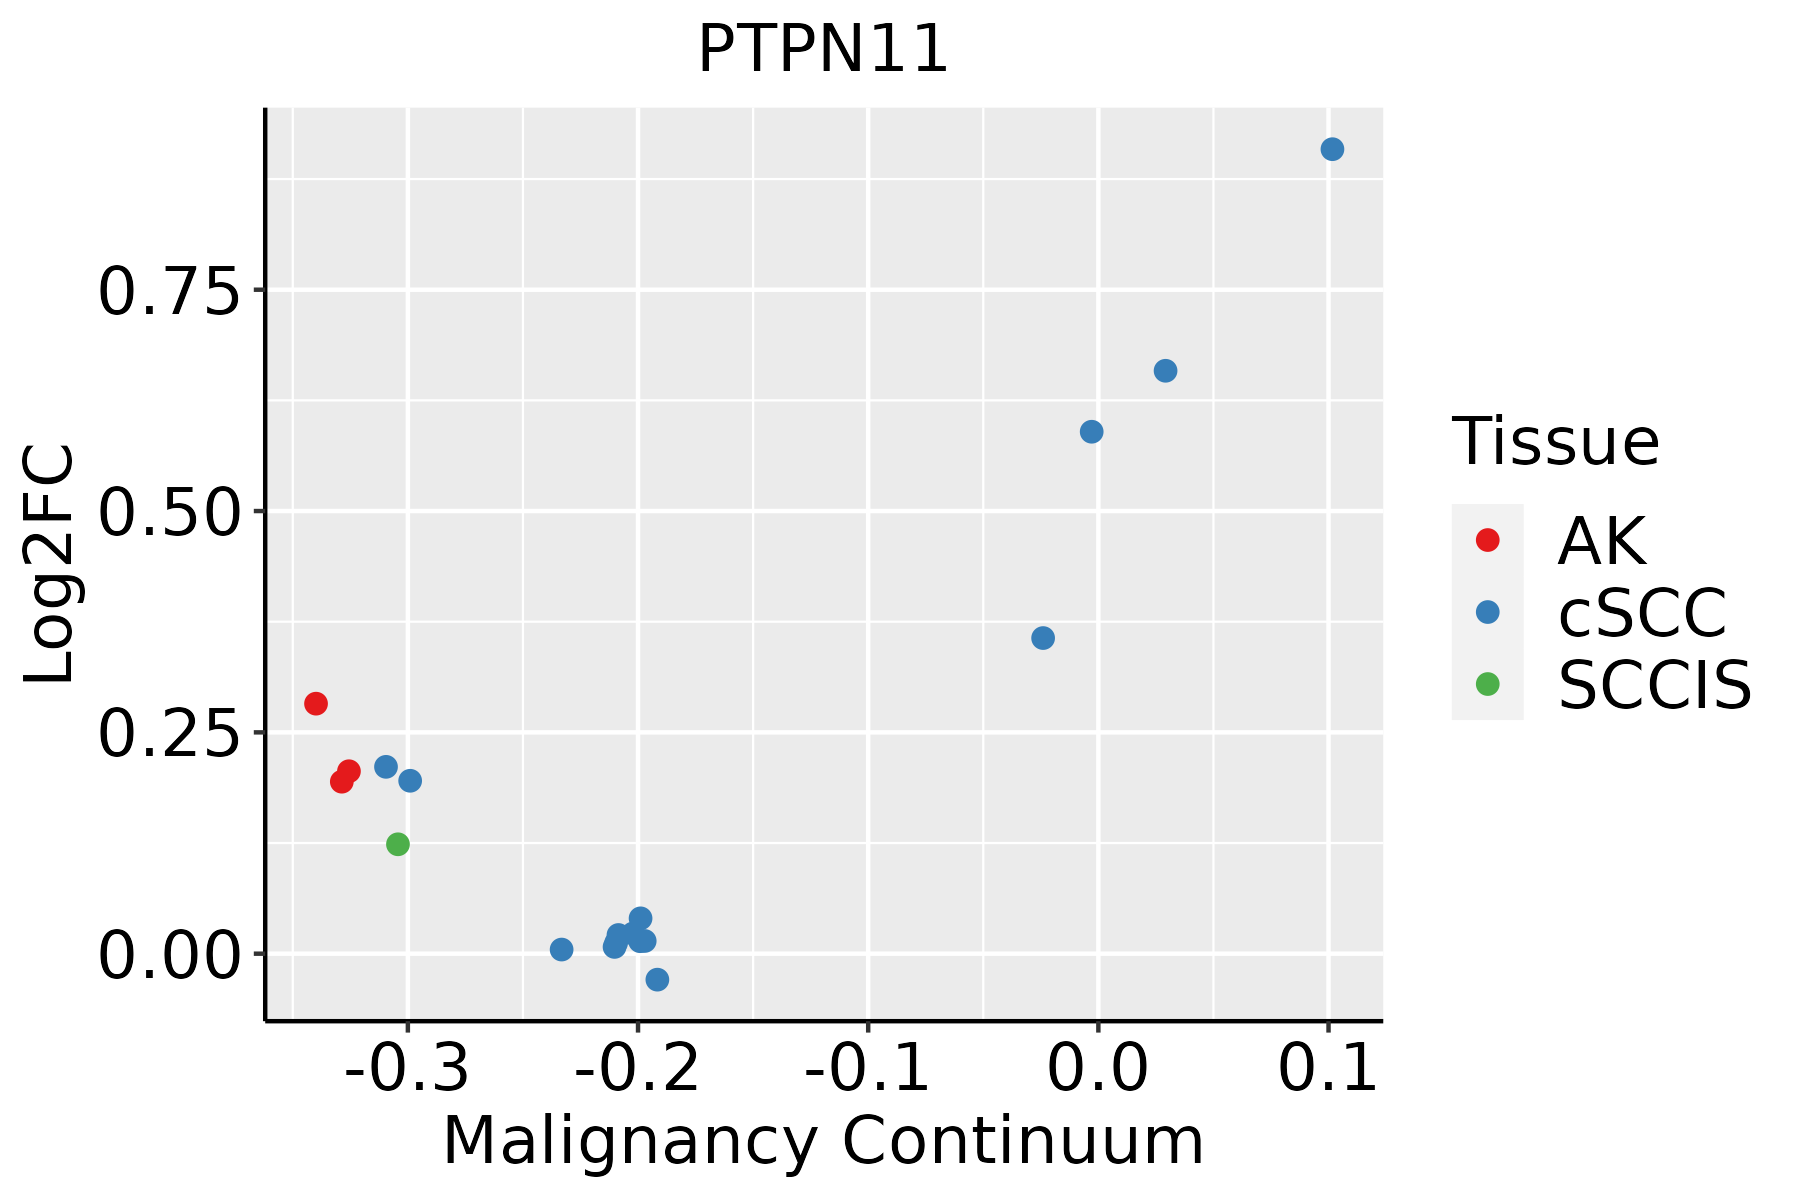 | AK: Actinic keratosis |
| cSCC: Cutaneous squamous cell carcinoma | ||
| SCCIS:squamous cell carcinoma in situ | ||
| Thyroid | 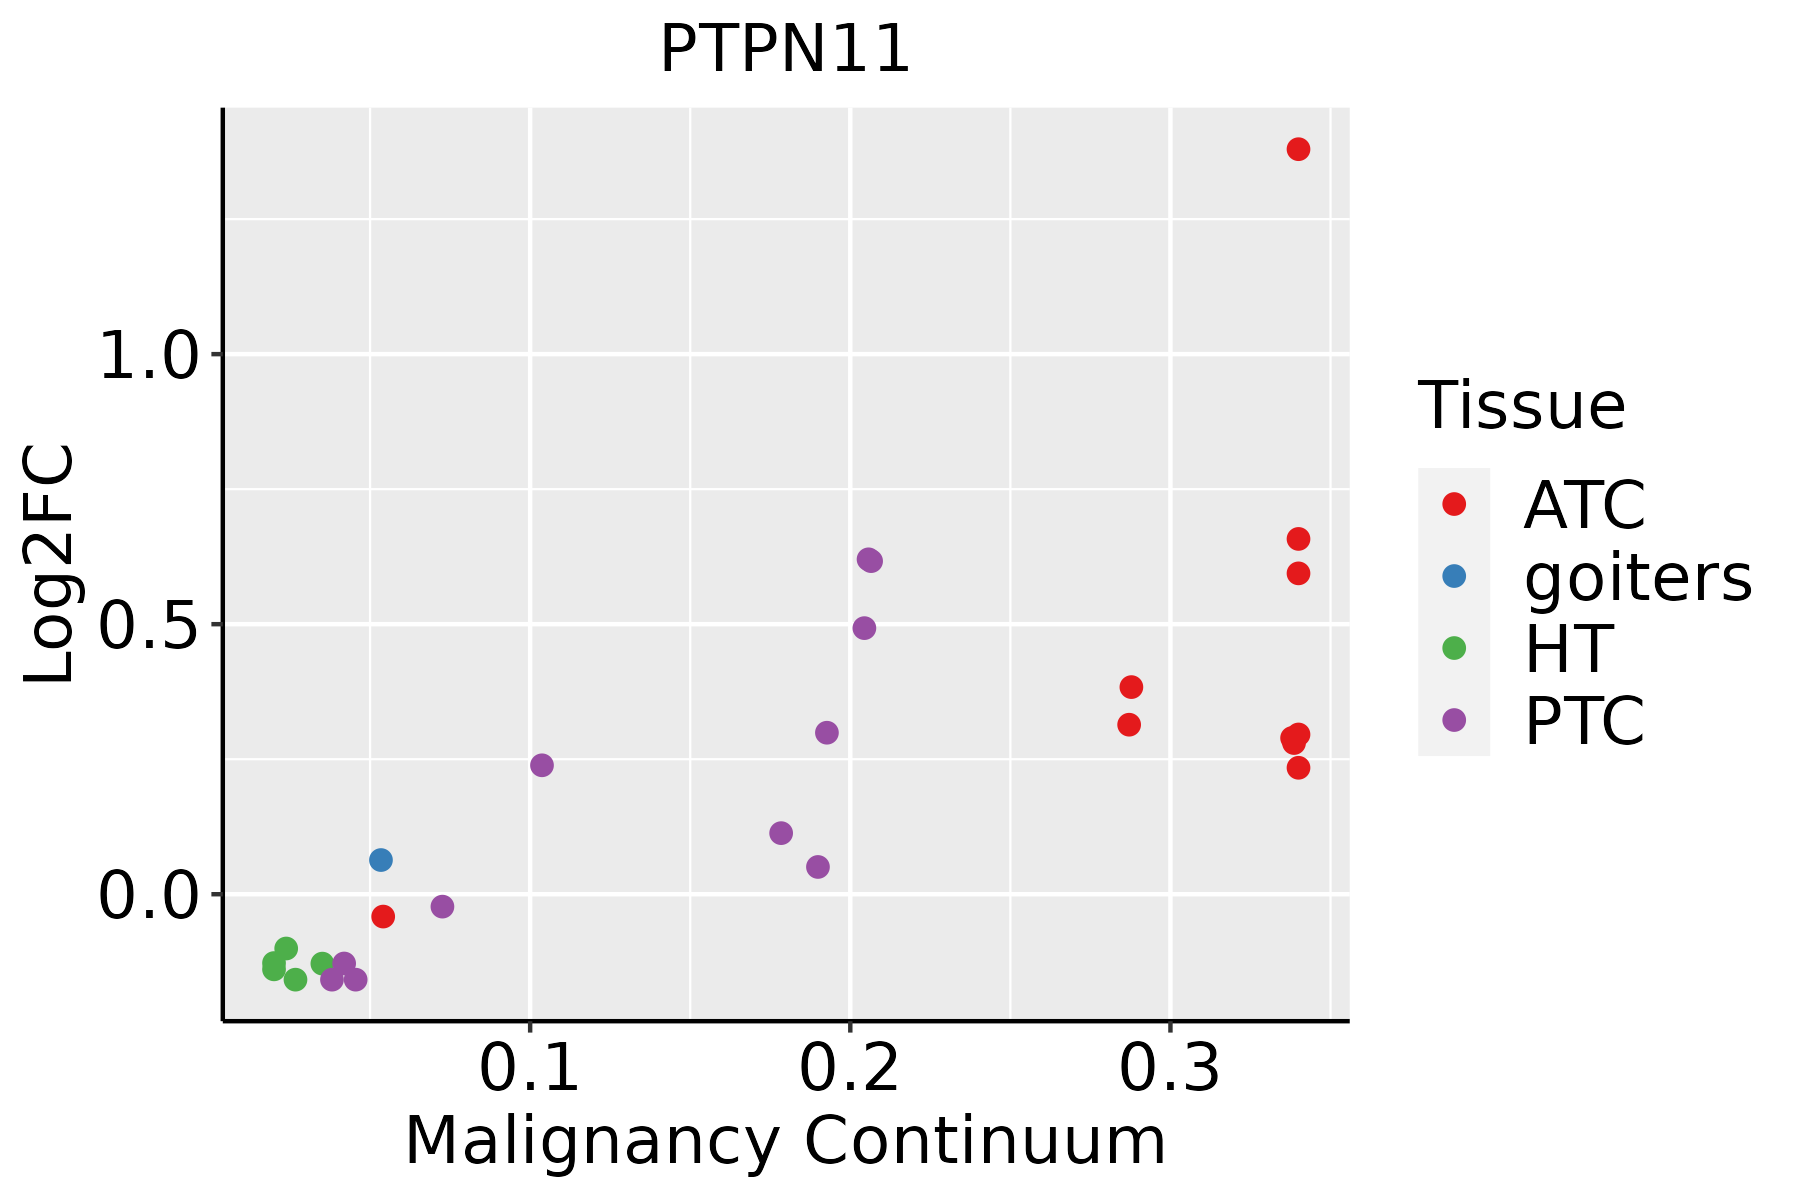 | ATC: Anaplastic thyroid cancer |
| HT: Hashimoto's thyroiditis | ||
| PTC: Papillary thyroid cancer |
| ∗log2FC in expression of this searched gene in stem-like cells from each diseased tissue sample relative to stem-like cells in normal samples in each tissue plotted against the malignancy continuum. Samples are colored based on if they are from different disease stage. |
Top |
Malignant transformation related pathway analysis |
| Find out the enriched GO biological processes and KEGG pathways involved in transition from healthy to precancer to cancer |
| Tissue | Disease Stage | Enriched GO biological Processes |
| Colorectum | AD |  |
| Colorectum | SER |  |
| Colorectum | MSS |  |
| Colorectum | MSI-H |  |
| Colorectum | FAP |  |
| ∗Top 15 enriched GO BP terms are showed in the bar plot of each disease state in each tissue. Each row represents a significant GO biological process which is colored according to the -log10(p.adjust). |
| Page: 1 2 3 4 5 6 7 8 9 |
| GO ID | Tissue | Disease Stage | Description | Gene Ratio | Bg Ratio | pvalue | p.adjust | Count |
| GO:0006913110 | Esophagus | ESCC | nucleocytoplasmic transport | 230/8552 | 301/18723 | 6.04e-28 | 2.02e-25 | 230 |
| GO:0051169110 | Esophagus | ESCC | nuclear transport | 230/8552 | 301/18723 | 6.04e-28 | 2.02e-25 | 230 |
| GO:003238618 | Esophagus | ESCC | regulation of intracellular transport | 243/8552 | 337/18723 | 3.20e-23 | 7.25e-21 | 243 |
| GO:0006979111 | Esophagus | ESCC | response to oxidative stress | 303/8552 | 446/18723 | 7.15e-22 | 1.30e-19 | 303 |
| GO:0051168110 | Esophagus | ESCC | nuclear export | 126/8552 | 154/18723 | 1.88e-20 | 2.65e-18 | 126 |
| GO:0062197111 | Esophagus | ESCC | cellular response to chemical stress | 234/8552 | 337/18723 | 5.37e-19 | 5.97e-17 | 234 |
| GO:0033157110 | Esophagus | ESCC | regulation of intracellular protein transport | 169/8552 | 229/18723 | 3.31e-18 | 3.23e-16 | 169 |
| GO:0043254111 | Esophagus | ESCC | regulation of protein-containing complex assembly | 278/8552 | 428/18723 | 3.81e-16 | 2.77e-14 | 278 |
| GO:000734615 | Esophagus | ESCC | regulation of mitotic cell cycle | 293/8552 | 457/18723 | 8.00e-16 | 5.64e-14 | 293 |
| GO:0046822110 | Esophagus | ESCC | regulation of nucleocytoplasmic transport | 88/8552 | 106/18723 | 1.88e-15 | 1.19e-13 | 88 |
| GO:0034599111 | Esophagus | ESCC | cellular response to oxidative stress | 197/8552 | 288/18723 | 3.76e-15 | 2.15e-13 | 197 |
| GO:0071496111 | Esophagus | ESCC | cellular response to external stimulus | 215/8552 | 320/18723 | 4.29e-15 | 2.43e-13 | 215 |
| GO:0000302111 | Esophagus | ESCC | response to reactive oxygen species | 150/8552 | 222/18723 | 3.06e-11 | 1.02e-09 | 150 |
| GO:190198713 | Esophagus | ESCC | regulation of cell cycle phase transition | 242/8552 | 390/18723 | 3.86e-11 | 1.26e-09 | 242 |
| GO:0150115110 | Esophagus | ESCC | cell-substrate junction organization | 77/8552 | 101/18723 | 3.46e-10 | 9.57e-09 | 77 |
| GO:00457865 | Esophagus | ESCC | negative regulation of cell cycle | 236/8552 | 385/18723 | 3.62e-10 | 9.93e-09 | 236 |
| GO:00000754 | Esophagus | ESCC | cell cycle checkpoint | 117/8552 | 169/18723 | 4.47e-10 | 1.17e-08 | 117 |
| GO:000704418 | Esophagus | ESCC | cell-substrate junction assembly | 73/8552 | 95/18723 | 5.27e-10 | 1.35e-08 | 73 |
| GO:007121419 | Esophagus | ESCC | cellular response to abiotic stimulus | 206/8552 | 331/18723 | 7.52e-10 | 1.88e-08 | 206 |
| GO:010400419 | Esophagus | ESCC | cellular response to environmental stimulus | 206/8552 | 331/18723 | 7.52e-10 | 1.88e-08 | 206 |
| Page: 1 2 3 4 5 6 7 8 9 10 11 12 13 14 15 16 17 18 19 20 21 22 23 24 25 26 27 28 29 30 31 32 33 34 35 36 37 38 39 40 41 42 43 44 45 46 47 48 49 50 51 52 53 54 55 56 57 58 59 60 |
| Pathway ID | Tissue | Disease Stage | Description | Gene Ratio | Bg Ratio | pvalue | p.adjust | qvalue | Count |
| hsa05208211 | Esophagus | ESCC | Chemical carcinogenesis - reactive oxygen species | 168/4205 | 223/8465 | 1.83e-15 | 6.81e-14 | 3.49e-14 | 168 |
| hsa05130211 | Esophagus | ESCC | Pathogenic Escherichia coli infection | 142/4205 | 197/8465 | 8.21e-11 | 1.06e-09 | 5.42e-10 | 142 |
| hsa0522020 | Esophagus | ESCC | Chronic myeloid leukemia | 61/4205 | 76/8465 | 3.20e-08 | 2.68e-07 | 1.37e-07 | 61 |
| hsa0520529 | Esophagus | ESCC | Proteoglycans in cancer | 138/4205 | 205/8465 | 1.79e-07 | 1.40e-06 | 7.15e-07 | 138 |
| hsa046259 | Esophagus | ESCC | C-type lectin receptor signaling pathway | 73/4205 | 104/8465 | 1.57e-05 | 7.98e-05 | 4.09e-05 | 73 |
| hsa0512018 | Esophagus | ESCC | Epithelial cell signaling in Helicobacter pylori infection | 52/4205 | 70/8465 | 2.17e-05 | 1.07e-04 | 5.47e-05 | 52 |
| hsa0521118 | Esophagus | ESCC | Renal cell carcinoma | 51/4205 | 69/8465 | 3.29e-05 | 1.53e-04 | 7.83e-05 | 51 |
| hsa0472225 | Esophagus | ESCC | Neurotrophin signaling pathway | 80/4205 | 119/8465 | 7.33e-05 | 3.07e-04 | 1.57e-04 | 80 |
| hsa049318 | Esophagus | ESCC | Insulin resistance | 69/4205 | 108/8465 | 1.92e-03 | 5.54e-03 | 2.84e-03 | 69 |
| hsa052356 | Esophagus | ESCC | PD-L1 expression and PD-1 checkpoint pathway in cancer | 58/4205 | 89/8465 | 2.19e-03 | 6.16e-03 | 3.16e-03 | 58 |
| hsa0436016 | Esophagus | ESCC | Axon guidance | 108/4205 | 182/8465 | 5.13e-03 | 1.30e-02 | 6.67e-03 | 108 |
| hsa05208310 | Esophagus | ESCC | Chemical carcinogenesis - reactive oxygen species | 168/4205 | 223/8465 | 1.83e-15 | 6.81e-14 | 3.49e-14 | 168 |
| hsa05130310 | Esophagus | ESCC | Pathogenic Escherichia coli infection | 142/4205 | 197/8465 | 8.21e-11 | 1.06e-09 | 5.42e-10 | 142 |
| hsa05220110 | Esophagus | ESCC | Chronic myeloid leukemia | 61/4205 | 76/8465 | 3.20e-08 | 2.68e-07 | 1.37e-07 | 61 |
| hsa0520537 | Esophagus | ESCC | Proteoglycans in cancer | 138/4205 | 205/8465 | 1.79e-07 | 1.40e-06 | 7.15e-07 | 138 |
| hsa0462513 | Esophagus | ESCC | C-type lectin receptor signaling pathway | 73/4205 | 104/8465 | 1.57e-05 | 7.98e-05 | 4.09e-05 | 73 |
| hsa0512019 | Esophagus | ESCC | Epithelial cell signaling in Helicobacter pylori infection | 52/4205 | 70/8465 | 2.17e-05 | 1.07e-04 | 5.47e-05 | 52 |
| hsa0521119 | Esophagus | ESCC | Renal cell carcinoma | 51/4205 | 69/8465 | 3.29e-05 | 1.53e-04 | 7.83e-05 | 51 |
| hsa04722111 | Esophagus | ESCC | Neurotrophin signaling pathway | 80/4205 | 119/8465 | 7.33e-05 | 3.07e-04 | 1.57e-04 | 80 |
| hsa0493113 | Esophagus | ESCC | Insulin resistance | 69/4205 | 108/8465 | 1.92e-03 | 5.54e-03 | 2.84e-03 | 69 |
| Page: 1 2 3 4 5 6 7 |
Top |
Cell-cell communication analysis |
| Identification of potential cell-cell interactions between two cell types and their ligand-receptor pairs for different disease states |
| Ligand | Receptor | LRpair | Pathway | Tissue | Disease Stage |
| Page: 1 |
Top |
Single-cell gene regulatory network inference analysis |
| Find out the significant the regulons (TFs) and the target genes of each regulon across cell types for different disease states |
| TF | Cell Type | Tissue | Disease Stage | Target Gene | RSS | Regulon Activity |
| ∗The dot plots of a searched regulon are shown for all cell subpopulations in each disease state of each tissue based on the regulon specific score inferred using pySCENIC and by calculating the average expression. |
| Page: 1 |
Top |
Somatic mutation of malignant transformation related genes |
| Annotation of somatic variants for genes involved in malignant transformation |
| Hugo Symbol | Variant Class | Variant Classification | dbSNP RS | HGVSc | HGVSp | HGVSp Short | SWISSPROT | BIOTYPE | SIFT | PolyPhen | Tumor Sample Barcode | Tissue | Histology | Sex | Age | Stage | Therapy Types | Drugs | Outcome |
| PTPN11 | SNV | Missense_Mutation | c.436N>T | p.Asp146Tyr | p.D146Y | Q06124 | protein_coding | deleterious(0) | probably_damaging(0.986) | TCGA-AN-A046-01 | Breast | breast invasive carcinoma | Female | >=65 | I/II | Unknown | Unknown | SD | |
| PTPN11 | SNV | Missense_Mutation | c.38N>A | p.Gly13Asp | p.G13D | Q06124 | protein_coding | deleterious(0) | probably_damaging(1) | TCGA-C8-A12L-01 | Breast | breast invasive carcinoma | Female | >=65 | I/II | Unknown | Unknown | SD | |
| PTPN11 | SNV | Missense_Mutation | novel | c.626T>C | p.Val209Ala | p.V209A | Q06124 | protein_coding | tolerated(0.06) | benign(0.02) | TCGA-C5-A7CG-01 | Cervix | cervical & endocervical cancer | Female | <65 | I/II | Unknown | Unknown | SD |
| PTPN11 | SNV | Missense_Mutation | novel | c.1082N>G | p.Glu361Gly | p.E361G | Q06124 | protein_coding | deleterious(0.01) | possibly_damaging(0.908) | TCGA-C5-A8YT-01 | Cervix | cervical & endocervical cancer | Female | <65 | I/II | Chemotherapy | cisplatin | PD |
| PTPN11 | SNV | Missense_Mutation | rs397507512 | c.211N>C | p.Phe71Leu | p.F71L | Q06124 | protein_coding | deleterious(0) | probably_damaging(0.945) | TCGA-A6-2684-01 | Colorectum | colon adenocarcinoma | Female | >=65 | I/II | Unknown | Unknown | PD |
| PTPN11 | SNV | Missense_Mutation | rs397507546 | c.1520N>T | p.Gly507Val | p.G507V | Q06124 | protein_coding | deleterious(0) | probably_damaging(0.999) | TCGA-A6-A565-01 | Colorectum | colon adenocarcinoma | Female | <65 | III/IV | Unspecific | 5FU | PD |
| PTPN11 | SNV | Missense_Mutation | c.207N>T | p.Glu69Asp | p.E69D | Q06124 | protein_coding | tolerated(0.05) | benign(0.135) | TCGA-AA-3977-01 | Colorectum | colon adenocarcinoma | Male | >=65 | I/II | Unknown | Unknown | SD | |
| PTPN11 | SNV | Missense_Mutation | c.463G>A | p.Asp155Asn | p.D155N | Q06124 | protein_coding | tolerated(0.08) | benign(0.074) | TCGA-AD-6964-01 | Colorectum | colon adenocarcinoma | Male | <65 | III/IV | Chemotherapy | folfox | PD | |
| PTPN11 | SNV | Missense_Mutation | novel | c.1405N>T | p.Arg469Trp | p.R469W | Q06124 | protein_coding | deleterious(0) | probably_damaging(0.998) | TCGA-AZ-6601-01 | Colorectum | colon adenocarcinoma | Male | >=65 | I/II | Unknown | Unknown | PD |
| PTPN11 | SNV | Missense_Mutation | c.1547N>A | p.Arg516Gln | p.R516Q | Q06124 | protein_coding | tolerated(0.12) | benign(0.015) | TCGA-CA-6718-01 | Colorectum | colon adenocarcinoma | Male | <65 | I/II | Unknown | Unknown | PD |
| Page: 1 2 3 4 5 6 7 8 |
Top |
Related drugs of malignant transformation related genes |
| Identification of chemicals and drugs interact with genes involved in malignant transfromation |
| (DGIdb 4.0) |
| Entrez ID | Symbol | Category | Interaction Types | Drug Claim Name | Drug Name | PMIDs |
| 5781 | PTPN11 | DRUGGABLE GENOME, KINASE, PROTEIN PHOSPHATASE, ENZYME, CLINICALLY ACTIONABLE | II-B08 | 20170098 | ||
| 5781 | PTPN11 | DRUGGABLE GENOME, KINASE, PROTEIN PHOSPHATASE, ENZYME, CLINICALLY ACTIONABLE | U0126 | 17942397 | ||
| 5781 | PTPN11 | DRUGGABLE GENOME, KINASE, PROTEIN PHOSPHATASE, ENZYME, CLINICALLY ACTIONABLE | 4-HYDRAZINYLBENZENESULFONIC ACID | CHEMBL510966 | 19007293 | |
| 5781 | PTPN11 | DRUGGABLE GENOME, KINASE, PROTEIN PHOSPHATASE, ENZYME, CLINICALLY ACTIONABLE | cryptotanshinone | CRYPTOTANSHINONE | 23957426 | |
| 5781 | PTPN11 | DRUGGABLE GENOME, KINASE, PROTEIN PHOSPHATASE, ENZYME, CLINICALLY ACTIONABLE | PLX4720 | PLX-4720 | 26351322 | |
| 5781 | PTPN11 | DRUGGABLE GENOME, KINASE, PROTEIN PHOSPHATASE, ENZYME, CLINICALLY ACTIONABLE | MESO-2,3-DIMERCAPTOSUCCINIC ACID | CHEMBL28721 | ||
| 5781 | PTPN11 | DRUGGABLE GENOME, KINASE, PROTEIN PHOSPHATASE, ENZYME, CLINICALLY ACTIONABLE | OLTIPRAZ | OLTIPRAZ | 20655236 | |
| 5781 | PTPN11 | DRUGGABLE GENOME, KINASE, PROTEIN PHOSPHATASE, ENZYME, CLINICALLY ACTIONABLE | Refametinib | REFAMETINIB | ||
| 5781 | PTPN11 | DRUGGABLE GENOME, KINASE, PROTEIN PHOSPHATASE, ENZYME, CLINICALLY ACTIONABLE | N/A | 19047918,21901340 | ||
| 5781 | PTPN11 | DRUGGABLE GENOME, KINASE, PROTEIN PHOSPHATASE, ENZYME, CLINICALLY ACTIONABLE | TNO155 |
| Page: 1 2 |

Copyright 2023-Present -The University of Texas Health Science Center at Houston |