
|
|||||
|
 | |
| |
| |
| |
| |
| |
|
Gene: PTPMT1 |
Gene summary for PTPMT1 |
| Gene information | Species | Human | Gene symbol | PTPMT1 | Gene ID | 114971 |
| Gene name | protein tyrosine phosphatase mitochondrial 1 | |
| Gene Alias | DUSP23 | |
| Cytomap | 11p11.2 | |
| Gene Type | protein-coding | GO ID | GO:0006464 | UniProtAcc | Q8WUK0 |
Top |
Malignant transformation analysis |
| Identification of the aberrant gene expression in precancerous and cancerous lesions by comparing the gene expression of stem-like cells in diseased tissues with normal stem cells |
| Entrez ID | Symbol | Replicates | Species | Organ | Tissue | Adj P-value | Log2FC | Malignancy |
| 114971 | PTPMT1 | LZE4T | Human | Esophagus | ESCC | 6.94e-15 | 4.15e-01 | 0.0811 |
| 114971 | PTPMT1 | LZE5T | Human | Esophagus | ESCC | 4.98e-03 | 2.58e-01 | 0.0514 |
| 114971 | PTPMT1 | LZE7T | Human | Esophagus | ESCC | 3.49e-09 | 3.33e-01 | 0.0667 |
| 114971 | PTPMT1 | LZE8T | Human | Esophagus | ESCC | 2.56e-04 | 1.93e-01 | 0.067 |
| 114971 | PTPMT1 | LZE20T | Human | Esophagus | ESCC | 4.08e-05 | 2.31e-01 | 0.0662 |
| 114971 | PTPMT1 | LZE22T | Human | Esophagus | ESCC | 4.13e-04 | 2.85e-01 | 0.068 |
| 114971 | PTPMT1 | LZE24T | Human | Esophagus | ESCC | 5.74e-27 | 6.58e-01 | 0.0596 |
| 114971 | PTPMT1 | LZE21T | Human | Esophagus | ESCC | 3.36e-07 | 3.78e-01 | 0.0655 |
| 114971 | PTPMT1 | LZE6T | Human | Esophagus | ESCC | 4.21e-03 | 1.38e-01 | 0.0845 |
| 114971 | PTPMT1 | P1T-E | Human | Esophagus | ESCC | 1.10e-11 | 4.75e-01 | 0.0875 |
| 114971 | PTPMT1 | P2T-E | Human | Esophagus | ESCC | 1.78e-36 | 6.24e-01 | 0.1177 |
| 114971 | PTPMT1 | P4T-E | Human | Esophagus | ESCC | 1.59e-34 | 7.35e-01 | 0.1323 |
| 114971 | PTPMT1 | P5T-E | Human | Esophagus | ESCC | 1.56e-15 | 3.17e-01 | 0.1327 |
| 114971 | PTPMT1 | P8T-E | Human | Esophagus | ESCC | 6.32e-34 | 5.52e-01 | 0.0889 |
| 114971 | PTPMT1 | P9T-E | Human | Esophagus | ESCC | 1.32e-24 | 5.86e-01 | 0.1131 |
| 114971 | PTPMT1 | P10T-E | Human | Esophagus | ESCC | 9.62e-22 | 4.06e-01 | 0.116 |
| 114971 | PTPMT1 | P11T-E | Human | Esophagus | ESCC | 1.20e-27 | 8.70e-01 | 0.1426 |
| 114971 | PTPMT1 | P12T-E | Human | Esophagus | ESCC | 1.93e-34 | 5.78e-01 | 0.1122 |
| 114971 | PTPMT1 | P15T-E | Human | Esophagus | ESCC | 4.68e-29 | 5.74e-01 | 0.1149 |
| 114971 | PTPMT1 | P16T-E | Human | Esophagus | ESCC | 6.94e-25 | 4.25e-01 | 0.1153 |
| Page: 1 2 3 4 5 6 |
| Tissue | Expression Dynamics | Abbreviation |
| Esophagus |  | ESCC: Esophageal squamous cell carcinoma |
| HGIN: High-grade intraepithelial neoplasias | ||
| LGIN: Low-grade intraepithelial neoplasias | ||
| Liver | 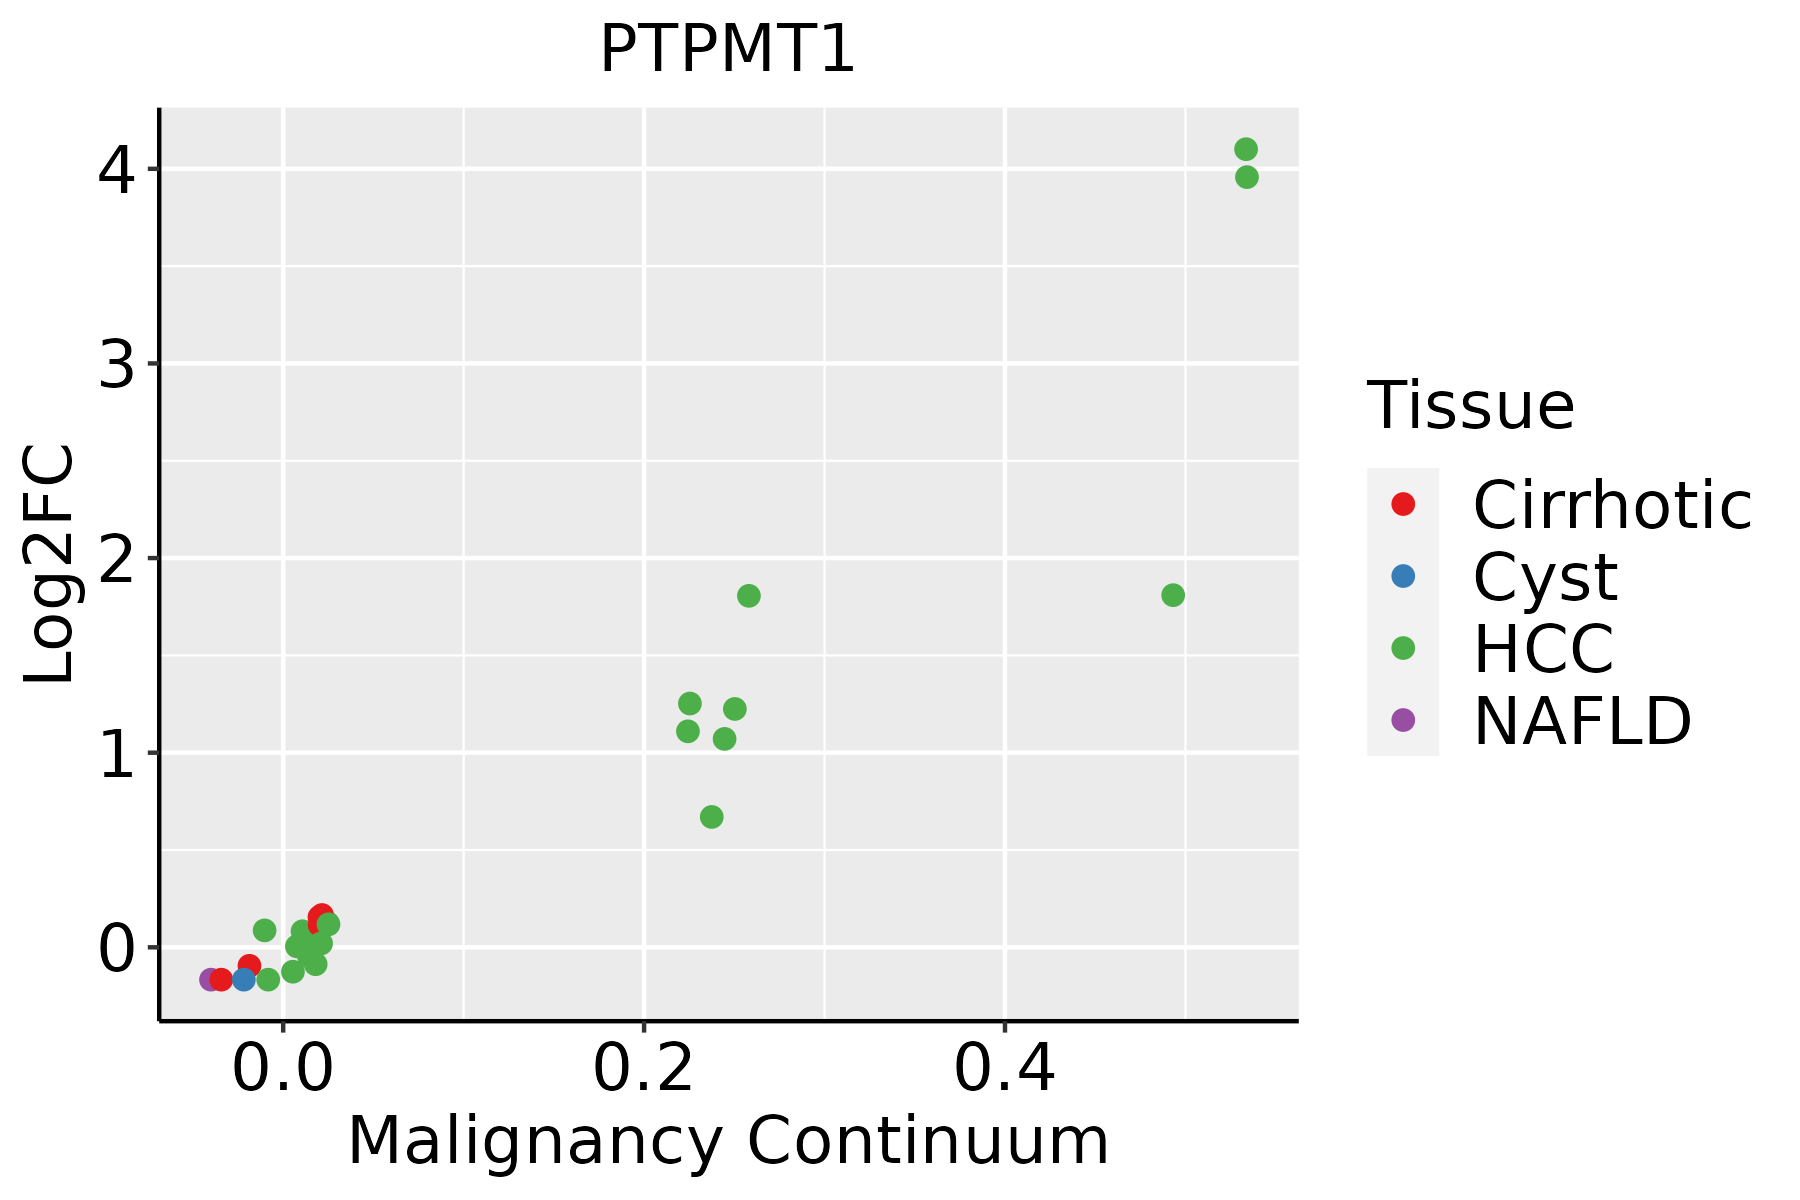 | HCC: Hepatocellular carcinoma |
| NAFLD: Non-alcoholic fatty liver disease | ||
| Oral Cavity |  | EOLP: Erosive Oral lichen planus |
| LP: leukoplakia | ||
| NEOLP: Non-erosive oral lichen planus | ||
| OSCC: Oral squamous cell carcinoma | ||
| Prostate | 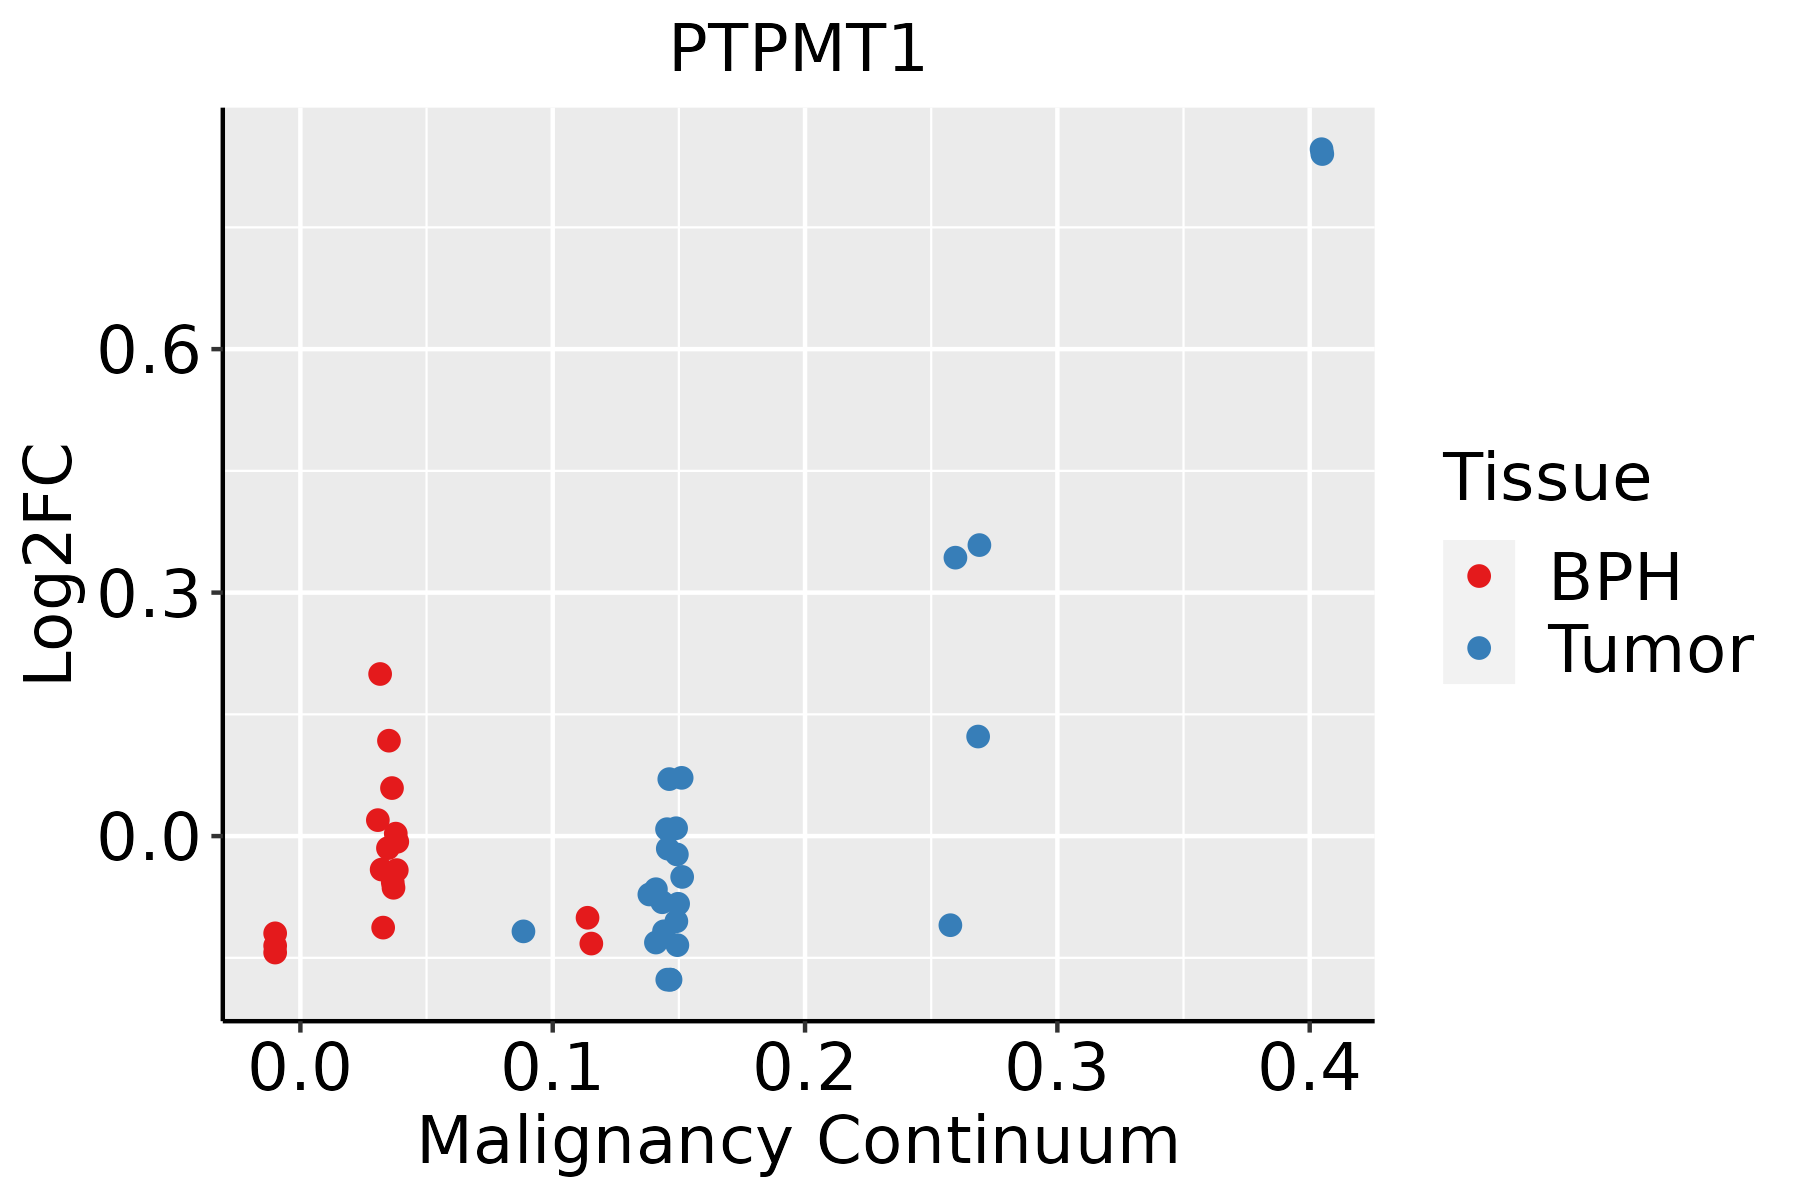 | BPH: Benign Prostatic Hyperplasia |
| Skin | 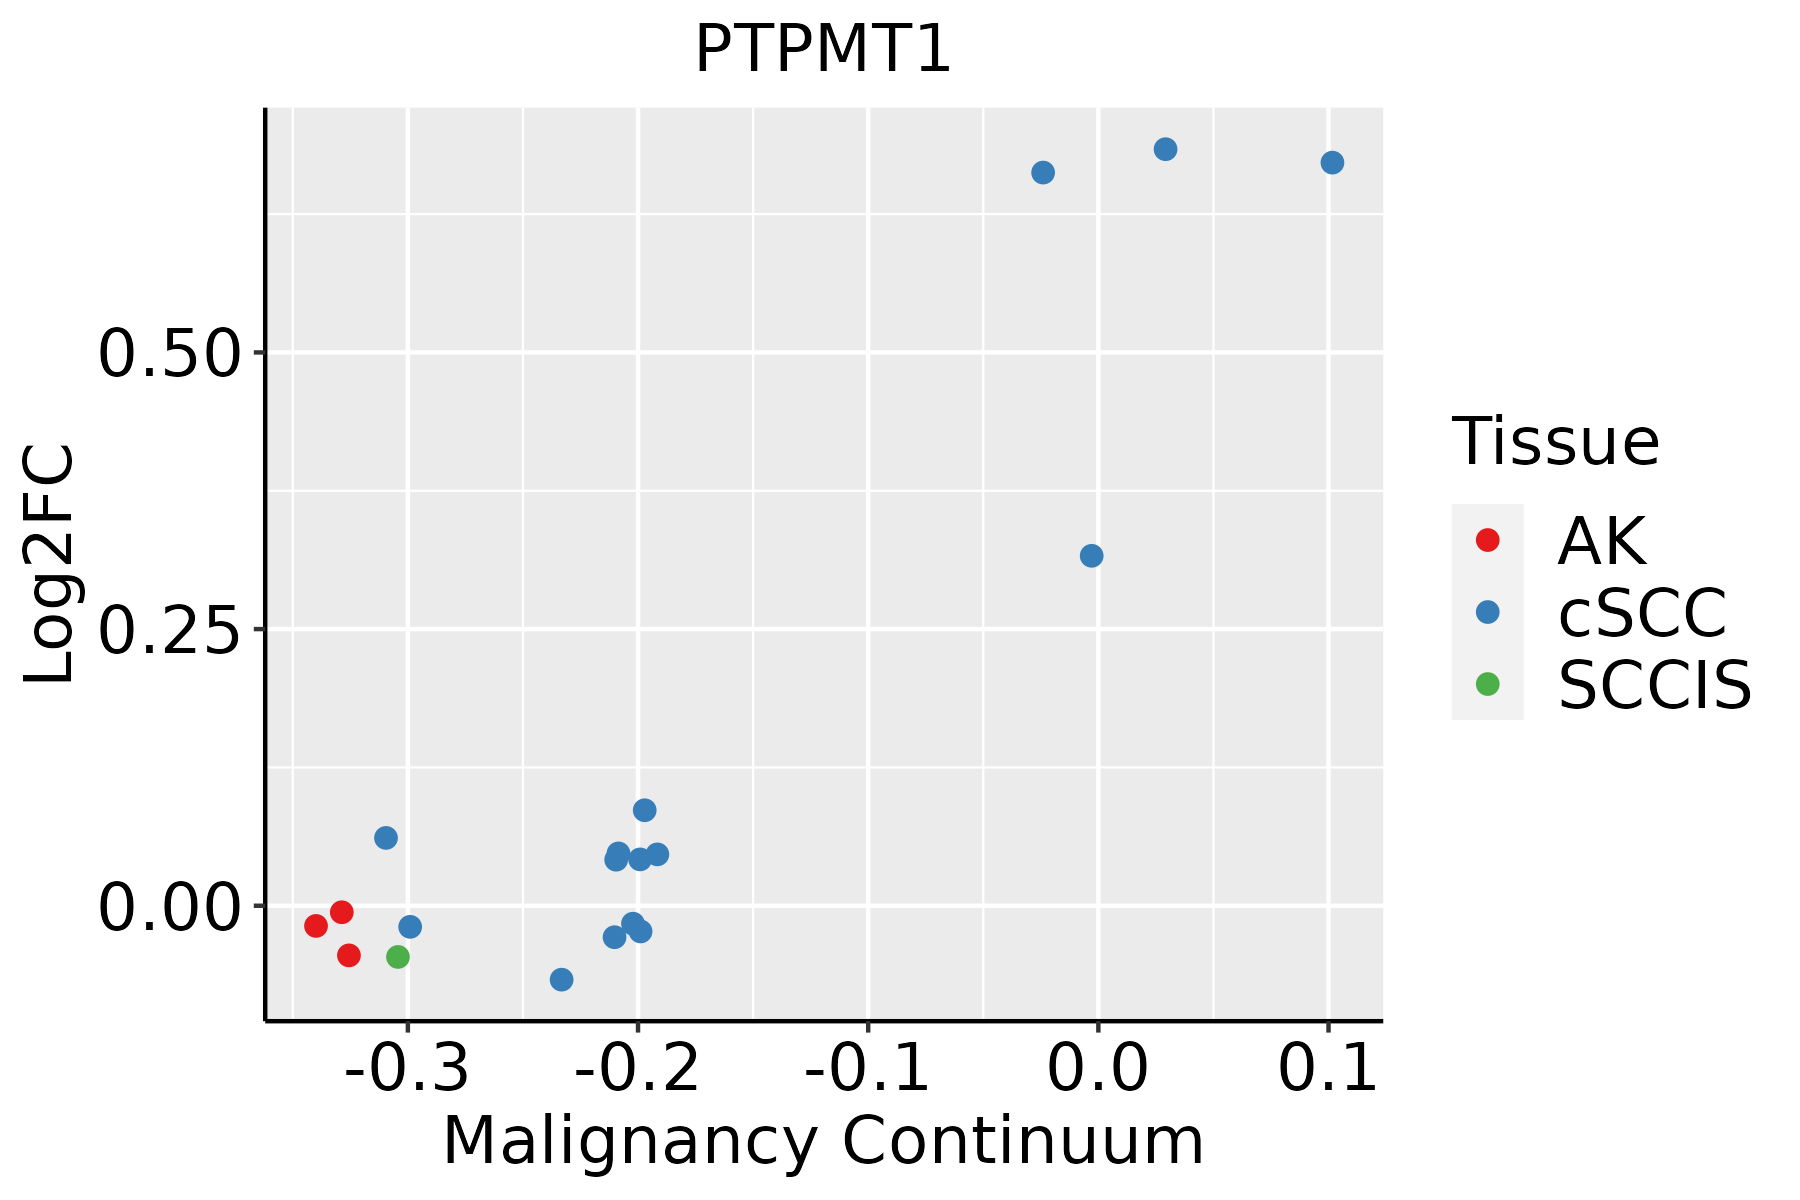 | AK: Actinic keratosis |
| cSCC: Cutaneous squamous cell carcinoma | ||
| SCCIS:squamous cell carcinoma in situ | ||
| Thyroid |  | ATC: Anaplastic thyroid cancer |
| HT: Hashimoto's thyroiditis | ||
| PTC: Papillary thyroid cancer |
| ∗log2FC in expression of this searched gene in stem-like cells from each diseased tissue sample relative to stem-like cells in normal samples in each tissue plotted against the malignancy continuum. Samples are colored based on if they are from different disease stage. |
Top |
Malignant transformation related pathway analysis |
| Find out the enriched GO biological processes and KEGG pathways involved in transition from healthy to precancer to cancer |
| Tissue | Disease Stage | Enriched GO biological Processes |
| Colorectum | AD |  |
| Colorectum | SER |  |
| Colorectum | MSS |  |
| Colorectum | MSI-H |  |
| Colorectum | FAP |  |
| ∗Top 15 enriched GO BP terms are showed in the bar plot of each disease state in each tissue. Each row represents a significant GO biological process which is colored according to the -log10(p.adjust). |
| Page: 1 2 3 4 5 6 7 8 9 |
| GO ID | Tissue | Disease Stage | Description | Gene Ratio | Bg Ratio | pvalue | p.adjust | Count |
| GO:0097193111 | Esophagus | ESCC | intrinsic apoptotic signaling pathway | 222/8552 | 288/18723 | 5.87e-28 | 2.02e-25 | 222 |
| GO:2001233111 | Esophagus | ESCC | regulation of apoptotic signaling pathway | 256/8552 | 356/18723 | 4.11e-24 | 1.04e-21 | 256 |
| GO:2001242111 | Esophagus | ESCC | regulation of intrinsic apoptotic signaling pathway | 128/8552 | 164/18723 | 1.75e-17 | 1.50e-15 | 128 |
| GO:001631110 | Esophagus | ESCC | dephosphorylation | 251/8552 | 417/18723 | 1.26e-09 | 2.99e-08 | 251 |
| GO:00086544 | Esophagus | ESCC | phospholipid biosynthetic process | 162/8552 | 253/18723 | 2.59e-09 | 5.73e-08 | 162 |
| GO:000647018 | Esophagus | ESCC | protein dephosphorylation | 177/8552 | 281/18723 | 3.13e-09 | 6.72e-08 | 177 |
| GO:00464744 | Esophagus | ESCC | glycerophospholipid biosynthetic process | 135/8552 | 211/18723 | 5.75e-08 | 1.02e-06 | 135 |
| GO:00450175 | Esophagus | ESCC | glycerolipid biosynthetic process | 154/8552 | 252/18723 | 5.20e-07 | 6.96e-06 | 154 |
| GO:00066446 | Esophagus | ESCC | phospholipid metabolic process | 218/8552 | 383/18723 | 5.37e-06 | 5.59e-05 | 218 |
| GO:00066505 | Esophagus | ESCC | glycerophospholipid metabolic process | 174/8552 | 306/18723 | 4.92e-05 | 3.85e-04 | 174 |
| GO:00464864 | Esophagus | ESCC | glycerolipid metabolic process | 211/8552 | 392/18723 | 6.51e-04 | 3.46e-03 | 211 |
| GO:200123312 | Liver | Cirrhotic | regulation of apoptotic signaling pathway | 163/4634 | 356/18723 | 2.62e-18 | 4.43e-16 | 163 |
| GO:009719312 | Liver | Cirrhotic | intrinsic apoptotic signaling pathway | 130/4634 | 288/18723 | 2.69e-14 | 2.45e-12 | 130 |
| GO:20012427 | Liver | Cirrhotic | regulation of intrinsic apoptotic signaling pathway | 82/4634 | 164/18723 | 2.35e-12 | 1.71e-10 | 82 |
| GO:000647011 | Liver | Cirrhotic | protein dephosphorylation | 96/4634 | 281/18723 | 2.32e-04 | 2.11e-03 | 96 |
| GO:001631111 | Liver | Cirrhotic | dephosphorylation | 130/4634 | 417/18723 | 1.58e-03 | 1.03e-02 | 130 |
| GO:200123322 | Liver | HCC | regulation of apoptotic signaling pathway | 226/7958 | 356/18723 | 7.26e-16 | 5.68e-14 | 226 |
| GO:009719322 | Liver | HCC | intrinsic apoptotic signaling pathway | 184/7958 | 288/18723 | 1.50e-13 | 8.32e-12 | 184 |
| GO:200124212 | Liver | HCC | regulation of intrinsic apoptotic signaling pathway | 109/7958 | 164/18723 | 4.52e-10 | 1.45e-08 | 109 |
| GO:00086542 | Liver | HCC | phospholipid biosynthetic process | 150/7958 | 253/18723 | 4.77e-08 | 1.03e-06 | 150 |
| Page: 1 2 3 4 |
| Pathway ID | Tissue | Disease Stage | Description | Gene Ratio | Bg Ratio | pvalue | p.adjust | qvalue | Count |
| Page: 1 |
Top |
Cell-cell communication analysis |
| Identification of potential cell-cell interactions between two cell types and their ligand-receptor pairs for different disease states |
| Ligand | Receptor | LRpair | Pathway | Tissue | Disease Stage |
| Page: 1 |
Top |
Single-cell gene regulatory network inference analysis |
| Find out the significant the regulons (TFs) and the target genes of each regulon across cell types for different disease states |
| TF | Cell Type | Tissue | Disease Stage | Target Gene | RSS | Regulon Activity |
| PTPMT1 | TRANS | Cervix | CC | CRABP2,KRTDAP,PDZK1IP1, etc. | 9.27e-02 |  |
| PTPMT1 | TRANS | Cervix | N_HPV | CRABP2,KRTDAP,PDZK1IP1, etc. | 2.79e-01 |  |
| PTPMT1 | DIF | Skin | SCCIS | EIF5AL1,RAC3,ALG1L, etc. | 5.76e-01 |  |
| ∗The dot plots of a searched regulon are shown for all cell subpopulations in each disease state of each tissue based on the regulon specific score inferred using pySCENIC and by calculating the average expression. |
| Page: 1 |
Top |
Somatic mutation of malignant transformation related genes |
| Annotation of somatic variants for genes involved in malignant transformation |
| Hugo Symbol | Variant Class | Variant Classification | dbSNP RS | HGVSc | HGVSp | HGVSp Short | SWISSPROT | BIOTYPE | SIFT | PolyPhen | Tumor Sample Barcode | Tissue | Histology | Sex | Age | Stage | Therapy Types | Drugs | Outcome |
| PTPMT1 | SNV | Missense_Mutation | rs201520358 | c.487N>A | p.Ala163Thr | p.A163T | Q8WUK0 | protein_coding | tolerated(0.64) | benign(0.003) | TCGA-A6-6653-01 | Colorectum | colon adenocarcinoma | Male | >=65 | I/II | Unknown | Unknown | SD |
| PTPMT1 | SNV | Missense_Mutation | novel | c.600N>T | p.Lys200Asn | p.K200N | Q8WUK0 | protein_coding | tolerated_low_confidence(0.09) | benign(0) | TCGA-AA-3984-01 | Colorectum | colon adenocarcinoma | Female | <65 | I/II | Unknown | Unknown | SD |
| PTPMT1 | SNV | Missense_Mutation | c.506N>A | p.Ile169Asn | p.I169N | Q8WUK0 | protein_coding | deleterious(0) | probably_damaging(0.996) | TCGA-AA-A01R-01 | Colorectum | colon adenocarcinoma | Male | <65 | III/IV | Chemotherapy | 5-fluorouracil | PD | |
| PTPMT1 | SNV | Missense_Mutation | c.392N>G | p.His131Arg | p.H131R | Q8WUK0 | protein_coding | deleterious(0) | probably_damaging(0.999) | TCGA-AD-A5EJ-01 | Colorectum | colon adenocarcinoma | Female | >=65 | I/II | Unknown | Unknown | SD | |
| PTPMT1 | SNV | Missense_Mutation | rs376762868 | c.343N>A | p.Val115Ile | p.V115I | Q8WUK0 | protein_coding | deleterious(0) | probably_damaging(0.995) | TCGA-CM-6164-01 | Colorectum | colon adenocarcinoma | Female | <65 | I/II | Unknown | Unknown | SD |
| PTPMT1 | SNV | Missense_Mutation | c.200G>T | p.Gly67Val | p.G67V | Q8WUK0 | protein_coding | deleterious(0) | probably_damaging(0.975) | TCGA-DM-A1HB-01 | Colorectum | colon adenocarcinoma | Male | >=65 | III/IV | Unknown | Unknown | SD | |
| PTPMT1 | SNV | Missense_Mutation | novel | c.391N>T | p.His131Tyr | p.H131Y | Q8WUK0 | protein_coding | deleterious(0) | probably_damaging(1) | TCGA-A5-A0G2-01 | Endometrium | uterine corpus endometrioid carcinoma | Female | <65 | III/IV | Unknown | Unknown | SD |
| PTPMT1 | SNV | Missense_Mutation | rs377532877 | c.566N>T | p.Arg189Leu | p.R189L | Q8WUK0 | protein_coding | tolerated(0.2) | benign(0.009) | TCGA-AP-A051-01 | Endometrium | uterine corpus endometrioid carcinoma | Female | >=65 | I/II | Unknown | Unknown | SD |
| PTPMT1 | SNV | Missense_Mutation | novel | c.482N>T | p.Ala161Val | p.A161V | Q8WUK0 | protein_coding | tolerated(0.5) | benign(0.014) | TCGA-AX-A1CE-01 | Endometrium | uterine corpus endometrioid carcinoma | Female | <65 | I/II | Unspecific | Paclitaxel | SD |
| PTPMT1 | SNV | Missense_Mutation | c.337N>C | p.Lys113Gln | p.K113Q | Q8WUK0 | protein_coding | tolerated(0.13) | benign(0.012) | TCGA-B5-A11E-01 | Endometrium | uterine corpus endometrioid carcinoma | Female | <65 | I/II | Unknown | Unknown | SD |
| Page: 1 2 |
Top |
Related drugs of malignant transformation related genes |
| Identification of chemicals and drugs interact with genes involved in malignant transfromation |
| (DGIdb 4.0) |
| Entrez ID | Symbol | Category | Interaction Types | Drug Claim Name | Drug Name | PMIDs |
| Page: 1 |

Copyright 2023-Present -The University of Texas Health Science Center at Houston |