
|
|||||
|
 | |
| |
| |
| |
| |
| |
|
Gene: PTP4A3 |
Gene summary for PTP4A3 |
| Gene information | Species | Human | Gene symbol | PTP4A3 | Gene ID | 11156 |
| Gene name | protein tyrosine phosphatase 4A3 | |
| Gene Alias | PRL-3 | |
| Cytomap | 8q24.3 | |
| Gene Type | protein-coding | GO ID | GO:0001667 | UniProtAcc | O75365 |
Top |
Malignant transformation analysis |
| Identification of the aberrant gene expression in precancerous and cancerous lesions by comparing the gene expression of stem-like cells in diseased tissues with normal stem cells |
| Entrez ID | Symbol | Replicates | Species | Organ | Tissue | Adj P-value | Log2FC | Malignancy |
| 11156 | PTP4A3 | LZE4T | Human | Esophagus | ESCC | 8.14e-06 | 1.68e-01 | 0.0811 |
| 11156 | PTP4A3 | LZE7T | Human | Esophagus | ESCC | 7.46e-05 | 4.16e-01 | 0.0667 |
| 11156 | PTP4A3 | LZE8T | Human | Esophagus | ESCC | 2.06e-04 | 3.72e-01 | 0.067 |
| 11156 | PTP4A3 | LZE24T | Human | Esophagus | ESCC | 5.20e-13 | 4.47e-01 | 0.0596 |
| 11156 | PTP4A3 | P1T-E | Human | Esophagus | ESCC | 2.83e-04 | 3.67e-01 | 0.0875 |
| 11156 | PTP4A3 | P2T-E | Human | Esophagus | ESCC | 3.78e-36 | 8.73e-01 | 0.1177 |
| 11156 | PTP4A3 | P4T-E | Human | Esophagus | ESCC | 3.03e-10 | 2.08e-01 | 0.1323 |
| 11156 | PTP4A3 | P5T-E | Human | Esophagus | ESCC | 5.17e-10 | 2.32e-01 | 0.1327 |
| 11156 | PTP4A3 | P8T-E | Human | Esophagus | ESCC | 6.02e-07 | 2.03e-01 | 0.0889 |
| 11156 | PTP4A3 | P10T-E | Human | Esophagus | ESCC | 7.45e-12 | 2.28e-01 | 0.116 |
| 11156 | PTP4A3 | P11T-E | Human | Esophagus | ESCC | 3.78e-04 | 2.08e-01 | 0.1426 |
| 11156 | PTP4A3 | P12T-E | Human | Esophagus | ESCC | 1.32e-11 | 2.00e-01 | 0.1122 |
| 11156 | PTP4A3 | P15T-E | Human | Esophagus | ESCC | 4.79e-15 | 3.42e-01 | 0.1149 |
| 11156 | PTP4A3 | P16T-E | Human | Esophagus | ESCC | 6.35e-41 | 7.18e-01 | 0.1153 |
| 11156 | PTP4A3 | P17T-E | Human | Esophagus | ESCC | 4.14e-04 | 1.92e-01 | 0.1278 |
| 11156 | PTP4A3 | P20T-E | Human | Esophagus | ESCC | 1.57e-05 | 1.32e-01 | 0.1124 |
| 11156 | PTP4A3 | P21T-E | Human | Esophagus | ESCC | 3.92e-21 | 3.67e-01 | 0.1617 |
| 11156 | PTP4A3 | P22T-E | Human | Esophagus | ESCC | 4.11e-13 | 1.91e-01 | 0.1236 |
| 11156 | PTP4A3 | P23T-E | Human | Esophagus | ESCC | 5.32e-17 | 5.62e-01 | 0.108 |
| 11156 | PTP4A3 | P24T-E | Human | Esophagus | ESCC | 2.32e-08 | 2.58e-01 | 0.1287 |
| Page: 1 2 3 |
| Tissue | Expression Dynamics | Abbreviation |
| Esophagus | 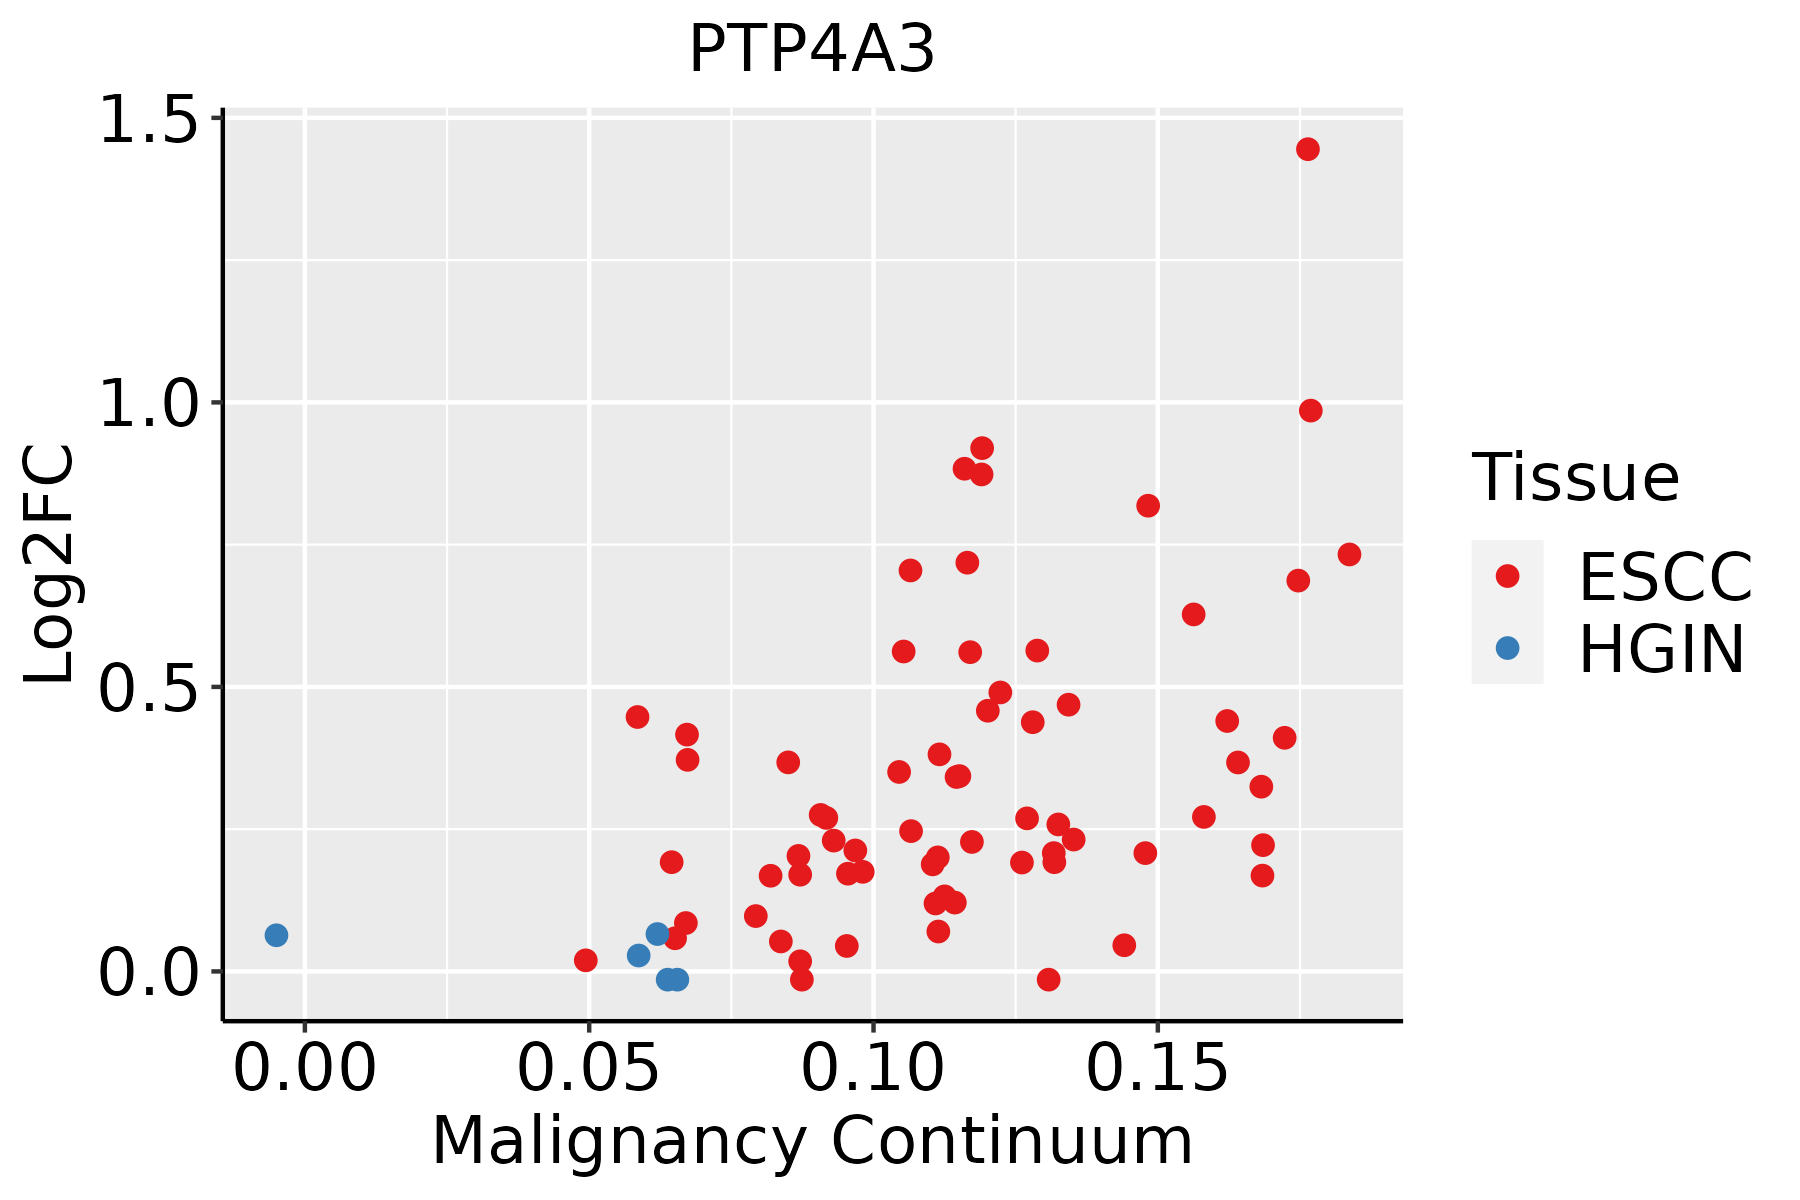 | ESCC: Esophageal squamous cell carcinoma |
| HGIN: High-grade intraepithelial neoplasias | ||
| LGIN: Low-grade intraepithelial neoplasias | ||
| Liver | 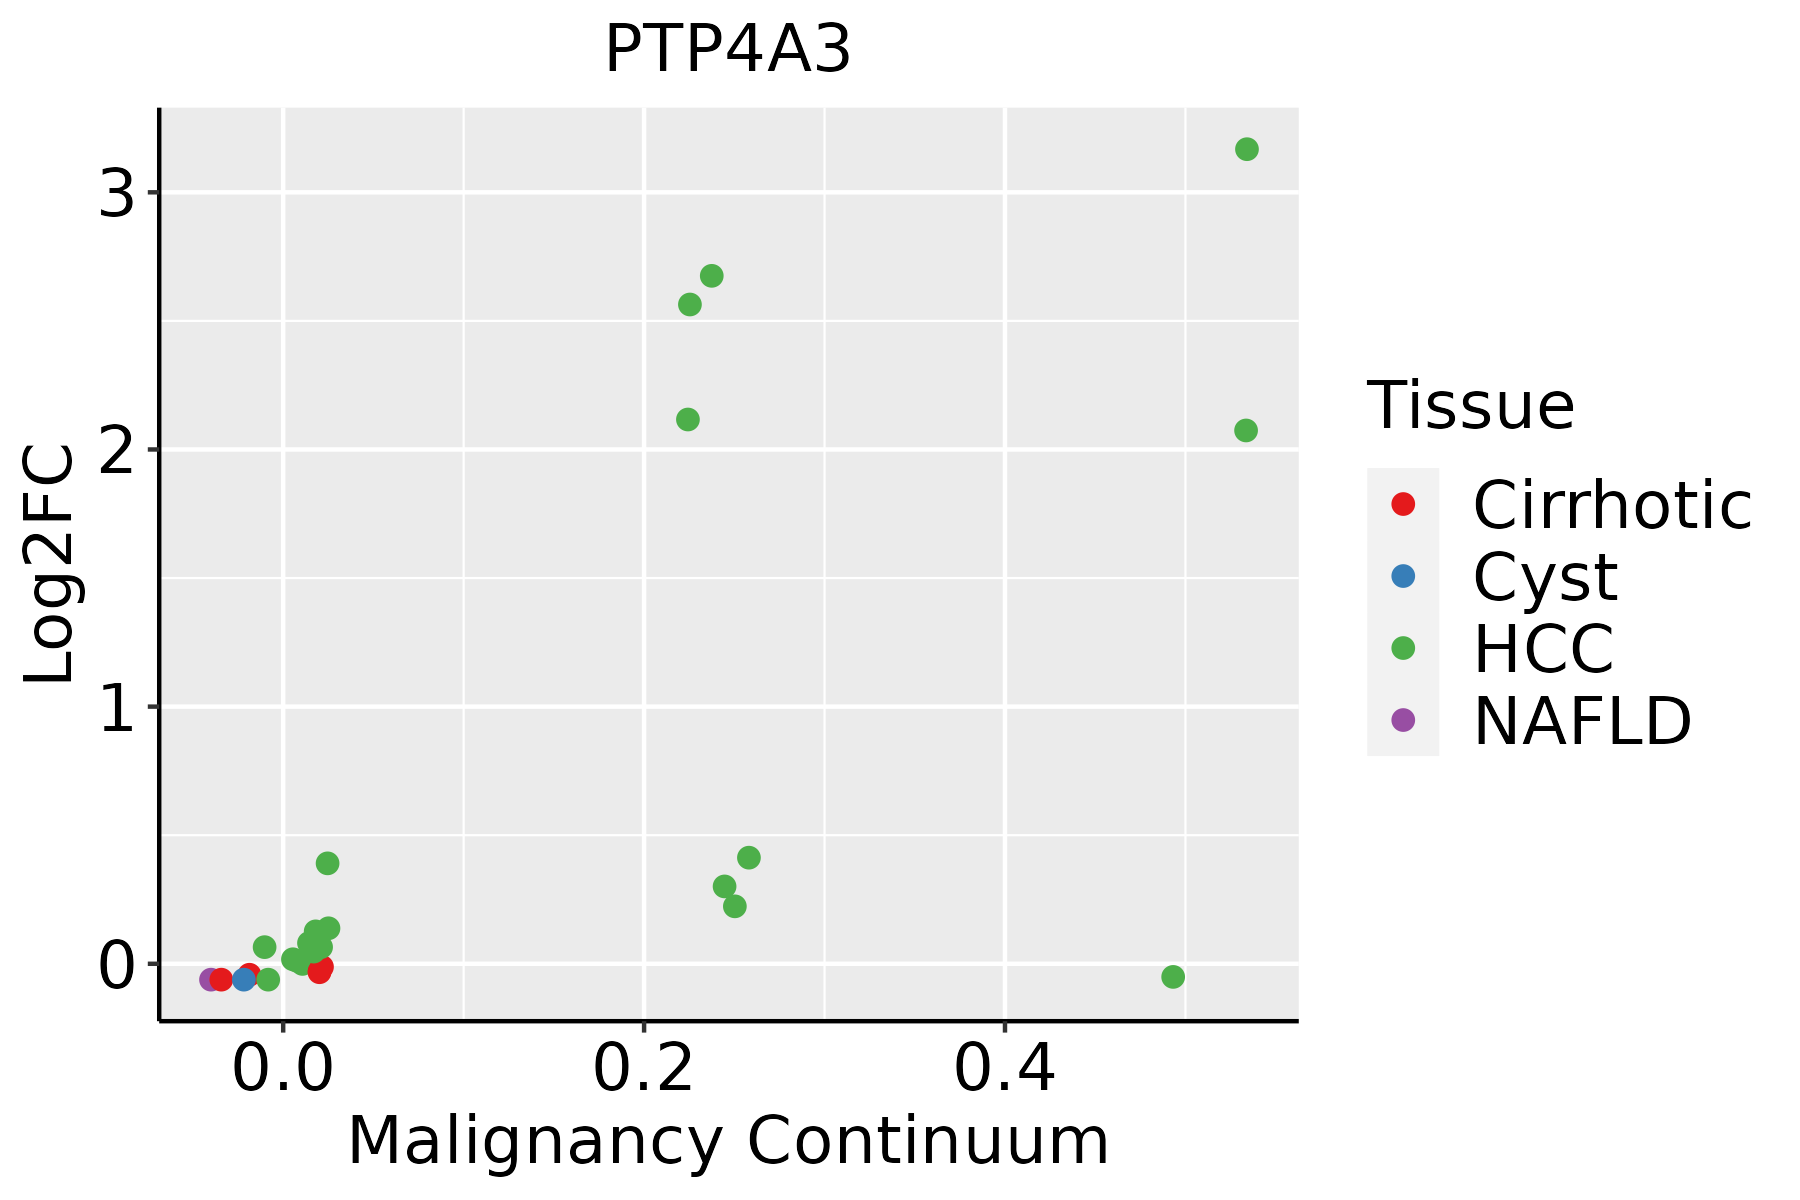 | HCC: Hepatocellular carcinoma |
| NAFLD: Non-alcoholic fatty liver disease | ||
| Prostate | 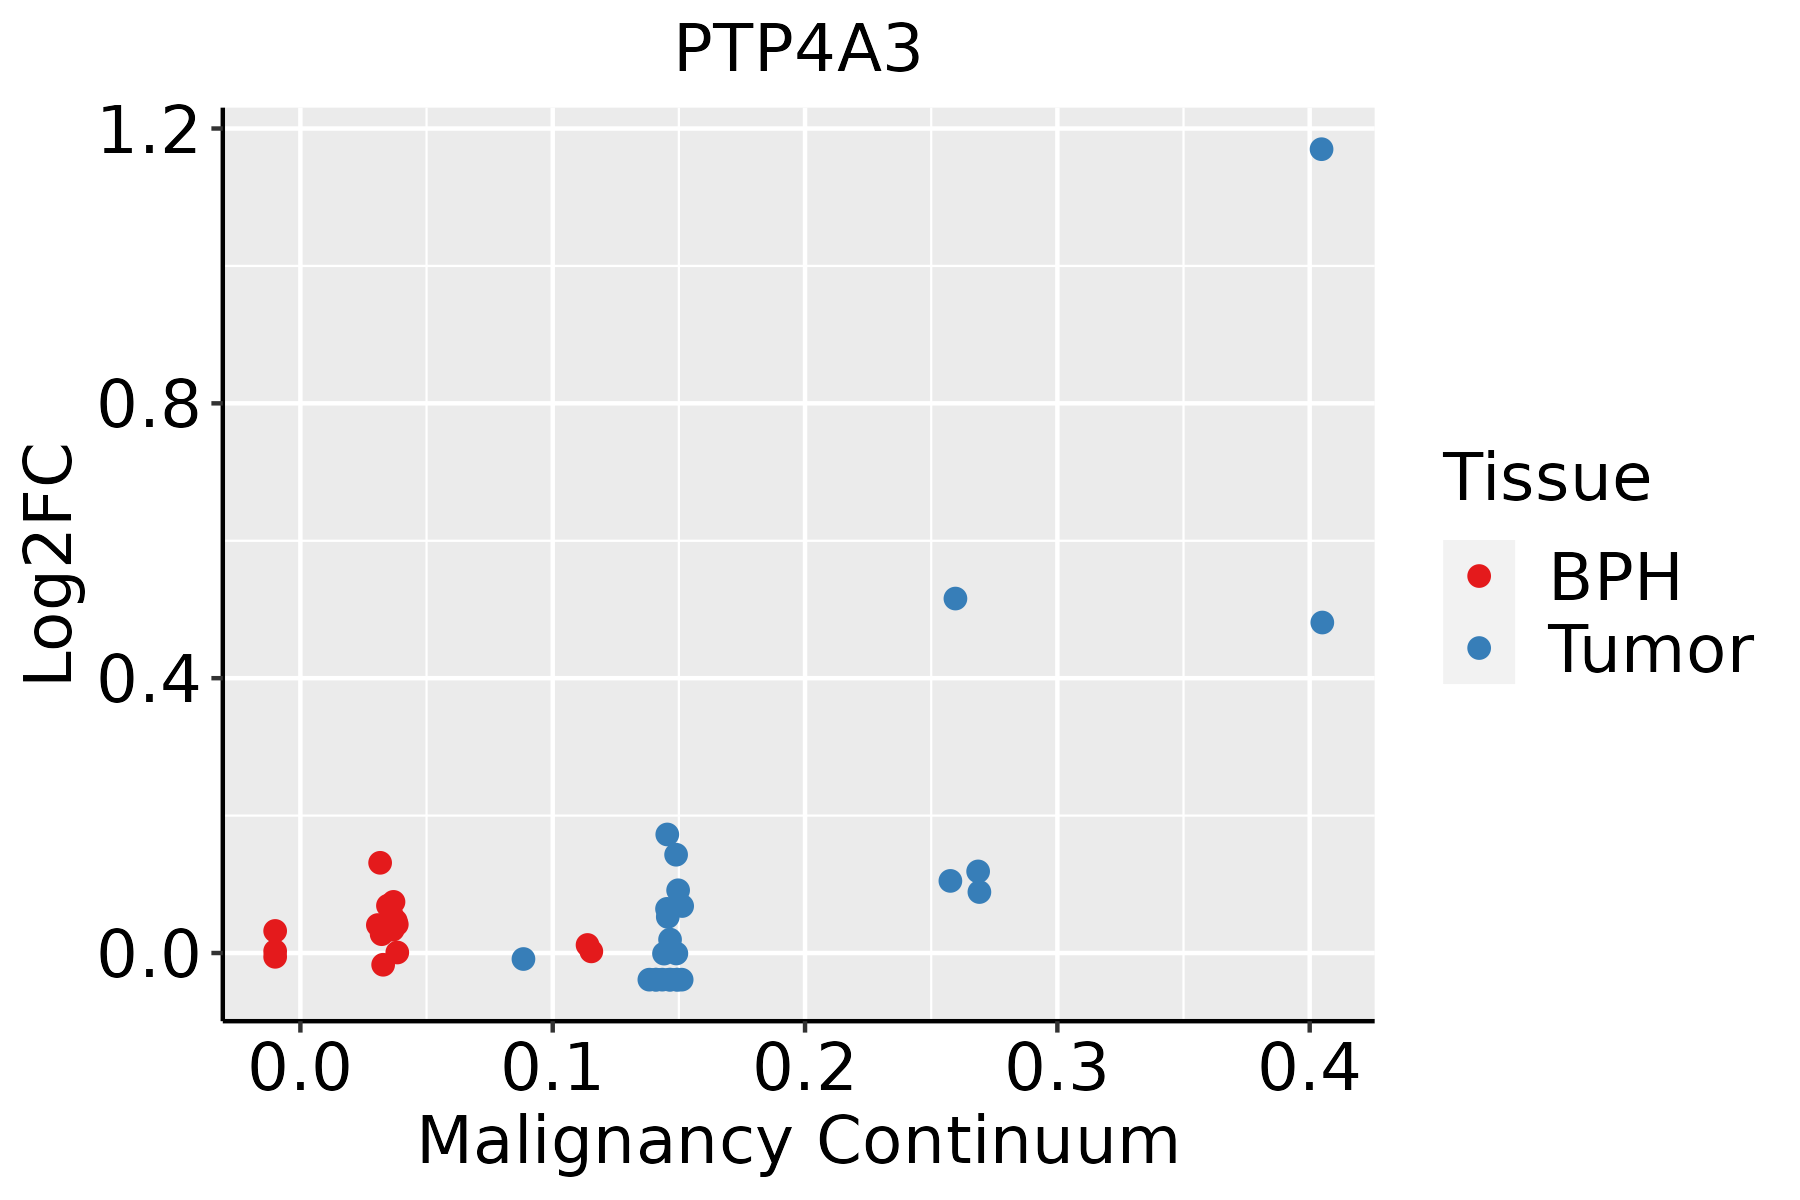 | BPH: Benign Prostatic Hyperplasia |
| ∗log2FC in expression of this searched gene in stem-like cells from each diseased tissue sample relative to stem-like cells in normal samples in each tissue plotted against the malignancy continuum. Samples are colored based on if they are from different disease stage. |
Top |
Malignant transformation related pathway analysis |
| Find out the enriched GO biological processes and KEGG pathways involved in transition from healthy to precancer to cancer |
| Tissue | Disease Stage | Enriched GO biological Processes |
| Colorectum | AD |  |
| Colorectum | SER |  |
| Colorectum | MSS |  |
| Colorectum | MSI-H |  |
| Colorectum | FAP |  |
| ∗Top 15 enriched GO BP terms are showed in the bar plot of each disease state in each tissue. Each row represents a significant GO biological process which is colored according to the -log10(p.adjust). |
| Page: 1 2 3 4 5 6 7 8 9 |
| GO ID | Tissue | Disease Stage | Description | Gene Ratio | Bg Ratio | pvalue | p.adjust | Count |
| GO:1904951111 | Esophagus | ESCC | positive regulation of establishment of protein localization | 216/8552 | 319/18723 | 1.01e-15 | 6.86e-14 | 216 |
| GO:001631110 | Esophagus | ESCC | dephosphorylation | 251/8552 | 417/18723 | 1.26e-09 | 2.99e-08 | 251 |
| GO:000647018 | Esophagus | ESCC | protein dephosphorylation | 177/8552 | 281/18723 | 3.13e-09 | 6.72e-08 | 177 |
| GO:00072197 | Esophagus | ESCC | Notch signaling pathway | 106/8552 | 172/18723 | 1.74e-05 | 1.55e-04 | 106 |
| GO:199082316 | Esophagus | ESCC | response to leukemia inhibitory factor | 60/8552 | 95/18723 | 4.41e-04 | 2.48e-03 | 60 |
| GO:199083015 | Esophagus | ESCC | cellular response to leukemia inhibitory factor | 59/8552 | 94/18723 | 6.19e-04 | 3.32e-03 | 59 |
| GO:000166720 | Esophagus | ESCC | ameboidal-type cell migration | 250/8552 | 475/18723 | 1.22e-03 | 5.97e-03 | 250 |
| GO:190122414 | Esophagus | ESCC | positive regulation of NIK/NF-kappaB signaling | 44/8552 | 69/18723 | 1.86e-03 | 8.42e-03 | 44 |
| GO:00380615 | Esophagus | ESCC | NIK/NF-kappaB signaling | 81/8552 | 143/18723 | 5.33e-03 | 2.00e-02 | 81 |
| GO:001063120 | Esophagus | ESCC | epithelial cell migration | 187/8552 | 357/18723 | 6.05e-03 | 2.23e-02 | 187 |
| GO:009013220 | Esophagus | ESCC | epithelium migration | 188/8552 | 360/18723 | 6.96e-03 | 2.54e-02 | 188 |
| GO:009013020 | Esophagus | ESCC | tissue migration | 190/8552 | 365/18723 | 7.91e-03 | 2.82e-02 | 190 |
| GO:190495122 | Liver | HCC | positive regulation of establishment of protein localization | 207/7958 | 319/18723 | 3.95e-16 | 3.29e-14 | 207 |
| GO:001631121 | Liver | HCC | dephosphorylation | 230/7958 | 417/18723 | 1.00e-07 | 1.96e-06 | 230 |
| GO:000647021 | Liver | HCC | protein dephosphorylation | 162/7958 | 281/18723 | 1.91e-07 | 3.46e-06 | 162 |
| GO:19012242 | Liver | HCC | positive regulation of NIK/NF-kappaB signaling | 41/7958 | 69/18723 | 3.38e-03 | 1.54e-02 | 41 |
| GO:00380611 | Liver | HCC | NIK/NF-kappaB signaling | 77/7958 | 143/18723 | 3.98e-03 | 1.76e-02 | 77 |
| GO:19012221 | Liver | HCC | regulation of NIK/NF-kappaB signaling | 60/7958 | 112/18723 | 1.17e-02 | 4.28e-02 | 60 |
| GO:000166721 | Liver | HCC | ameboidal-type cell migration | 226/7958 | 475/18723 | 1.35e-02 | 4.81e-02 | 226 |
| GO:190495118 | Prostate | Tumor | positive regulation of establishment of protein localization | 106/3246 | 319/18723 | 3.13e-12 | 2.70e-10 | 106 |
| Page: 1 2 |
| Pathway ID | Tissue | Disease Stage | Description | Gene Ratio | Bg Ratio | pvalue | p.adjust | qvalue | Count |
| Page: 1 |
Top |
Cell-cell communication analysis |
| Identification of potential cell-cell interactions between two cell types and their ligand-receptor pairs for different disease states |
| Ligand | Receptor | LRpair | Pathway | Tissue | Disease Stage |
| Page: 1 |
Top |
Single-cell gene regulatory network inference analysis |
| Find out the significant the regulons (TFs) and the target genes of each regulon across cell types for different disease states |
| TF | Cell Type | Tissue | Disease Stage | Target Gene | RSS | Regulon Activity |
| ∗The dot plots of a searched regulon are shown for all cell subpopulations in each disease state of each tissue based on the regulon specific score inferred using pySCENIC and by calculating the average expression. |
| Page: 1 |
Top |
Somatic mutation of malignant transformation related genes |
| Annotation of somatic variants for genes involved in malignant transformation |
| Hugo Symbol | Variant Class | Variant Classification | dbSNP RS | HGVSc | HGVSp | HGVSp Short | SWISSPROT | BIOTYPE | SIFT | PolyPhen | Tumor Sample Barcode | Tissue | Histology | Sex | Age | Stage | Therapy Types | Drugs | Outcome |
| PTP4A3 | SNV | Missense_Mutation | novel | c.196G>T | p.Val66Leu | p.V66L | O75365 | protein_coding | tolerated(1) | benign(0) | TCGA-AR-A254-01 | Breast | breast invasive carcinoma | Female | <65 | III/IV | Chemotherapy | paclitaxel | SD |
| PTP4A3 | SNV | Missense_Mutation | novel | c.332N>A | p.Ala111Asp | p.A111D | O75365 | protein_coding | deleterious(0) | probably_damaging(0.975) | TCGA-E2-A1IN-01 | Breast | breast invasive carcinoma | Female | <65 | I/II | Hormone Therapy | arimidex | SD |
| PTP4A3 | SNV | Missense_Mutation | c.403N>A | p.Gln135Lys | p.Q135K | O75365 | protein_coding | tolerated(0.13) | benign(0.017) | TCGA-LP-A7HU-01 | Cervix | cervical & endocervical cancer | Female | <65 | I/II | Unknown | Unknown | SD | |
| PTP4A3 | SNV | Missense_Mutation | novel | c.62T>C | p.Ile21Thr | p.I21T | O75365 | protein_coding | deleterious(0.02) | probably_damaging(0.94) | TCGA-AZ-6600-01 | Colorectum | colon adenocarcinoma | Male | <65 | III/IV | Chemotherapy | cpt-11 | PD |
| PTP4A3 | SNV | Missense_Mutation | rs776517948 | c.139C>T | p.Arg47Cys | p.R47C | O75365 | protein_coding | deleterious(0.01) | probably_damaging(0.977) | TCGA-D5-6540-01 | Colorectum | colon adenocarcinoma | Male | >=65 | I/II | Unknown | Unknown | SD |
| PTP4A3 | SNV | Missense_Mutation | c.458N>A | p.Arg153Gln | p.R153Q | O75365 | protein_coding | tolerated(0.1) | benign(0.36) | TCGA-F4-6570-01 | Colorectum | colon adenocarcinoma | Female | >=65 | I/II | Unknown | Unknown | SD | |
| PTP4A3 | SNV | Missense_Mutation | c.385N>A | p.Ala129Thr | p.A129T | O75365 | protein_coding | deleterious(0.02) | probably_damaging(0.965) | TCGA-EI-6507-01 | Colorectum | rectum adenocarcinoma | Male | <65 | I/II | Unknown | Unknown | SD | |
| PTP4A3 | deletion | In_Frame_Del | c.503_508delNNNNNN | p.Thr168_Cys170delinsSer | p.T168_C170delinsS | O75365 | protein_coding | TCGA-EI-6883-01 | Colorectum | rectum adenocarcinoma | Male | <65 | I/II | Chemotherapy | 5fluorouracil+leucovorin | SD | |||
| PTP4A3 | SNV | Missense_Mutation | c.501N>T | p.Lys167Asn | p.K167N | O75365 | protein_coding | tolerated(0.09) | benign(0.006) | TCGA-AP-A0LM-01 | Endometrium | uterine corpus endometrioid carcinoma | Female | <65 | III/IV | Chemotherapy | cisplatin | SD | |
| PTP4A3 | SNV | Missense_Mutation | rs867220700 | c.86N>T | p.Thr29Met | p.T29M | O75365 | protein_coding | deleterious(0.01) | possibly_damaging(0.851) | TCGA-AP-A1DO-01 | Endometrium | uterine corpus endometrioid carcinoma | Female | <65 | I/II | Unknown | Unknown | SD |
| Page: 1 2 3 4 |
Top |
Related drugs of malignant transformation related genes |
| Identification of chemicals and drugs interact with genes involved in malignant transfromation |
| (DGIdb 4.0) |
| Entrez ID | Symbol | Category | Interaction Types | Drug Claim Name | Drug Name | PMIDs |
| 11156 | PTP4A3 | DRUGGABLE GENOME, PROTEIN PHOSPHATASE | CETUXIMAB | CETUXIMAB | 23867504 | |
| 11156 | PTP4A3 | DRUGGABLE GENOME, PROTEIN PHOSPHATASE | EMODIN | EMODIN | 22137788 |
| Page: 1 |

Copyright 2023-Present -The University of Texas Health Science Center at Houston |