
|
|||||
|
 | |
| |
| |
| |
| |
| |
|
Gene: PTP4A2 |
Gene summary for PTP4A2 |
| Gene information | Species | Human | Gene symbol | PTP4A2 | Gene ID | 8073 |
| Gene name | protein tyrosine phosphatase 4A2 | |
| Gene Alias | HH13 | |
| Cytomap | 1p35.2 | |
| Gene Type | protein-coding | GO ID | GO:0006464 | UniProtAcc | Q12974 |
Top |
Malignant transformation analysis |
| Identification of the aberrant gene expression in precancerous and cancerous lesions by comparing the gene expression of stem-like cells in diseased tissues with normal stem cells |
| Entrez ID | Symbol | Replicates | Species | Organ | Tissue | Adj P-value | Log2FC | Malignancy |
| 8073 | PTP4A2 | GSM4909281 | Human | Breast | IDC | 7.39e-07 | -3.87e-01 | 0.21 |
| 8073 | PTP4A2 | GSM4909282 | Human | Breast | IDC | 2.16e-02 | 2.59e-01 | -0.0288 |
| 8073 | PTP4A2 | GSM4909285 | Human | Breast | IDC | 4.89e-18 | -5.53e-01 | 0.21 |
| 8073 | PTP4A2 | GSM4909286 | Human | Breast | IDC | 7.57e-10 | -3.55e-01 | 0.1081 |
| 8073 | PTP4A2 | GSM4909288 | Human | Breast | IDC | 3.33e-03 | -3.86e-01 | 0.0988 |
| 8073 | PTP4A2 | GSM4909290 | Human | Breast | IDC | 6.27e-09 | -4.22e-01 | 0.2096 |
| 8073 | PTP4A2 | GSM4909291 | Human | Breast | IDC | 9.37e-04 | -3.40e-01 | 0.1753 |
| 8073 | PTP4A2 | GSM4909294 | Human | Breast | IDC | 1.97e-03 | -3.27e-01 | 0.2022 |
| 8073 | PTP4A2 | GSM4909295 | Human | Breast | IDC | 1.96e-09 | -5.32e-01 | 0.0898 |
| 8073 | PTP4A2 | GSM4909296 | Human | Breast | IDC | 3.30e-14 | -4.10e-01 | 0.1524 |
| 8073 | PTP4A2 | GSM4909297 | Human | Breast | IDC | 8.43e-24 | -4.38e-01 | 0.1517 |
| 8073 | PTP4A2 | GSM4909301 | Human | Breast | IDC | 3.90e-02 | 8.57e-02 | 0.1577 |
| 8073 | PTP4A2 | GSM4909302 | Human | Breast | IDC | 2.03e-04 | -2.83e-01 | 0.1545 |
| 8073 | PTP4A2 | GSM4909304 | Human | Breast | IDC | 8.84e-10 | 3.99e-01 | 0.1636 |
| 8073 | PTP4A2 | GSM4909309 | Human | Breast | IDC | 7.88e-10 | -3.90e-01 | 0.0483 |
| 8073 | PTP4A2 | GSM4909311 | Human | Breast | IDC | 2.70e-37 | -4.22e-01 | 0.1534 |
| 8073 | PTP4A2 | GSM4909312 | Human | Breast | IDC | 1.43e-09 | -1.13e-02 | 0.1552 |
| 8073 | PTP4A2 | GSM4909313 | Human | Breast | IDC | 1.11e-07 | -1.31e-01 | 0.0391 |
| 8073 | PTP4A2 | GSM4909317 | Human | Breast | IDC | 1.58e-03 | -2.63e-01 | 0.1355 |
| 8073 | PTP4A2 | GSM4909319 | Human | Breast | IDC | 4.76e-48 | -6.02e-01 | 0.1563 |
| Page: 1 2 3 4 5 6 7 8 9 10 11 12 |
| Tissue | Expression Dynamics | Abbreviation |
| Breast |  | IDC: Invasive ductal carcinoma |
| DCIS: Ductal carcinoma in situ | ||
| Precancer(BRCA1-mut): Precancerous lesion from BRCA1 mutation carriers | ||
| Colorectum (GSE201348) |  | FAP: Familial adenomatous polyposis |
| CRC: Colorectal cancer | ||
| Colorectum (HTA11) |  | AD: Adenomas |
| SER: Sessile serrated lesions | ||
| MSI-H: Microsatellite-high colorectal cancer | ||
| MSS: Microsatellite stable colorectal cancer | ||
| Endometrium |  | AEH: Atypical endometrial hyperplasia |
| EEC: Endometrioid Cancer | ||
| Esophagus |  | ESCC: Esophageal squamous cell carcinoma |
| HGIN: High-grade intraepithelial neoplasias | ||
| LGIN: Low-grade intraepithelial neoplasias | ||
| Liver |  | HCC: Hepatocellular carcinoma |
| NAFLD: Non-alcoholic fatty liver disease | ||
| Oral Cavity | 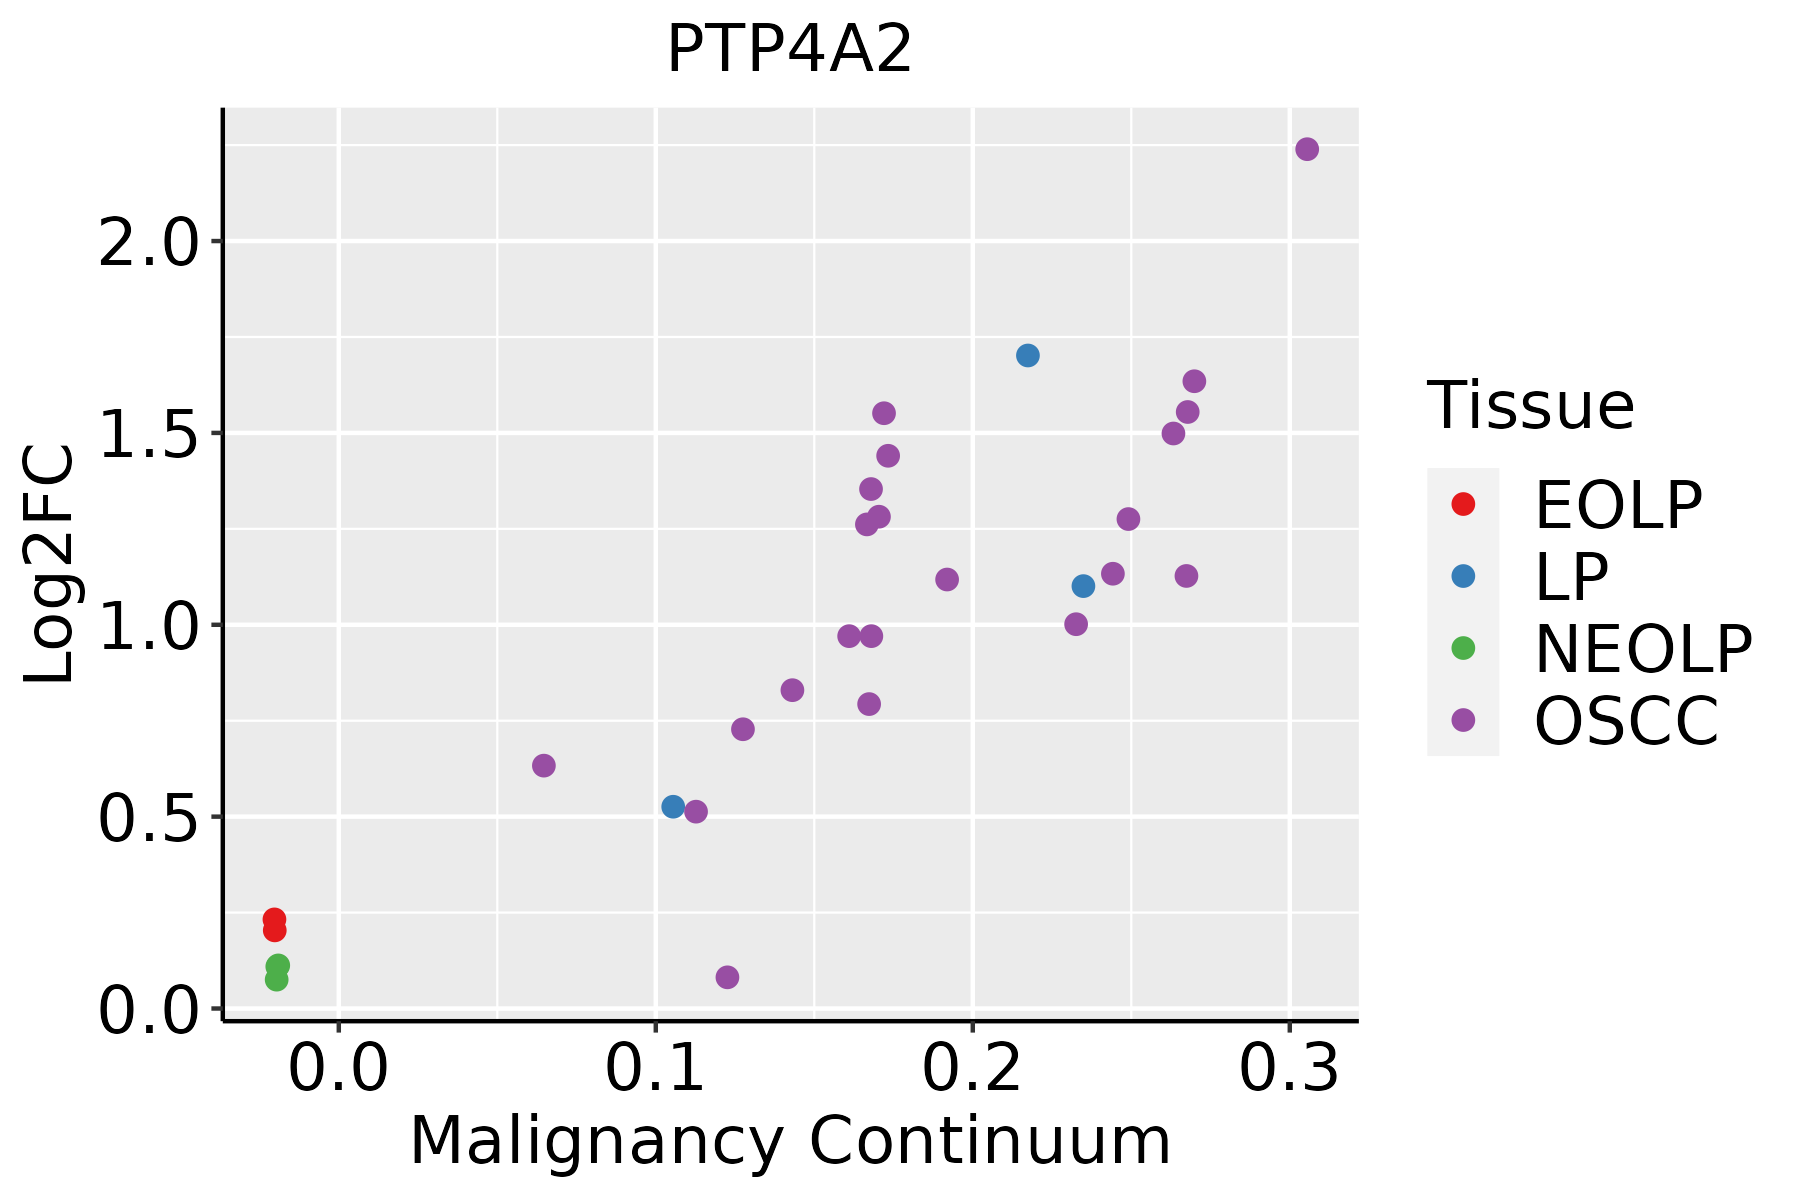 | EOLP: Erosive Oral lichen planus |
| LP: leukoplakia | ||
| NEOLP: Non-erosive oral lichen planus | ||
| OSCC: Oral squamous cell carcinoma | ||
| Prostate | 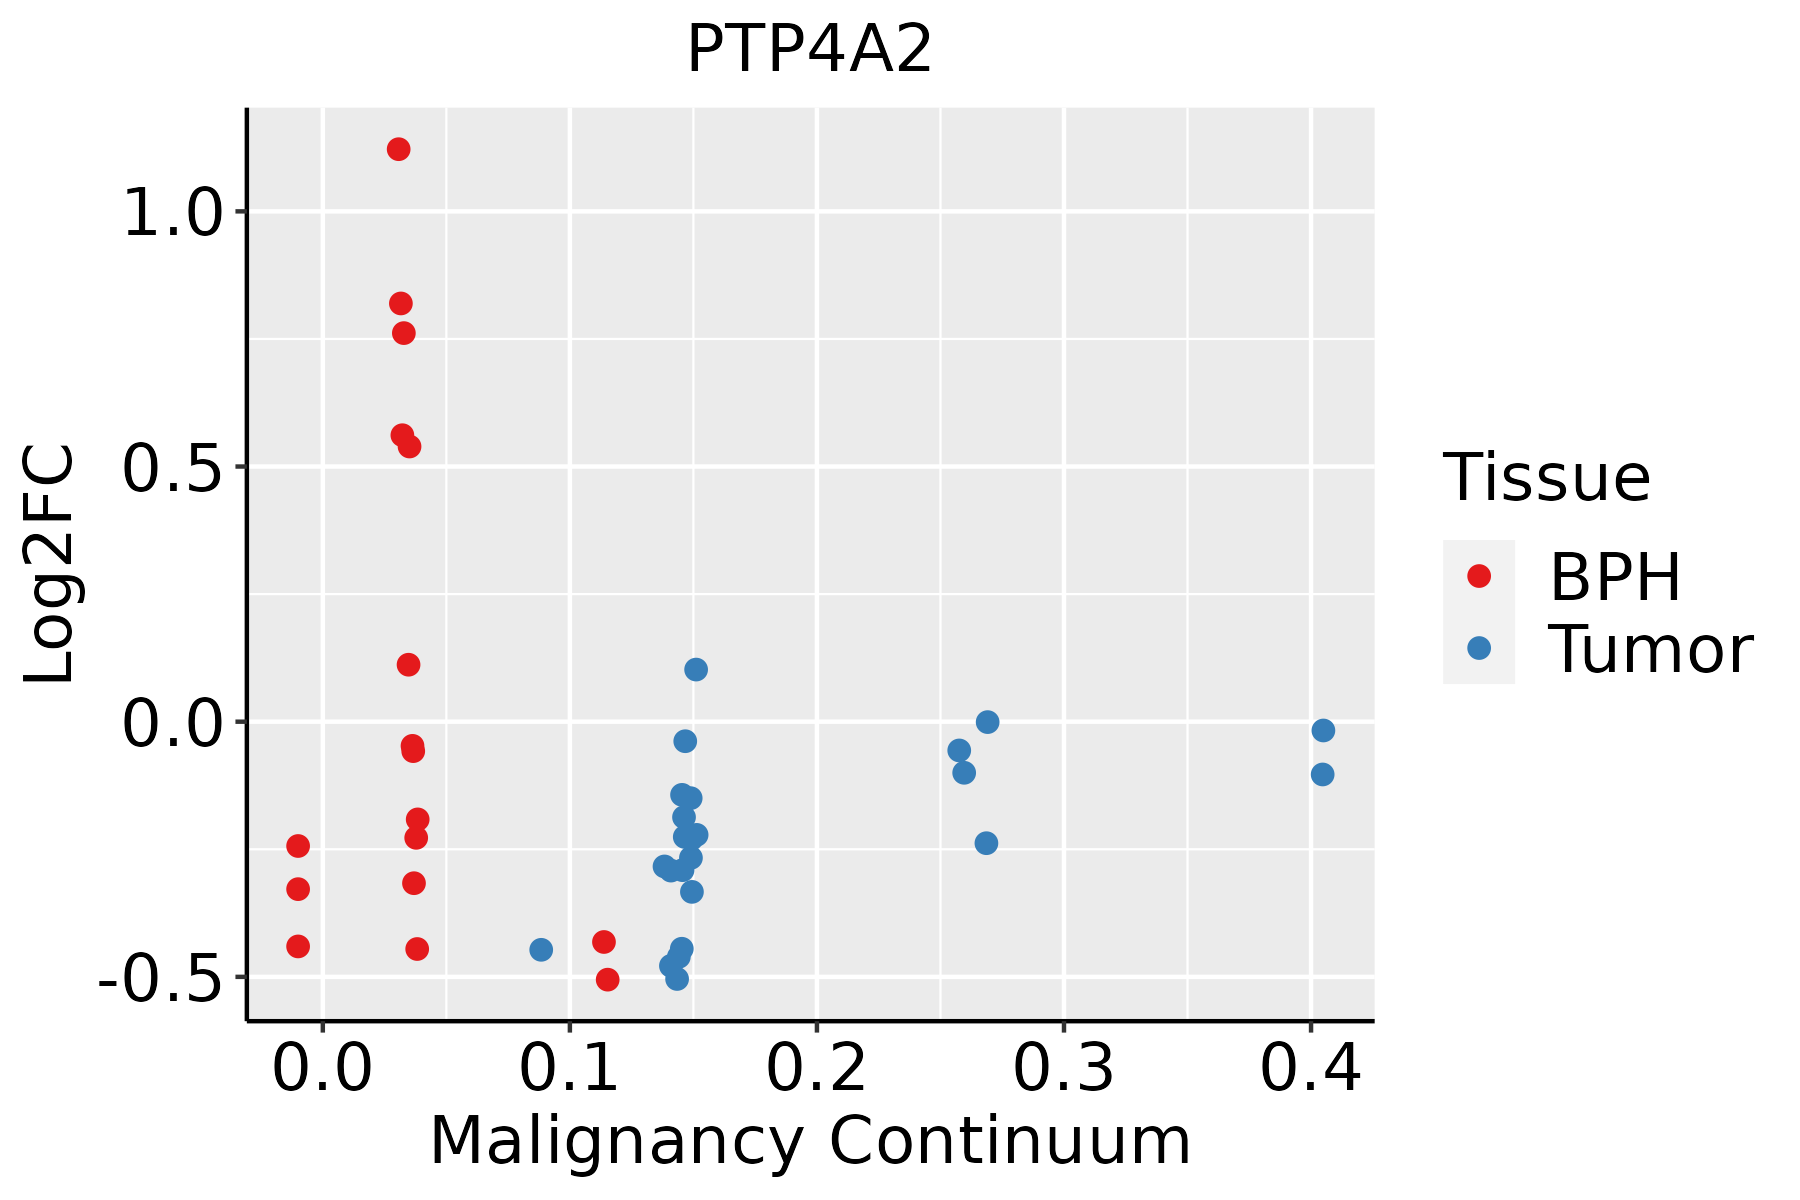 | BPH: Benign Prostatic Hyperplasia |
| Skin |  | AK: Actinic keratosis |
| cSCC: Cutaneous squamous cell carcinoma | ||
| SCCIS:squamous cell carcinoma in situ | ||
| Thyroid | 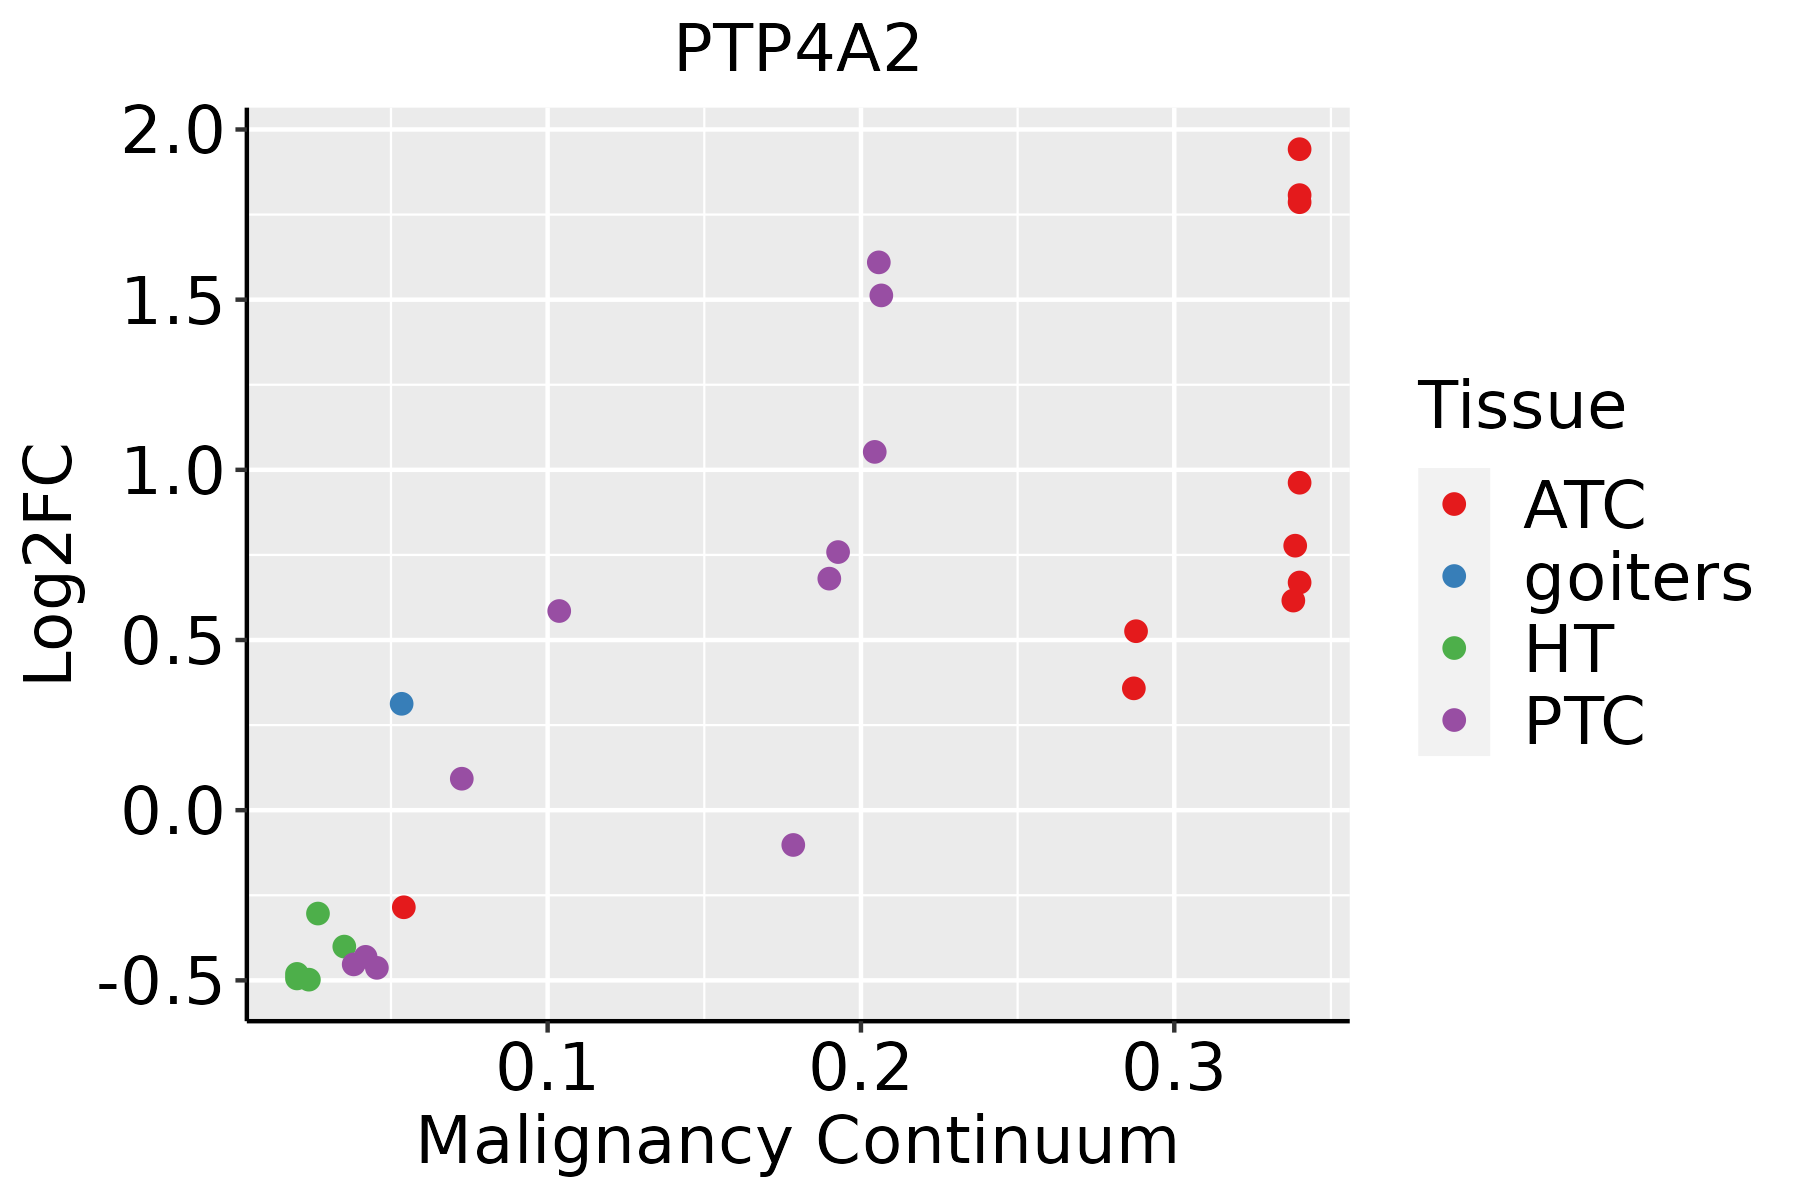 | ATC: Anaplastic thyroid cancer |
| HT: Hashimoto's thyroiditis | ||
| PTC: Papillary thyroid cancer |
| ∗log2FC in expression of this searched gene in stem-like cells from each diseased tissue sample relative to stem-like cells in normal samples in each tissue plotted against the malignancy continuum. Samples are colored based on if they are from different disease stage. |
Top |
Malignant transformation related pathway analysis |
| Find out the enriched GO biological processes and KEGG pathways involved in transition from healthy to precancer to cancer |
| Tissue | Disease Stage | Enriched GO biological Processes |
| Colorectum | AD |  |
| Colorectum | SER |  |
| Colorectum | MSS |  |
| Colorectum | MSI-H |  |
| Colorectum | FAP |  |
| ∗Top 15 enriched GO BP terms are showed in the bar plot of each disease state in each tissue. Each row represents a significant GO biological process which is colored according to the -log10(p.adjust). |
| Page: 1 2 3 4 5 6 7 8 9 |
| GO ID | Tissue | Disease Stage | Description | Gene Ratio | Bg Ratio | pvalue | p.adjust | Count |
| GO:0016311 | Colorectum | AD | dephosphorylation | 123/3918 | 417/18723 | 1.84e-05 | 3.82e-04 | 123 |
| GO:0006470 | Colorectum | AD | protein dephosphorylation | 88/3918 | 281/18723 | 2.56e-05 | 4.89e-04 | 88 |
| GO:00064701 | Colorectum | SER | protein dephosphorylation | 65/2897 | 281/18723 | 4.44e-04 | 6.51e-03 | 65 |
| GO:00163111 | Colorectum | SER | dephosphorylation | 86/2897 | 417/18723 | 2.73e-03 | 2.46e-02 | 86 |
| GO:00064702 | Colorectum | MSS | protein dephosphorylation | 73/3467 | 281/18723 | 1.15e-03 | 1.12e-02 | 73 |
| GO:00163112 | Colorectum | MSS | dephosphorylation | 101/3467 | 417/18723 | 1.98e-03 | 1.70e-02 | 101 |
| GO:00064703 | Colorectum | MSI-H | protein dephosphorylation | 34/1319 | 281/18723 | 1.43e-03 | 2.22e-02 | 34 |
| GO:00163113 | Colorectum | FAP | dephosphorylation | 95/2622 | 417/18723 | 7.07e-07 | 3.32e-05 | 95 |
| GO:00064704 | Colorectum | FAP | protein dephosphorylation | 69/2622 | 281/18723 | 1.47e-06 | 6.39e-05 | 69 |
| GO:0035335 | Colorectum | FAP | peptidyl-tyrosine dephosphorylation | 23/2622 | 97/18723 | 6.95e-03 | 4.26e-02 | 23 |
| GO:00064709 | Endometrium | AEH | protein dephosphorylation | 50/2100 | 281/18723 | 6.41e-04 | 6.23e-03 | 50 |
| GO:000647013 | Endometrium | EEC | protein dephosphorylation | 51/2168 | 281/18723 | 7.38e-04 | 7.01e-03 | 51 |
| GO:000647017 | Esophagus | HGIN | protein dephosphorylation | 61/2587 | 281/18723 | 1.86e-04 | 3.51e-03 | 61 |
| GO:001631110 | Esophagus | ESCC | dephosphorylation | 251/8552 | 417/18723 | 1.26e-09 | 2.99e-08 | 251 |
| GO:000647018 | Esophagus | ESCC | protein dephosphorylation | 177/8552 | 281/18723 | 3.13e-09 | 6.72e-08 | 177 |
| GO:000647011 | Liver | Cirrhotic | protein dephosphorylation | 96/4634 | 281/18723 | 2.32e-04 | 2.11e-03 | 96 |
| GO:001631111 | Liver | Cirrhotic | dephosphorylation | 130/4634 | 417/18723 | 1.58e-03 | 1.03e-02 | 130 |
| GO:001631121 | Liver | HCC | dephosphorylation | 230/7958 | 417/18723 | 1.00e-07 | 1.96e-06 | 230 |
| GO:000647021 | Liver | HCC | protein dephosphorylation | 162/7958 | 281/18723 | 1.91e-07 | 3.46e-06 | 162 |
| GO:000647015 | Oral cavity | OSCC | protein dephosphorylation | 162/7305 | 281/18723 | 1.56e-10 | 4.56e-09 | 162 |
| Page: 1 2 |
| Pathway ID | Tissue | Disease Stage | Description | Gene Ratio | Bg Ratio | pvalue | p.adjust | qvalue | Count |
| Page: 1 |
Top |
Cell-cell communication analysis |
| Identification of potential cell-cell interactions between two cell types and their ligand-receptor pairs for different disease states |
| Ligand | Receptor | LRpair | Pathway | Tissue | Disease Stage |
| Page: 1 |
Top |
Single-cell gene regulatory network inference analysis |
| Find out the significant the regulons (TFs) and the target genes of each regulon across cell types for different disease states |
| TF | Cell Type | Tissue | Disease Stage | Target Gene | RSS | Regulon Activity |
| ∗The dot plots of a searched regulon are shown for all cell subpopulations in each disease state of each tissue based on the regulon specific score inferred using pySCENIC and by calculating the average expression. |
| Page: 1 |
Top |
Somatic mutation of malignant transformation related genes |
| Annotation of somatic variants for genes involved in malignant transformation |
| Hugo Symbol | Variant Class | Variant Classification | dbSNP RS | HGVSc | HGVSp | HGVSp Short | SWISSPROT | BIOTYPE | SIFT | PolyPhen | Tumor Sample Barcode | Tissue | Histology | Sex | Age | Stage | Therapy Types | Drugs | Outcome |
| PTP4A2 | SNV | Missense_Mutation | c.40N>T | p.Met14Leu | p.M14L | Q12974 | protein_coding | tolerated(0.19) | benign(0.019) | TCGA-E2-A1IK-01 | Breast | breast invasive carcinoma | Female | >=65 | I/II | Hormone Therapy | arimidex | SD | |
| PTP4A2 | SNV | Missense_Mutation | novel | c.25N>C | p.Ile9Leu | p.I9L | Q12974 | protein_coding | tolerated(0.06) | benign(0.007) | TCGA-GM-A5PX-01 | Breast | breast invasive carcinoma | Female | >=65 | I/II | Hormone Therapy | arimidex | CR |
| PTP4A2 | SNV | Missense_Mutation | c.43C>T | p.Arg15Cys | p.R15C | Q12974 | protein_coding | deleterious(0.01) | probably_damaging(0.994) | TCGA-G4-6304-01 | Colorectum | colon adenocarcinoma | Female | >=65 | I/II | Chemotherapy | fluorouracil | PD | |
| PTP4A2 | SNV | Missense_Mutation | novel | c.475G>T | p.Asp159Tyr | p.D159Y | Q12974 | protein_coding | deleterious(0) | benign(0.435) | TCGA-AG-A002-01 | Colorectum | rectum adenocarcinoma | Male | <65 | I/II | Unknown | Unknown | SD |
| PTP4A2 | SNV | Missense_Mutation | c.131N>A | p.Arg44Gln | p.R44Q | Q12974 | protein_coding | deleterious(0) | probably_damaging(0.995) | TCGA-A5-A0GP-01 | Endometrium | uterine corpus endometrioid carcinoma | Female | <65 | I/II | Unknown | Unknown | SD | |
| PTP4A2 | SNV | Missense_Mutation | c.10C>T | p.Pro4Ser | p.P4S | Q12974 | protein_coding | deleterious(0.03) | benign(0.268) | TCGA-B5-A11E-01 | Endometrium | uterine corpus endometrioid carcinoma | Female | <65 | I/II | Unknown | Unknown | SD | |
| PTP4A2 | SNV | Missense_Mutation | novel | c.467N>A | p.Arg156His | p.R156H | Q12974 | protein_coding | tolerated(0.13) | benign(0.022) | TCGA-DF-A2KU-01 | Endometrium | uterine corpus endometrioid carcinoma | Female | Unknown | I/II | Unknown | Unknown | SD |
| PTP4A2 | deletion | Frame_Shift_Del | novel | c.259delN | p.Thr87ProfsTer30 | p.T87Pfs*30 | Q12974 | protein_coding | TCGA-B5-A3FA-01 | Endometrium | uterine corpus endometrioid carcinoma | Female | >=65 | I/II | Unknown | Unknown | SD | ||
| PTP4A2 | SNV | Missense_Mutation | novel | c.449N>T | p.Arg150Leu | p.R150L | Q12974 | protein_coding | deleterious(0.03) | benign(0.007) | TCGA-85-8049-01 | Lung | lung squamous cell carcinoma | Male | <65 | I/II | Unknown | Unknown | SD |
| PTP4A2 | SNV | Missense_Mutation | novel | c.255N>T | p.Leu85Phe | p.L85F | Q12974 | protein_coding | deleterious(0) | possibly_damaging(0.814) | TCGA-CN-A63V-01 | Oral cavity | head & neck squamous cell carcinoma | Male | <65 | I/II | Unknown | Unknown | SD |
| Page: 1 2 |
Top |
Related drugs of malignant transformation related genes |
| Identification of chemicals and drugs interact with genes involved in malignant transfromation |
| (DGIdb 4.0) |
| Entrez ID | Symbol | Category | Interaction Types | Drug Claim Name | Drug Name | PMIDs |
| Page: 1 |

Copyright 2023-Present -The University of Texas Health Science Center at Houston |