
|
|||||
|
 | |
| |
| |
| |
| |
| |
|
Gene: PTP4A1 |
Gene summary for PTP4A1 |
| Gene information | Species | Human | Gene symbol | PTP4A1 | Gene ID | 7803 |
| Gene name | protein tyrosine phosphatase 4A1 | |
| Gene Alias | HH72 | |
| Cytomap | 6q12 | |
| Gene Type | protein-coding | GO ID | GO:0006464 | UniProtAcc | A0A024R8J2 |
Top |
Malignant transformation analysis |
| Identification of the aberrant gene expression in precancerous and cancerous lesions by comparing the gene expression of stem-like cells in diseased tissues with normal stem cells |
| Entrez ID | Symbol | Replicates | Species | Organ | Tissue | Adj P-value | Log2FC | Malignancy |
| 7803 | PTP4A1 | HTA11_78_2000001011 | Human | Colorectum | AD | 3.69e-13 | 7.63e-01 | -0.1088 |
| 7803 | PTP4A1 | HTA11_347_2000001011 | Human | Colorectum | AD | 2.74e-10 | 5.12e-01 | -0.1954 |
| 7803 | PTP4A1 | HTA11_83_2000001011 | Human | Colorectum | SER | 2.88e-03 | 4.54e-01 | -0.1526 |
| 7803 | PTP4A1 | HTA11_5212_2000001011 | Human | Colorectum | AD | 3.24e-03 | 5.22e-01 | -0.2061 |
| 7803 | PTP4A1 | A015-C-203 | Human | Colorectum | FAP | 2.39e-05 | -1.72e-01 | -0.1294 |
| 7803 | PTP4A1 | A001-C-119 | Human | Colorectum | FAP | 2.29e-02 | -2.46e-01 | -0.1557 |
| 7803 | PTP4A1 | A001-C-108 | Human | Colorectum | FAP | 1.97e-04 | -1.59e-01 | -0.0272 |
| 7803 | PTP4A1 | A002-C-205 | Human | Colorectum | FAP | 7.44e-05 | -2.27e-01 | -0.1236 |
| 7803 | PTP4A1 | A015-C-106 | Human | Colorectum | FAP | 2.65e-04 | -1.74e-01 | -0.0511 |
| 7803 | PTP4A1 | A015-C-104 | Human | Colorectum | FAP | 5.99e-08 | -1.95e-01 | -0.1899 |
| 7803 | PTP4A1 | A001-C-203 | Human | Colorectum | FAP | 1.37e-04 | -1.69e-01 | -0.0481 |
| 7803 | PTP4A1 | A002-C-116 | Human | Colorectum | FAP | 1.86e-07 | -1.86e-01 | -0.0452 |
| 7803 | PTP4A1 | A014-C-008 | Human | Colorectum | FAP | 1.78e-02 | -2.50e-01 | -0.191 |
| 7803 | PTP4A1 | F034 | Human | Colorectum | FAP | 7.22e-04 | -1.85e-01 | -0.0665 |
| 7803 | PTP4A1 | LZE4T | Human | Esophagus | ESCC | 8.33e-19 | -9.89e-01 | 0.0811 |
| 7803 | PTP4A1 | LZE5T | Human | Esophagus | ESCC | 2.50e-05 | -9.89e-01 | 0.0514 |
| 7803 | PTP4A1 | LZE7T | Human | Esophagus | ESCC | 5.98e-09 | -9.48e-01 | 0.0667 |
| 7803 | PTP4A1 | LZE8T | Human | Esophagus | ESCC | 4.31e-17 | -9.89e-01 | 0.067 |
| 7803 | PTP4A1 | LZE20T | Human | Esophagus | ESCC | 2.21e-17 | -9.89e-01 | 0.0662 |
| 7803 | PTP4A1 | LZE21D1 | Human | Esophagus | HGIN | 5.17e-04 | -9.89e-01 | 0.0632 |
| Page: 1 2 3 4 5 6 7 8 9 10 11 |
| Tissue | Expression Dynamics | Abbreviation |
| Colorectum (GSE201348) | 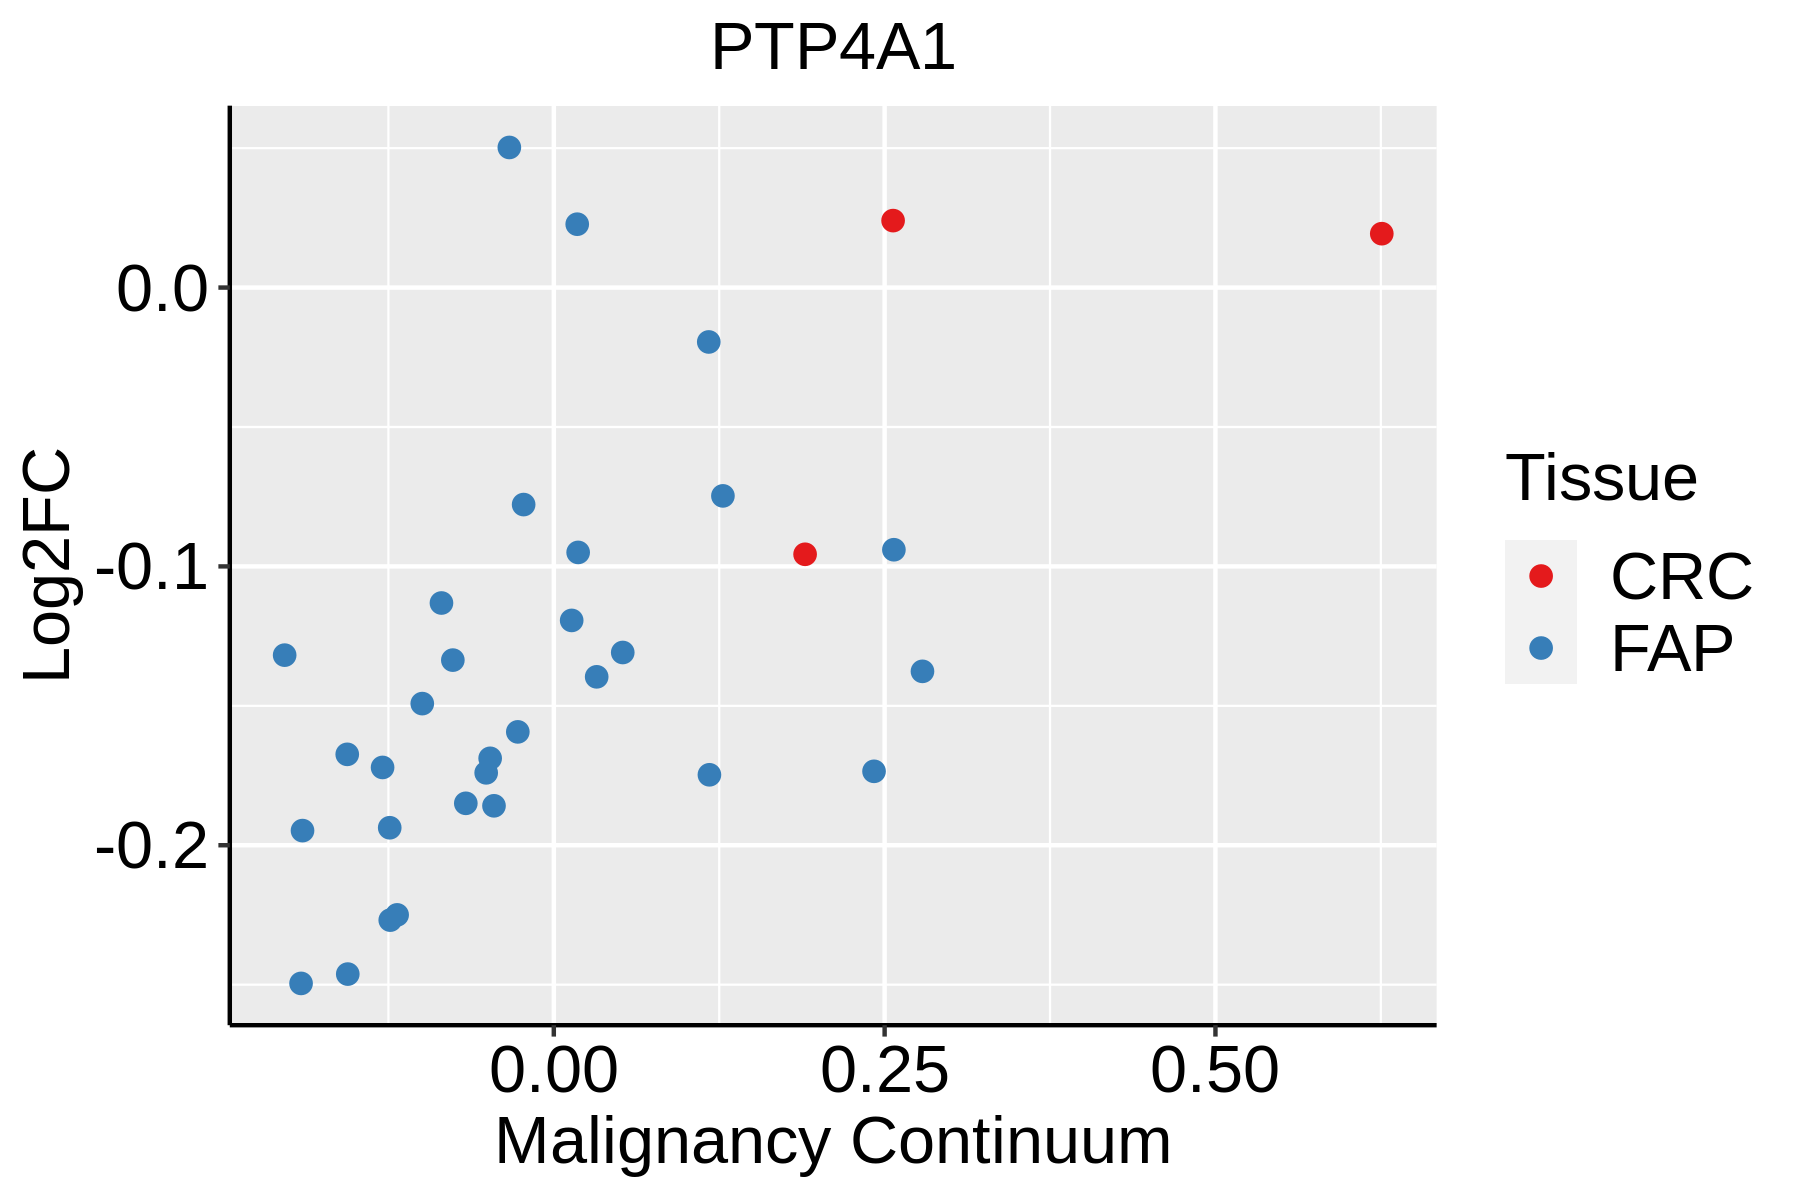 | FAP: Familial adenomatous polyposis |
| CRC: Colorectal cancer | ||
| Colorectum (HTA11) |  | AD: Adenomas |
| SER: Sessile serrated lesions | ||
| MSI-H: Microsatellite-high colorectal cancer | ||
| MSS: Microsatellite stable colorectal cancer | ||
| Esophagus |  | ESCC: Esophageal squamous cell carcinoma |
| HGIN: High-grade intraepithelial neoplasias | ||
| LGIN: Low-grade intraepithelial neoplasias | ||
| GC | 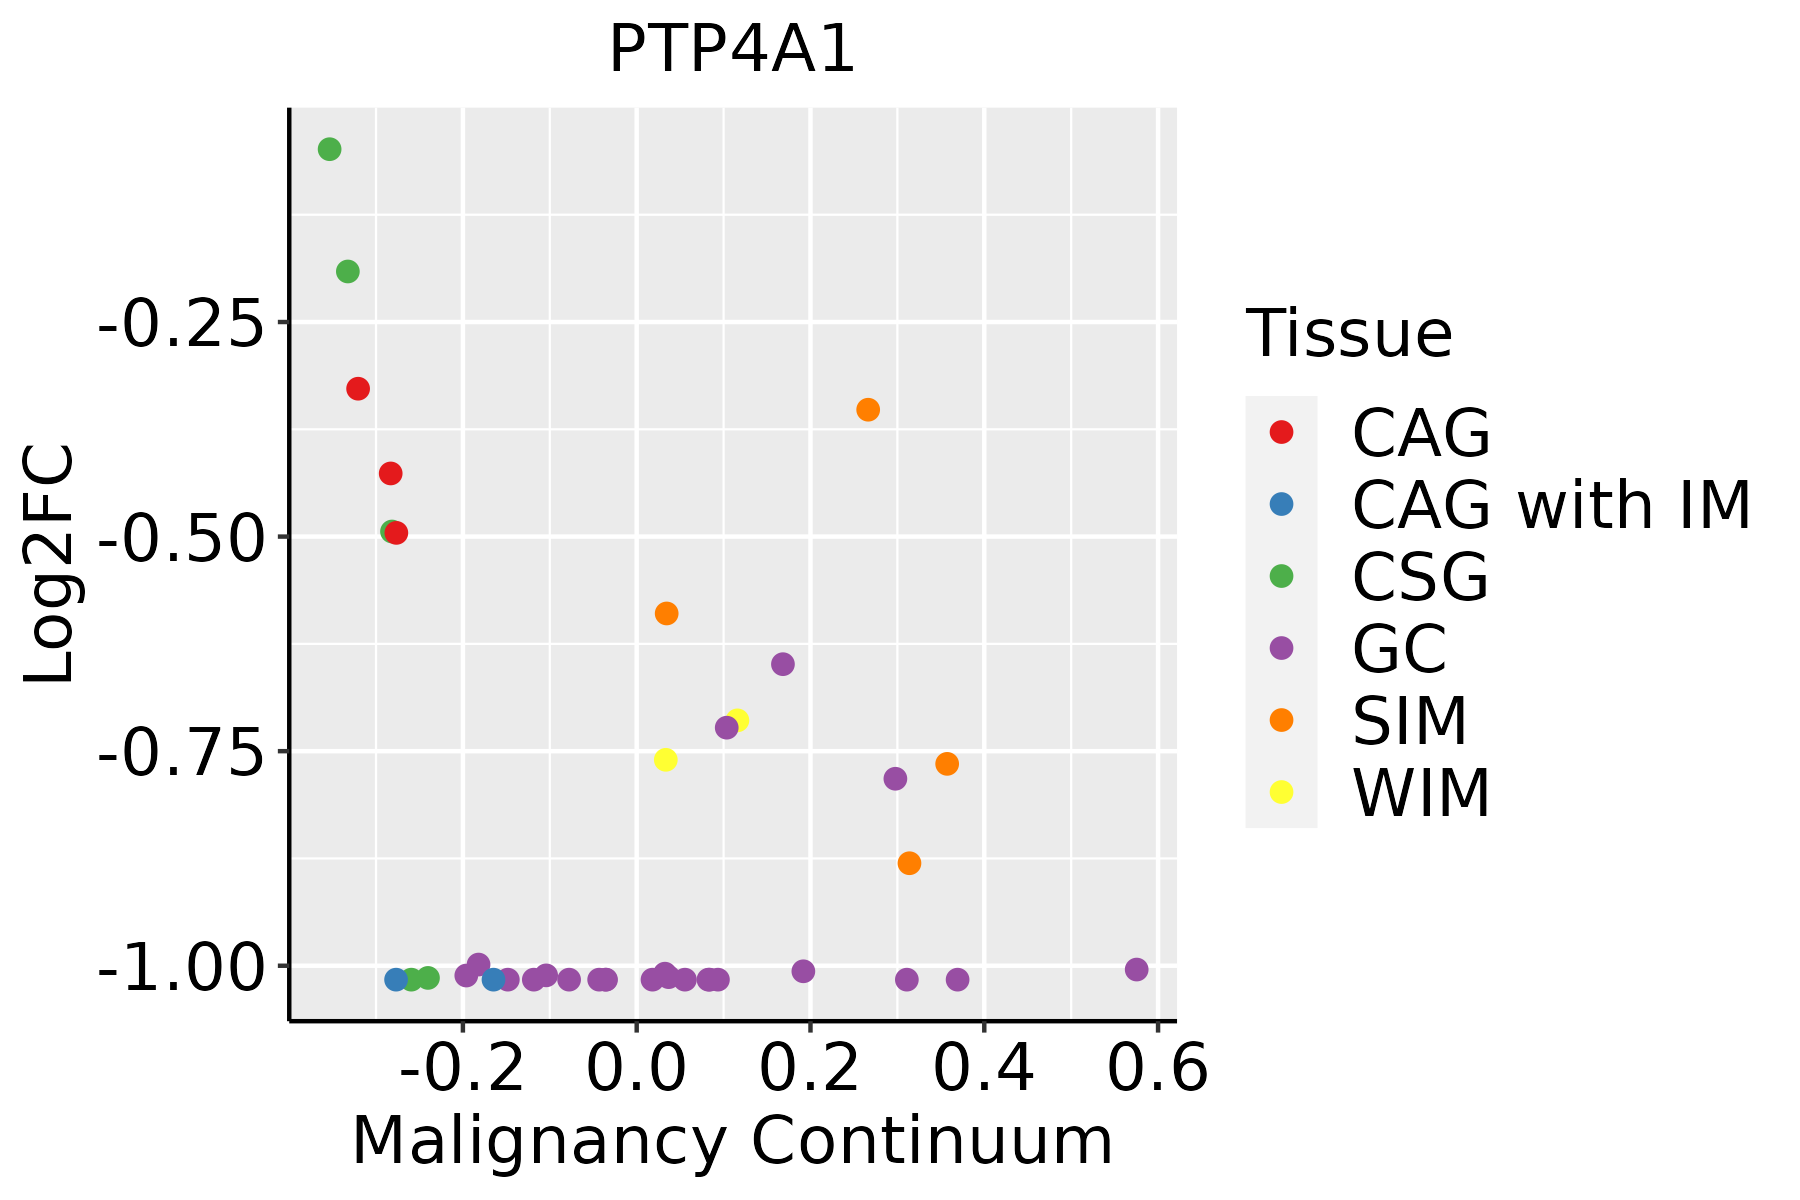 | CAG: Chronic atrophic gastritis |
| CAG with IM: Chronic atrophic gastritis with intestinal metaplasia | ||
| CSG: Chronic superficial gastritis | ||
| GC: Gastric cancer | ||
| SIM: Severe intestinal metaplasia | ||
| WIM: Wild intestinal metaplasia | ||
| Liver | 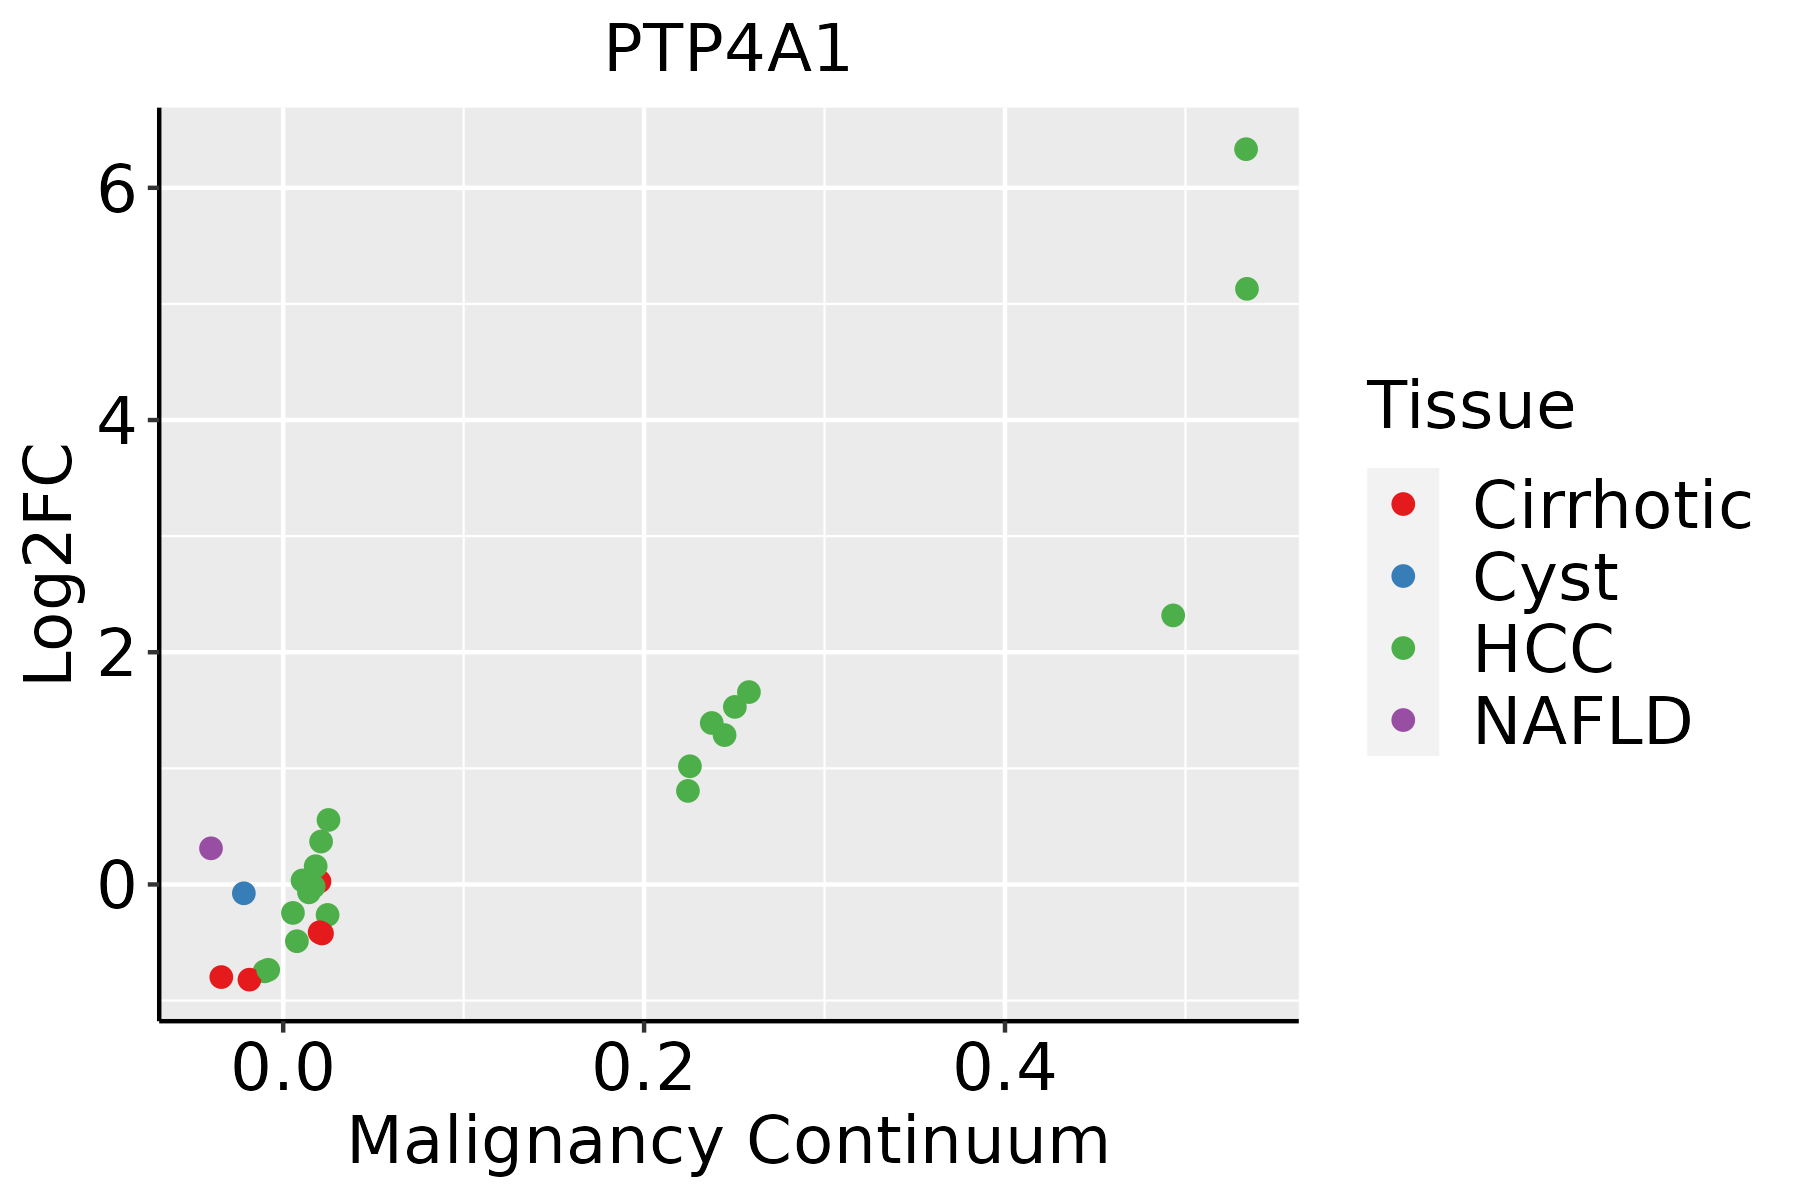 | HCC: Hepatocellular carcinoma |
| NAFLD: Non-alcoholic fatty liver disease | ||
| Lung | 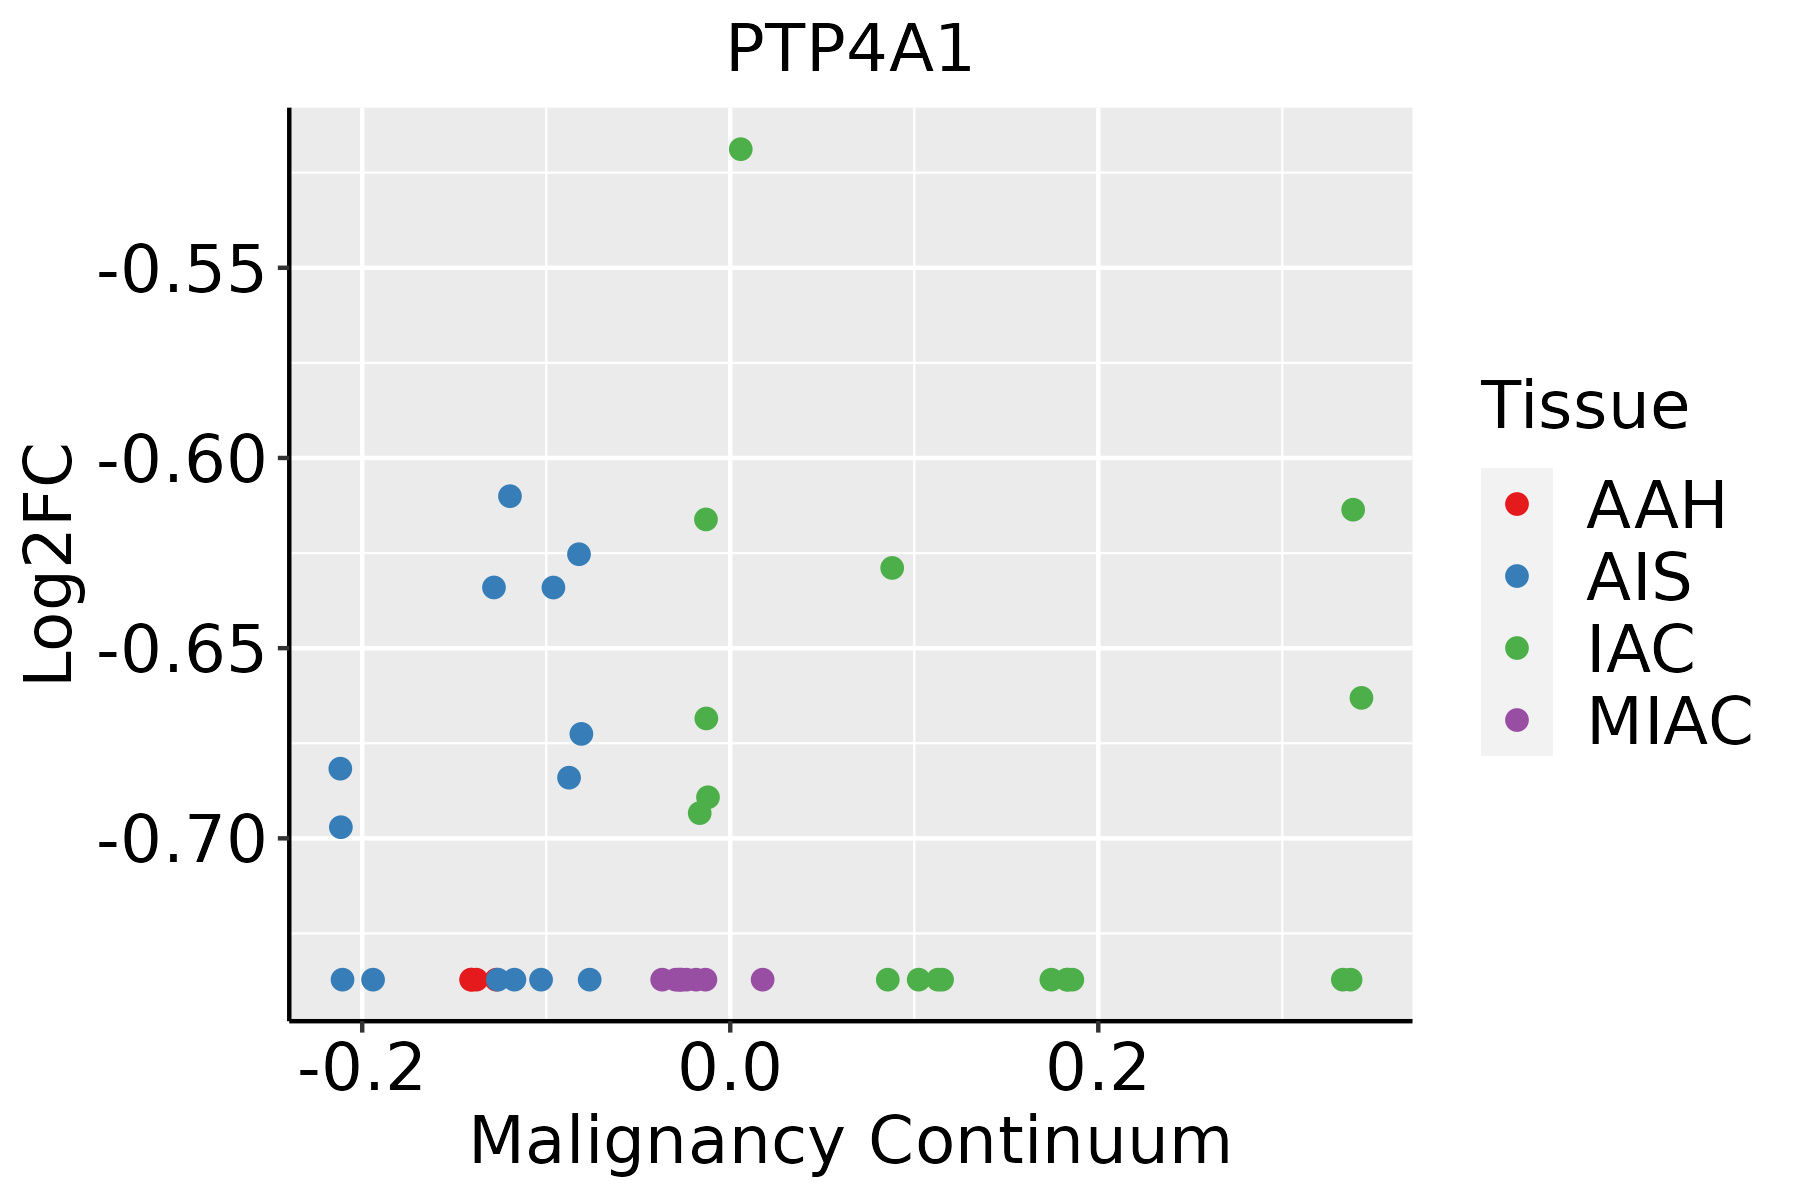 | AAH: Atypical adenomatous hyperplasia |
| AIS: Adenocarcinoma in situ | ||
| IAC: Invasive lung adenocarcinoma | ||
| MIA: Minimally invasive adenocarcinoma | ||
| Oral Cavity |  | EOLP: Erosive Oral lichen planus |
| LP: leukoplakia | ||
| NEOLP: Non-erosive oral lichen planus | ||
| OSCC: Oral squamous cell carcinoma | ||
| Prostate | 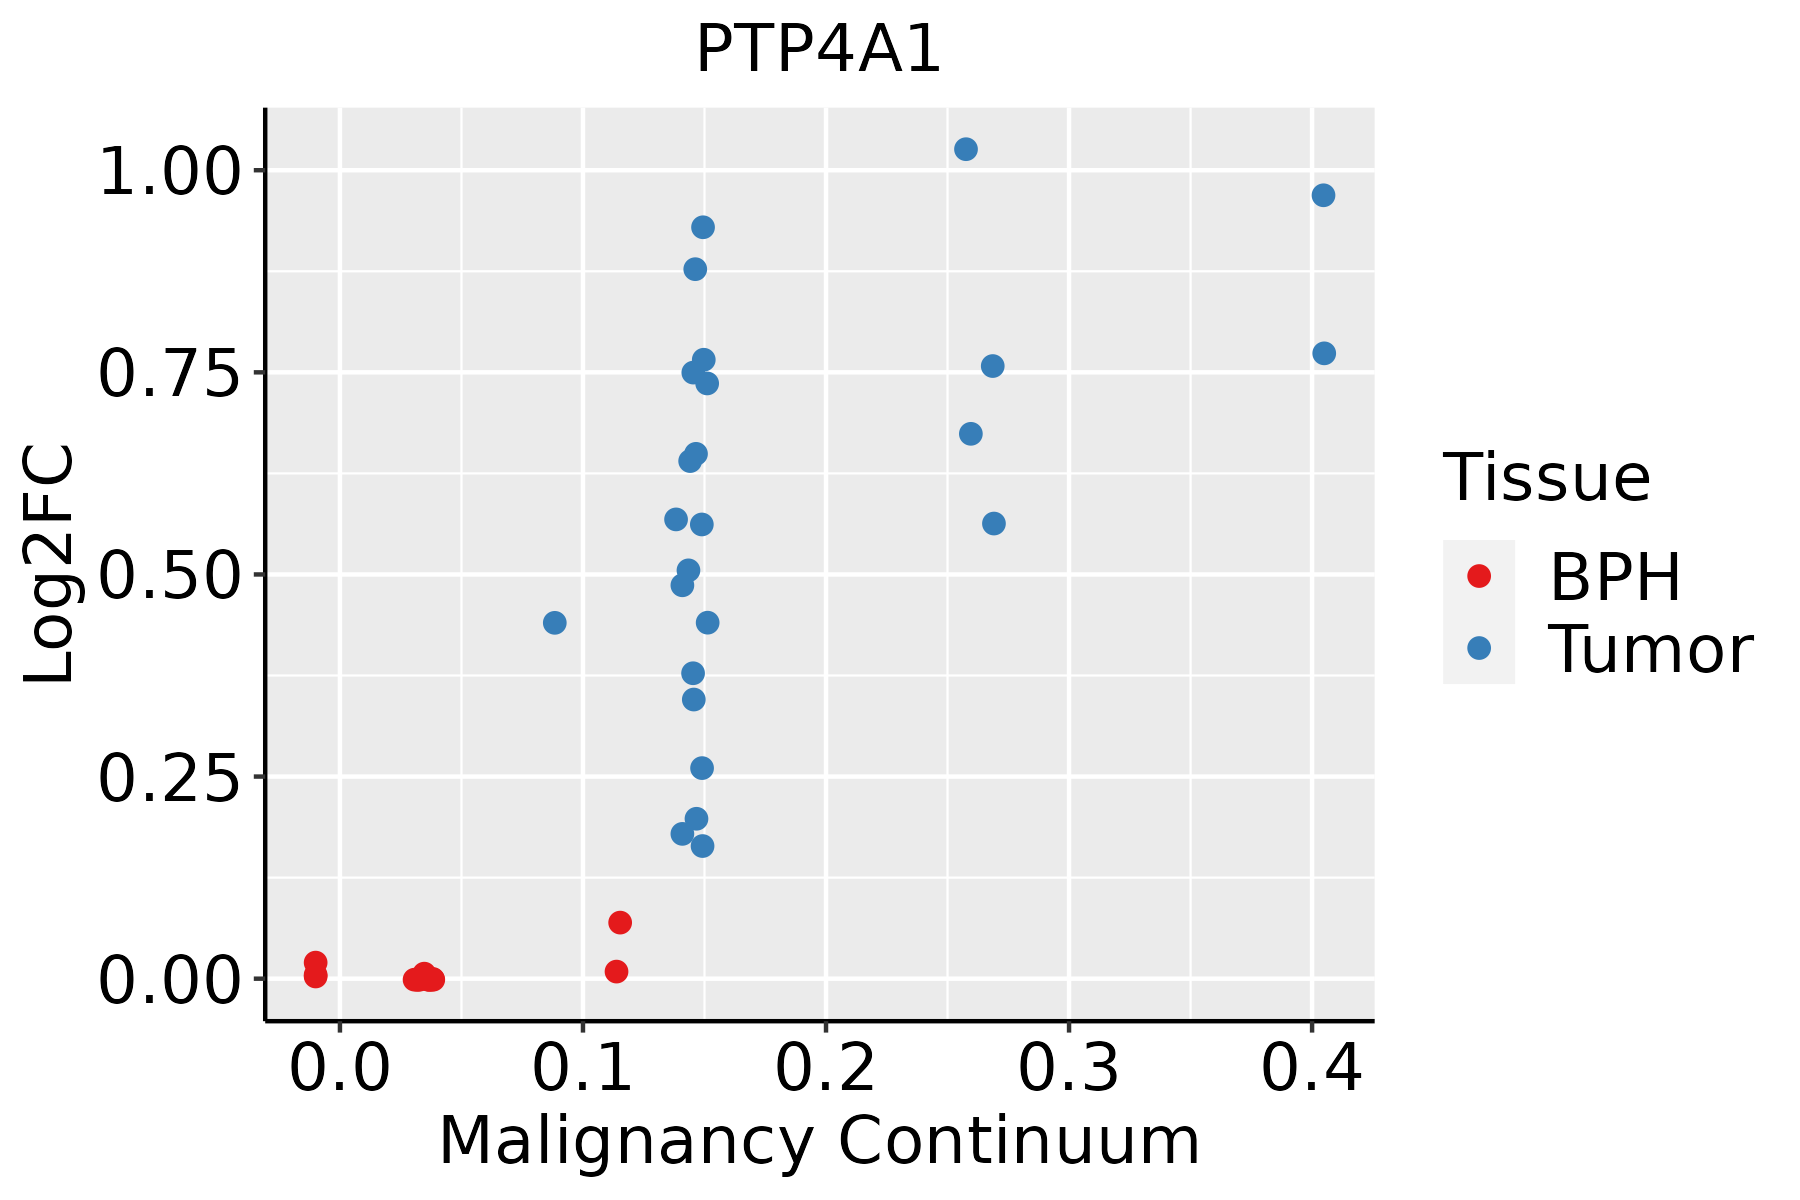 | BPH: Benign Prostatic Hyperplasia |
| Skin | 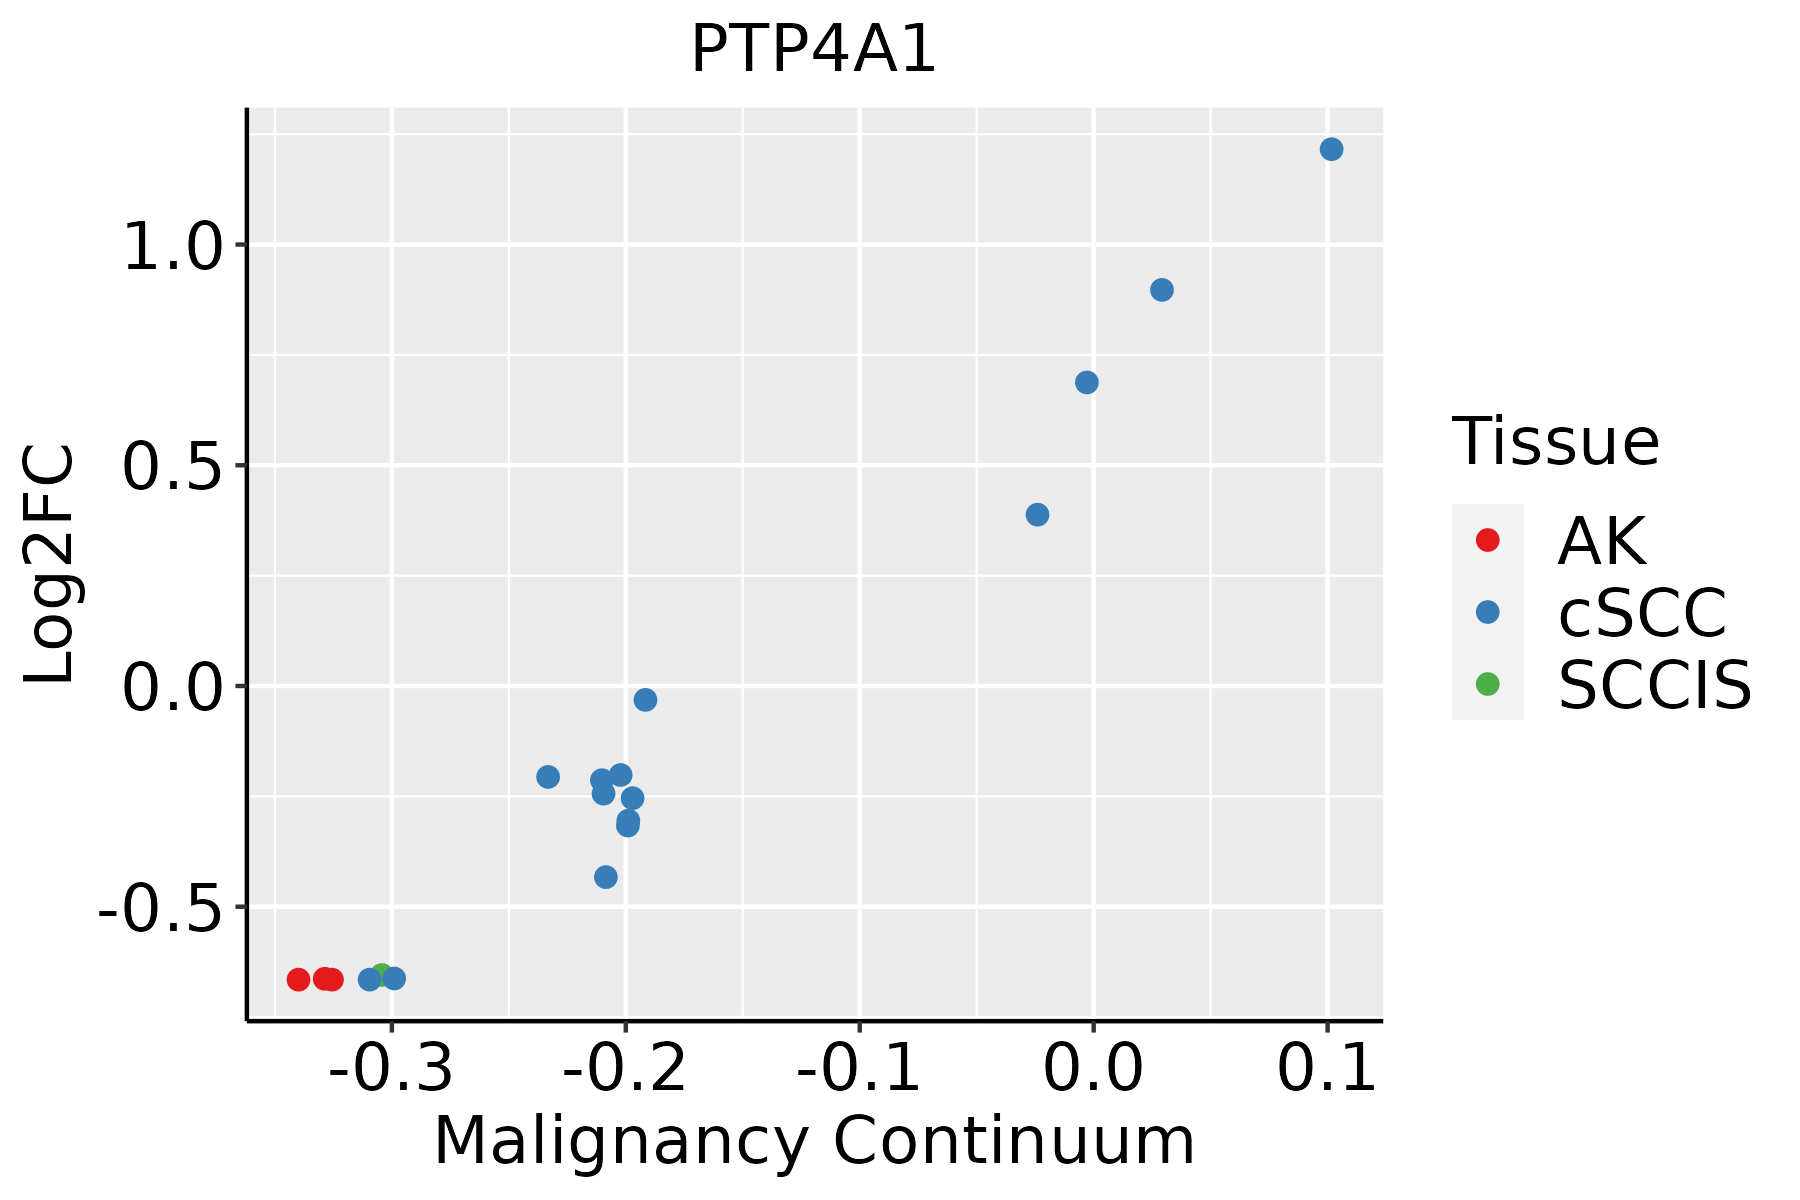 | AK: Actinic keratosis |
| cSCC: Cutaneous squamous cell carcinoma | ||
| SCCIS:squamous cell carcinoma in situ | ||
| Thyroid | 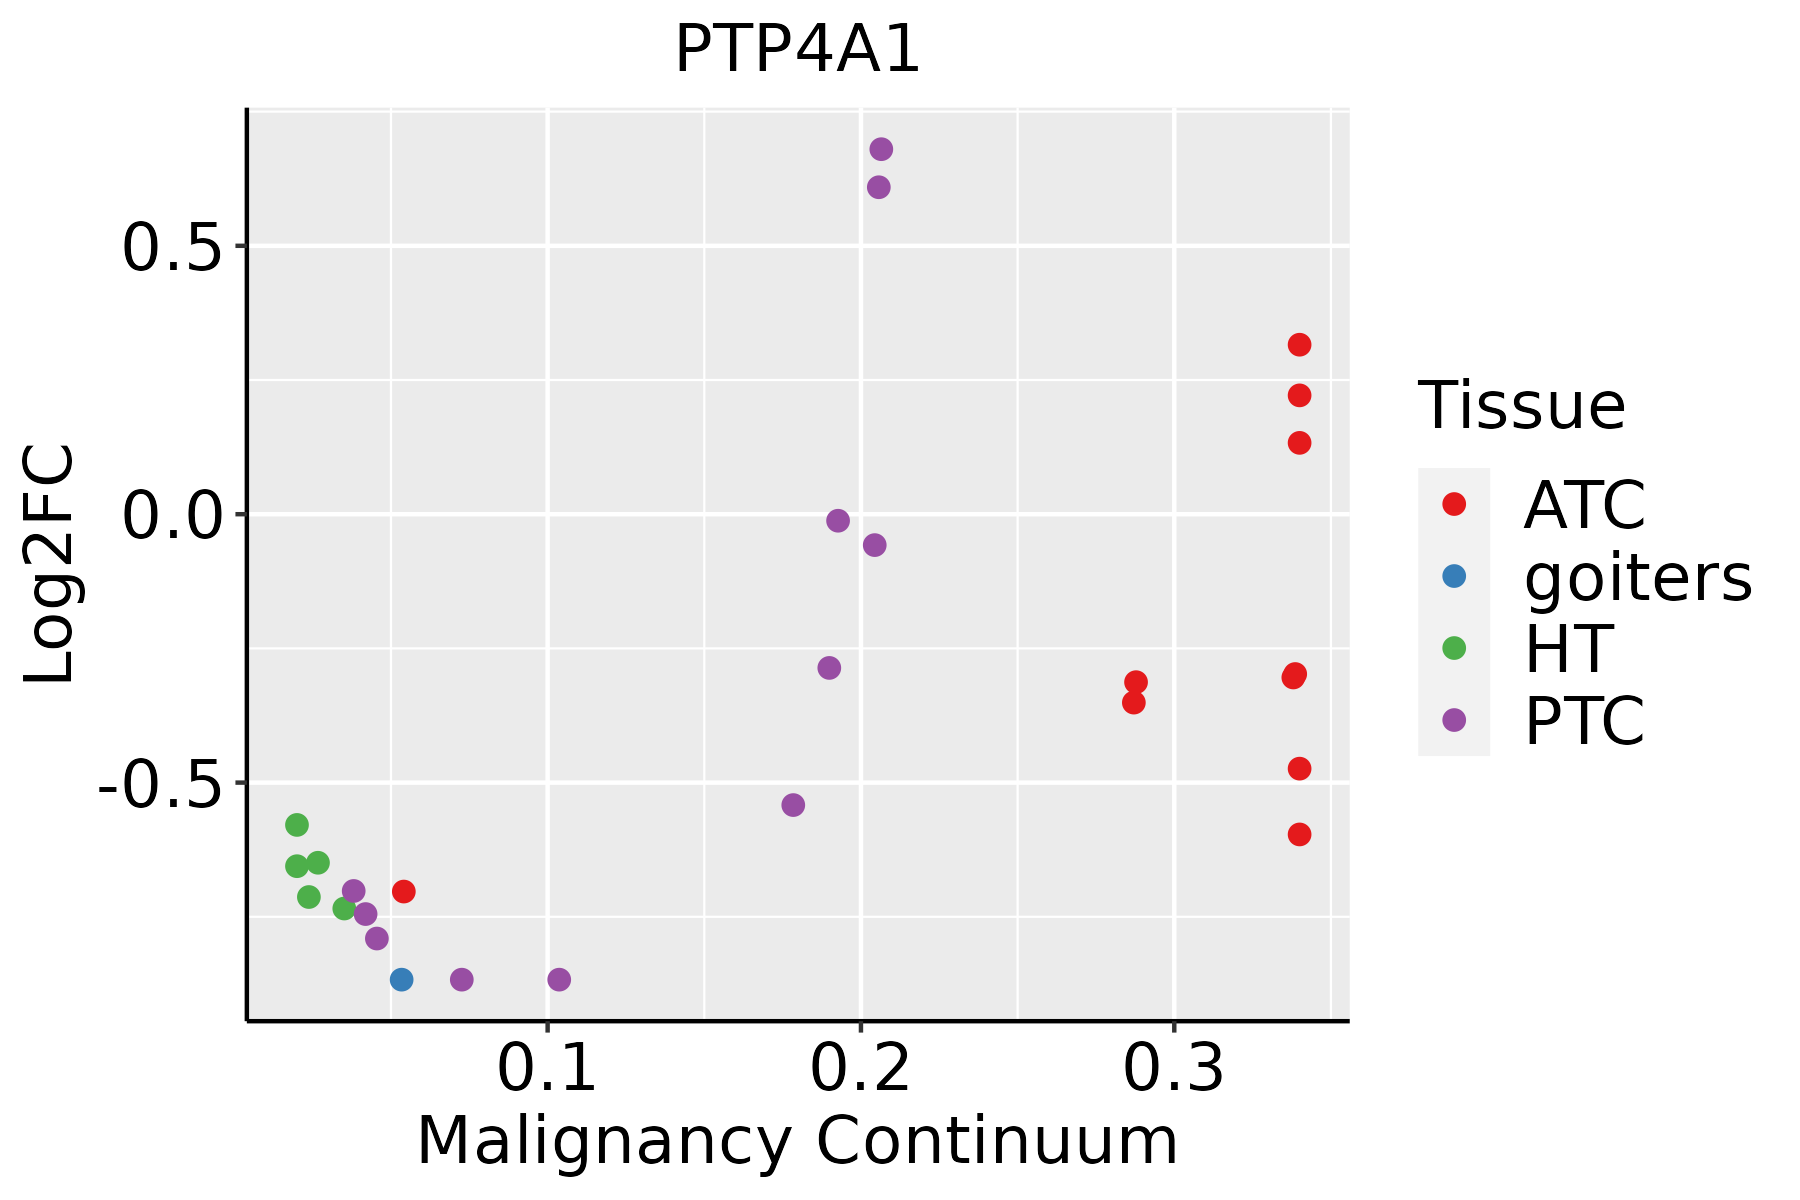 | ATC: Anaplastic thyroid cancer |
| HT: Hashimoto's thyroiditis | ||
| PTC: Papillary thyroid cancer |
| ∗log2FC in expression of this searched gene in stem-like cells from each diseased tissue sample relative to stem-like cells in normal samples in each tissue plotted against the malignancy continuum. Samples are colored based on if they are from different disease stage. |
Top |
Malignant transformation related pathway analysis |
| Find out the enriched GO biological processes and KEGG pathways involved in transition from healthy to precancer to cancer |
| Tissue | Disease Stage | Enriched GO biological Processes |
| Colorectum | AD |  |
| Colorectum | SER |  |
| Colorectum | MSS |  |
| Colorectum | MSI-H |  |
| Colorectum | FAP |  |
| ∗Top 15 enriched GO BP terms are showed in the bar plot of each disease state in each tissue. Each row represents a significant GO biological process which is colored according to the -log10(p.adjust). |
| Page: 1 2 3 4 5 6 7 8 9 |
| GO ID | Tissue | Disease Stage | Description | Gene Ratio | Bg Ratio | pvalue | p.adjust | Count |
| GO:0016311 | Colorectum | AD | dephosphorylation | 123/3918 | 417/18723 | 1.84e-05 | 3.82e-04 | 123 |
| GO:0006470 | Colorectum | AD | protein dephosphorylation | 88/3918 | 281/18723 | 2.56e-05 | 4.89e-04 | 88 |
| GO:00064701 | Colorectum | SER | protein dephosphorylation | 65/2897 | 281/18723 | 4.44e-04 | 6.51e-03 | 65 |
| GO:00163111 | Colorectum | SER | dephosphorylation | 86/2897 | 417/18723 | 2.73e-03 | 2.46e-02 | 86 |
| GO:00163113 | Colorectum | FAP | dephosphorylation | 95/2622 | 417/18723 | 7.07e-07 | 3.32e-05 | 95 |
| GO:00064704 | Colorectum | FAP | protein dephosphorylation | 69/2622 | 281/18723 | 1.47e-06 | 6.39e-05 | 69 |
| GO:0035335 | Colorectum | FAP | peptidyl-tyrosine dephosphorylation | 23/2622 | 97/18723 | 6.95e-03 | 4.26e-02 | 23 |
| GO:000647017 | Esophagus | HGIN | protein dephosphorylation | 61/2587 | 281/18723 | 1.86e-04 | 3.51e-03 | 61 |
| GO:001631110 | Esophagus | ESCC | dephosphorylation | 251/8552 | 417/18723 | 1.26e-09 | 2.99e-08 | 251 |
| GO:000647018 | Esophagus | ESCC | protein dephosphorylation | 177/8552 | 281/18723 | 3.13e-09 | 6.72e-08 | 177 |
| GO:000647011 | Liver | Cirrhotic | protein dephosphorylation | 96/4634 | 281/18723 | 2.32e-04 | 2.11e-03 | 96 |
| GO:001631111 | Liver | Cirrhotic | dephosphorylation | 130/4634 | 417/18723 | 1.58e-03 | 1.03e-02 | 130 |
| GO:001631121 | Liver | HCC | dephosphorylation | 230/7958 | 417/18723 | 1.00e-07 | 1.96e-06 | 230 |
| GO:000647021 | Liver | HCC | protein dephosphorylation | 162/7958 | 281/18723 | 1.91e-07 | 3.46e-06 | 162 |
| GO:00064707 | Lung | IAC | protein dephosphorylation | 60/2061 | 281/18723 | 3.24e-07 | 2.48e-05 | 60 |
| GO:00163116 | Lung | IAC | dephosphorylation | 75/2061 | 417/18723 | 1.21e-05 | 3.64e-04 | 75 |
| GO:00353353 | Lung | IAC | peptidyl-tyrosine dephosphorylation | 23/2061 | 97/18723 | 2.79e-04 | 4.56e-03 | 23 |
| GO:000647015 | Oral cavity | OSCC | protein dephosphorylation | 162/7305 | 281/18723 | 1.56e-10 | 4.56e-09 | 162 |
| GO:00163119 | Oral cavity | OSCC | dephosphorylation | 220/7305 | 417/18723 | 6.33e-09 | 1.34e-07 | 220 |
| GO:000647016 | Oral cavity | LP | protein dephosphorylation | 89/4623 | 281/18723 | 4.60e-03 | 2.93e-02 | 89 |
| Page: 1 2 |
| Pathway ID | Tissue | Disease Stage | Description | Gene Ratio | Bg Ratio | pvalue | p.adjust | qvalue | Count |
| Page: 1 |
Top |
Cell-cell communication analysis |
| Identification of potential cell-cell interactions between two cell types and their ligand-receptor pairs for different disease states |
| Ligand | Receptor | LRpair | Pathway | Tissue | Disease Stage |
| Page: 1 |
Top |
Single-cell gene regulatory network inference analysis |
| Find out the significant the regulons (TFs) and the target genes of each regulon across cell types for different disease states |
| TF | Cell Type | Tissue | Disease Stage | Target Gene | RSS | Regulon Activity |
| ∗The dot plots of a searched regulon are shown for all cell subpopulations in each disease state of each tissue based on the regulon specific score inferred using pySCENIC and by calculating the average expression. |
| Page: 1 |
Top |
Somatic mutation of malignant transformation related genes |
| Annotation of somatic variants for genes involved in malignant transformation |
| Hugo Symbol | Variant Class | Variant Classification | dbSNP RS | HGVSc | HGVSp | HGVSp Short | SWISSPROT | BIOTYPE | SIFT | PolyPhen | Tumor Sample Barcode | Tissue | Histology | Sex | Age | Stage | Therapy Types | Drugs | Outcome |
| PTP4A1 | SNV | Missense_Mutation | rs529722832 | c.83C>T | p.Ala28Val | p.A28V | Q93096 | protein_coding | tolerated(0.15) | benign(0) | TCGA-AA-A00N-01 | Colorectum | colon adenocarcinoma | Male | >=65 | I/II | Unknown | Unknown | PD |
| PTP4A1 | SNV | Missense_Mutation | novel | c.344T>A | p.Val115Asp | p.V115D | Q93096 | protein_coding | deleterious(0) | probably_damaging(0.999) | TCGA-G4-6295-01 | Colorectum | colon adenocarcinoma | Female | >=65 | I/II | Unknown | Unknown | SD |
| PTP4A1 | SNV | Missense_Mutation | rs529722832 | c.83N>T | p.Ala28Val | p.A28V | Q93096 | protein_coding | tolerated(0.15) | benign(0) | TCGA-A5-A0G2-01 | Endometrium | uterine corpus endometrioid carcinoma | Female | <65 | III/IV | Unknown | Unknown | SD |
| PTP4A1 | SNV | Missense_Mutation | novel | c.379N>A | p.Glu127Lys | p.E127K | Q93096 | protein_coding | tolerated(0.09) | benign(0.213) | TCGA-A5-A0G2-01 | Endometrium | uterine corpus endometrioid carcinoma | Female | <65 | III/IV | Unknown | Unknown | SD |
| PTP4A1 | SNV | Missense_Mutation | c.316N>A | p.Ala106Thr | p.A106T | Q93096 | protein_coding | deleterious(0.05) | benign(0.119) | TCGA-AP-A0LM-01 | Endometrium | uterine corpus endometrioid carcinoma | Female | <65 | III/IV | Chemotherapy | cisplatin | SD | |
| PTP4A1 | SNV | Missense_Mutation | novel | c.432N>T | p.Lys144Asn | p.K144N | Q93096 | protein_coding | deleterious(0.02) | probably_damaging(0.92) | TCGA-AX-A06F-01 | Endometrium | uterine corpus endometrioid carcinoma | Female | <65 | III/IV | Chemotherapy | carboplatin | SD |
| PTP4A1 | SNV | Missense_Mutation | c.17G>A | p.Arg6His | p.R6H | Q93096 | protein_coding | tolerated(0.25) | benign(0) | TCGA-AX-A2HC-01 | Endometrium | uterine corpus endometrioid carcinoma | Female | <65 | III/IV | Chemotherapy | paclitaxel | PD | |
| PTP4A1 | SNV | Missense_Mutation | novel | c.8N>A | p.Arg3Gln | p.R3Q | Q93096 | protein_coding | tolerated(0.37) | benign(0.001) | TCGA-B5-A1MR-01 | Endometrium | uterine corpus endometrioid carcinoma | Female | >=65 | III/IV | Unknown | Unknown | SD |
| PTP4A1 | SNV | Missense_Mutation | novel | c.457N>T | p.Arg153Cys | p.R153C | Q93096 | protein_coding | tolerated(0.1) | benign(0) | TCGA-B5-A3FC-01 | Endometrium | uterine corpus endometrioid carcinoma | Female | <65 | I/II | Unknown | Unknown | SD |
| PTP4A1 | SNV | Missense_Mutation | rs777437055 | c.116N>G | p.Lys39Arg | p.K39R | Q93096 | protein_coding | tolerated(0.17) | benign(0.001) | TCGA-BS-A0UV-01 | Endometrium | uterine corpus endometrioid carcinoma | Female | <65 | III/IV | Unknown | Unknown | SD |
| Page: 1 2 |
Top |
Related drugs of malignant transformation related genes |
| Identification of chemicals and drugs interact with genes involved in malignant transfromation |
| (DGIdb 4.0) |
| Entrez ID | Symbol | Category | Interaction Types | Drug Claim Name | Drug Name | PMIDs |
| 7803 | PTP4A1 | DRUGGABLE GENOME, PROTEIN PHOSPHATASE | HALOFUGINONE | HALOFUGINONE | 16508789 |
| Page: 1 |

Copyright 2023-Present -The University of Texas Health Science Center at Houston |