
|
|||||
|
 | |
| |
| |
| |
| |
| |
|
Gene: PTOV1 |
Gene summary for PTOV1 |
| Gene information | Species | Human | Gene symbol | PTOV1 | Gene ID | 53635 |
| Gene name | PTOV1 extended AT-hook containing adaptor protein | |
| Gene Alias | ACID2 | |
| Cytomap | 19q13.33 | |
| Gene Type | protein-coding | GO ID | GO:0006139 | UniProtAcc | Q86YD1 |
Top |
Malignant transformation analysis |
| Identification of the aberrant gene expression in precancerous and cancerous lesions by comparing the gene expression of stem-like cells in diseased tissues with normal stem cells |
| Entrez ID | Symbol | Replicates | Species | Organ | Tissue | Adj P-value | Log2FC | Malignancy |
| 53635 | PTOV1 | AEH-subject1 | Human | Endometrium | AEH | 4.37e-04 | -1.27e-01 | -0.3059 |
| 53635 | PTOV1 | AEH-subject2 | Human | Endometrium | AEH | 1.49e-07 | -2.91e-01 | -0.2525 |
| 53635 | PTOV1 | AEH-subject3 | Human | Endometrium | AEH | 1.63e-02 | -1.24e-01 | -0.2576 |
| 53635 | PTOV1 | AEH-subject4 | Human | Endometrium | AEH | 4.07e-03 | -2.61e-01 | -0.2657 |
| 53635 | PTOV1 | AEH-subject5 | Human | Endometrium | AEH | 1.85e-07 | -3.72e-01 | -0.2953 |
| 53635 | PTOV1 | EEC-subject1 | Human | Endometrium | EEC | 1.87e-11 | -2.47e-01 | -0.2682 |
| 53635 | PTOV1 | EEC-subject2 | Human | Endometrium | EEC | 1.31e-02 | -1.54e-01 | -0.2607 |
| 53635 | PTOV1 | EEC-subject3 | Human | Endometrium | EEC | 2.43e-25 | -4.29e-01 | -0.2525 |
| 53635 | PTOV1 | EEC-subject4 | Human | Endometrium | EEC | 6.89e-10 | -2.92e-01 | -0.2571 |
| 53635 | PTOV1 | EEC-subject5 | Human | Endometrium | EEC | 1.00e-02 | -1.72e-01 | -0.249 |
| 53635 | PTOV1 | GSM5276934 | Human | Endometrium | EEC | 2.50e-10 | -3.56e-01 | -0.0913 |
| 53635 | PTOV1 | GSM5276937 | Human | Endometrium | EEC | 3.27e-08 | -3.68e-01 | -0.0897 |
| 53635 | PTOV1 | GSM6177620_NYU_UCEC1_lib1_lib1 | Human | Endometrium | EEC | 6.63e-33 | 8.19e-02 | -0.1869 |
| 53635 | PTOV1 | GSM6177620_NYU_UCEC1_lib2_lib2 | Human | Endometrium | EEC | 1.14e-29 | -4.93e-02 | -0.1875 |
| 53635 | PTOV1 | GSM6177620_NYU_UCEC1_lib3_lib3 | Human | Endometrium | EEC | 3.41e-33 | -1.86e-01 | -0.1883 |
| 53635 | PTOV1 | GSM6177621_NYU_UCEC2_lib1_lib1 | Human | Endometrium | EEC | 2.69e-28 | 4.81e-02 | -0.1934 |
| 53635 | PTOV1 | GSM6177622_NYU_UCEC3_lib1_lib1 | Human | Endometrium | EEC | 2.73e-43 | -1.51e-01 | -0.1917 |
| 53635 | PTOV1 | GSM6177622_NYU_UCEC3_lib2_lib2 | Human | Endometrium | EEC | 3.94e-43 | -1.94e-01 | -0.1916 |
| 53635 | PTOV1 | GSM6177623_NYU_UCEC3_Vis | Human | Endometrium | EEC | 1.01e-11 | 2.42e-01 | -0.1269 |
| 53635 | PTOV1 | LZE4T | Human | Esophagus | ESCC | 7.77e-06 | -2.34e-02 | 0.0811 |
| Page: 1 2 3 4 5 6 7 |
| Tissue | Expression Dynamics | Abbreviation |
| Endometrium | 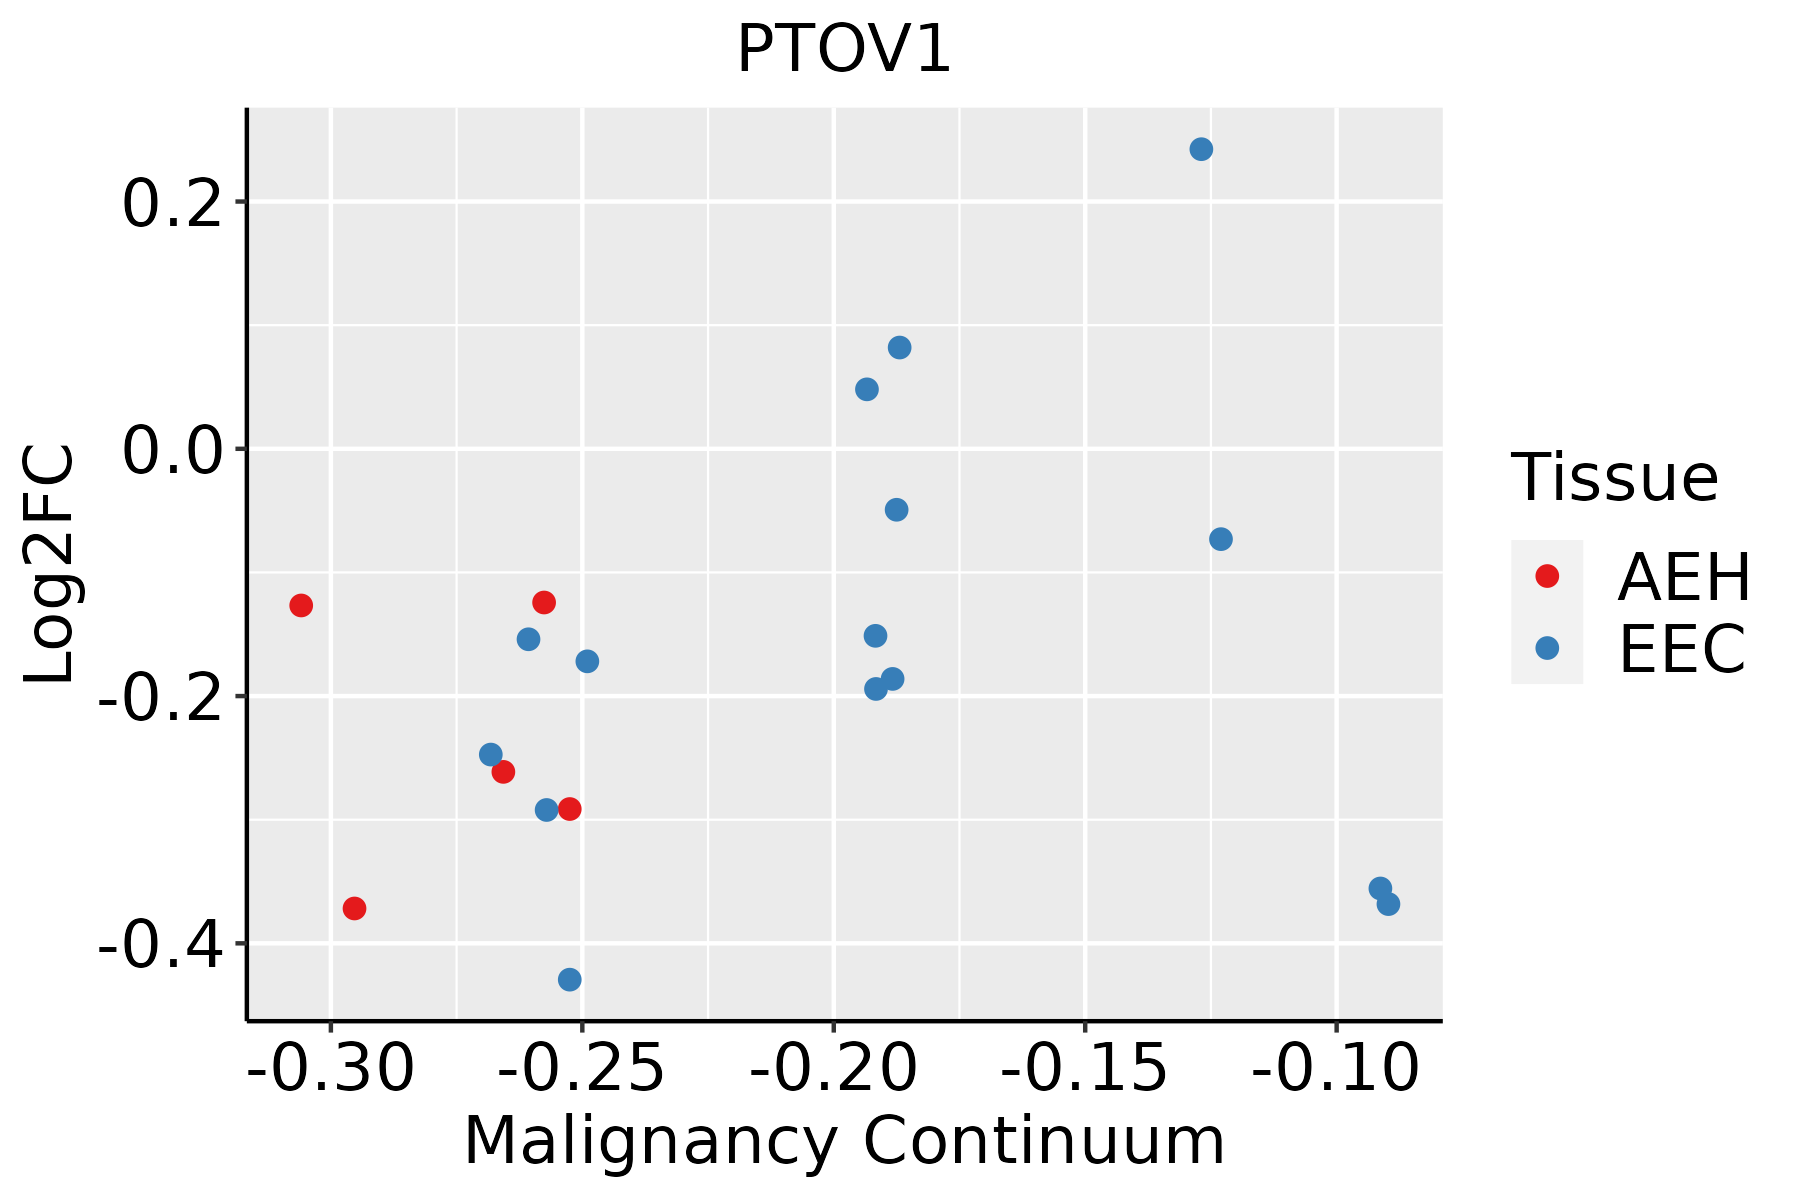 | AEH: Atypical endometrial hyperplasia |
| EEC: Endometrioid Cancer | ||
| Esophagus |  | ESCC: Esophageal squamous cell carcinoma |
| HGIN: High-grade intraepithelial neoplasias | ||
| LGIN: Low-grade intraepithelial neoplasias | ||
| Liver | 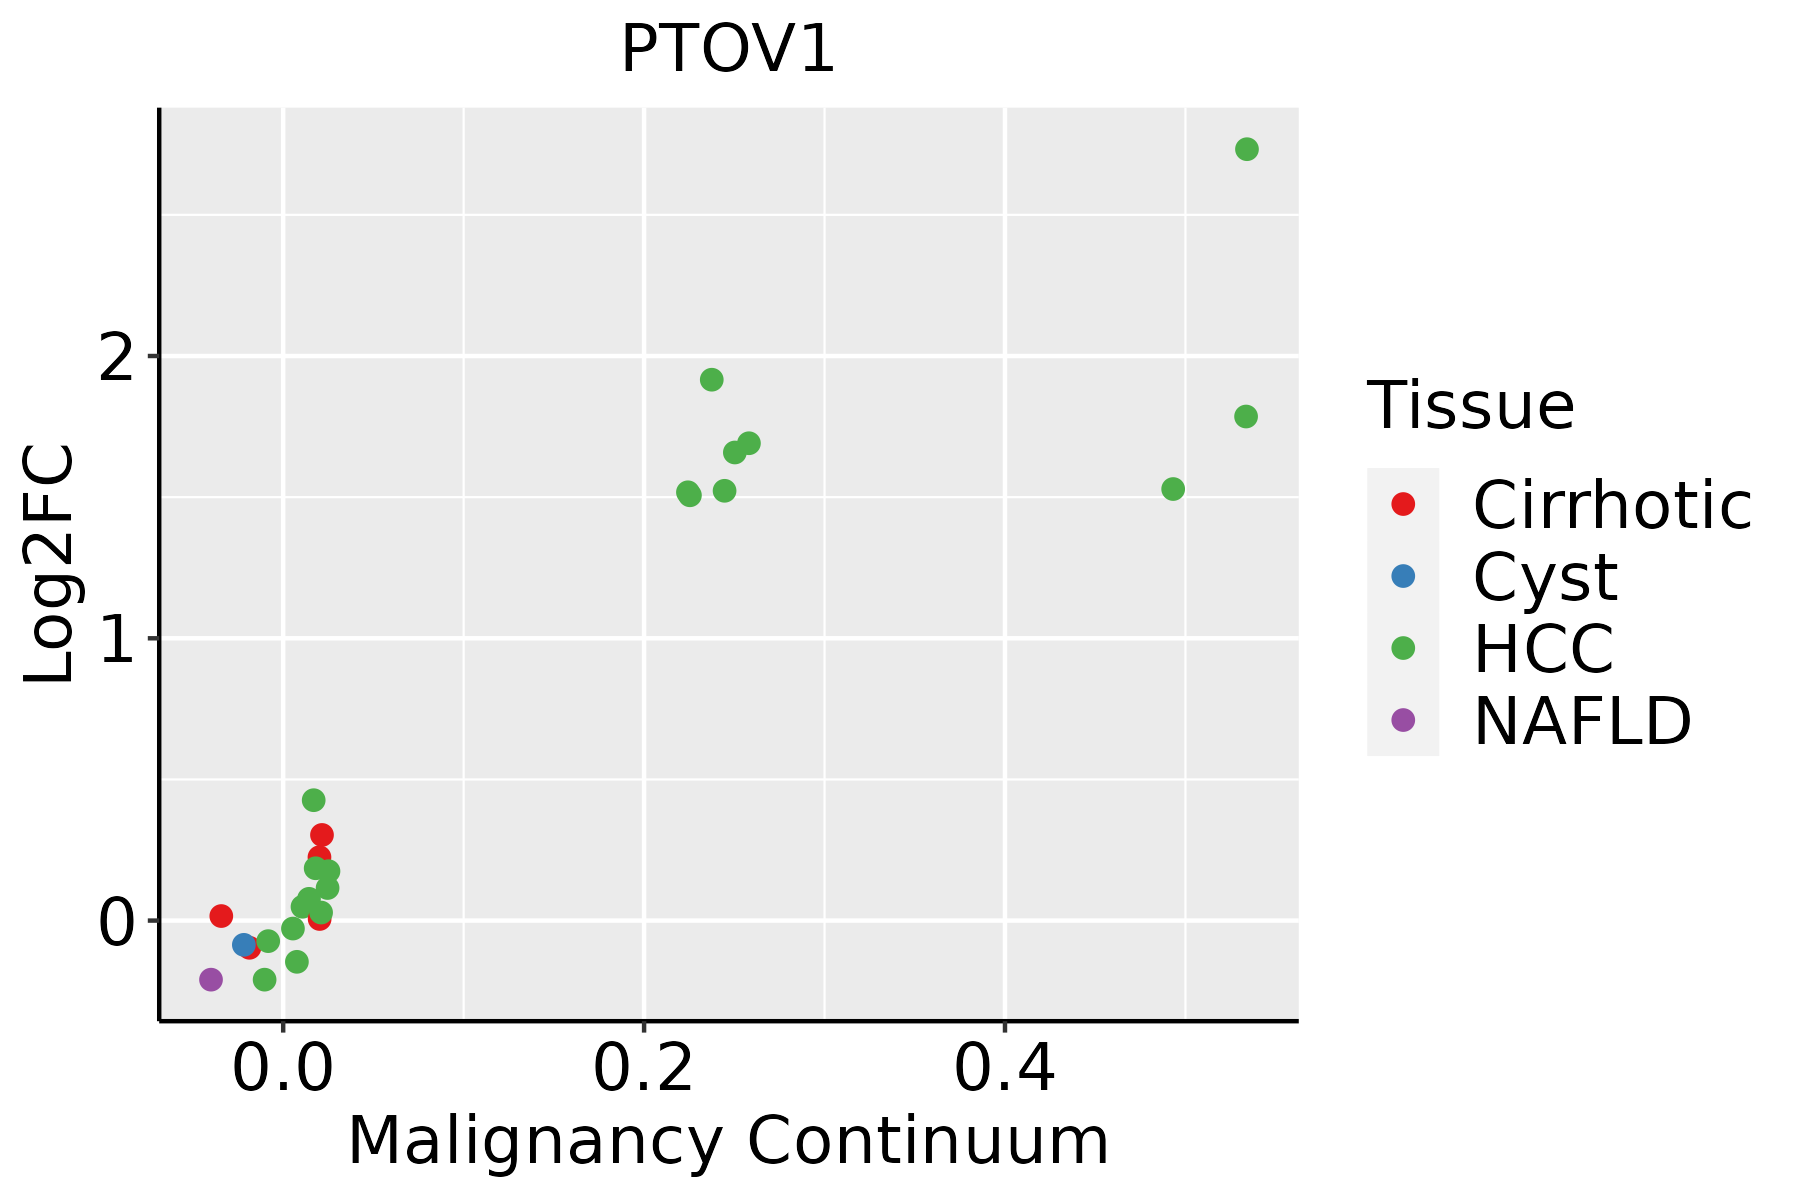 | HCC: Hepatocellular carcinoma |
| NAFLD: Non-alcoholic fatty liver disease | ||
| Oral Cavity | 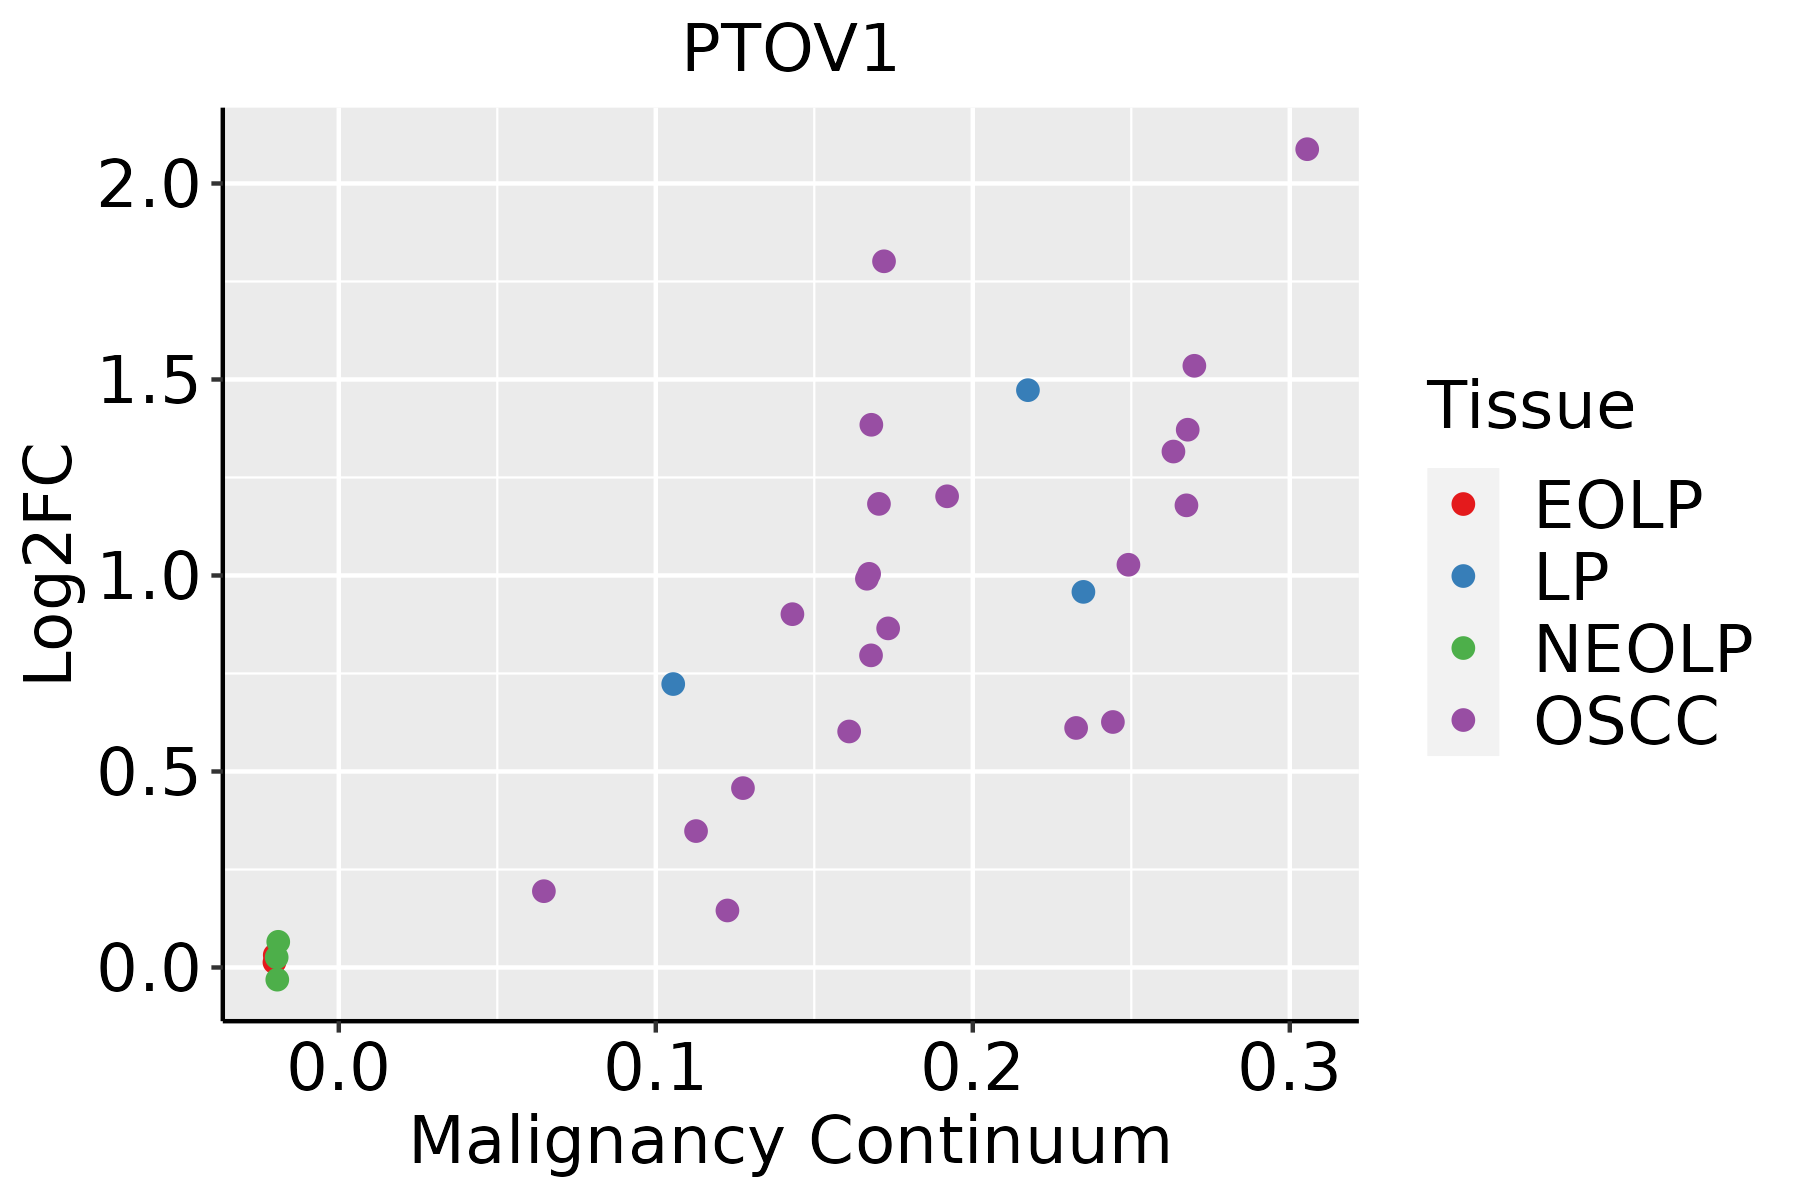 | EOLP: Erosive Oral lichen planus |
| LP: leukoplakia | ||
| NEOLP: Non-erosive oral lichen planus | ||
| OSCC: Oral squamous cell carcinoma | ||
| Skin | 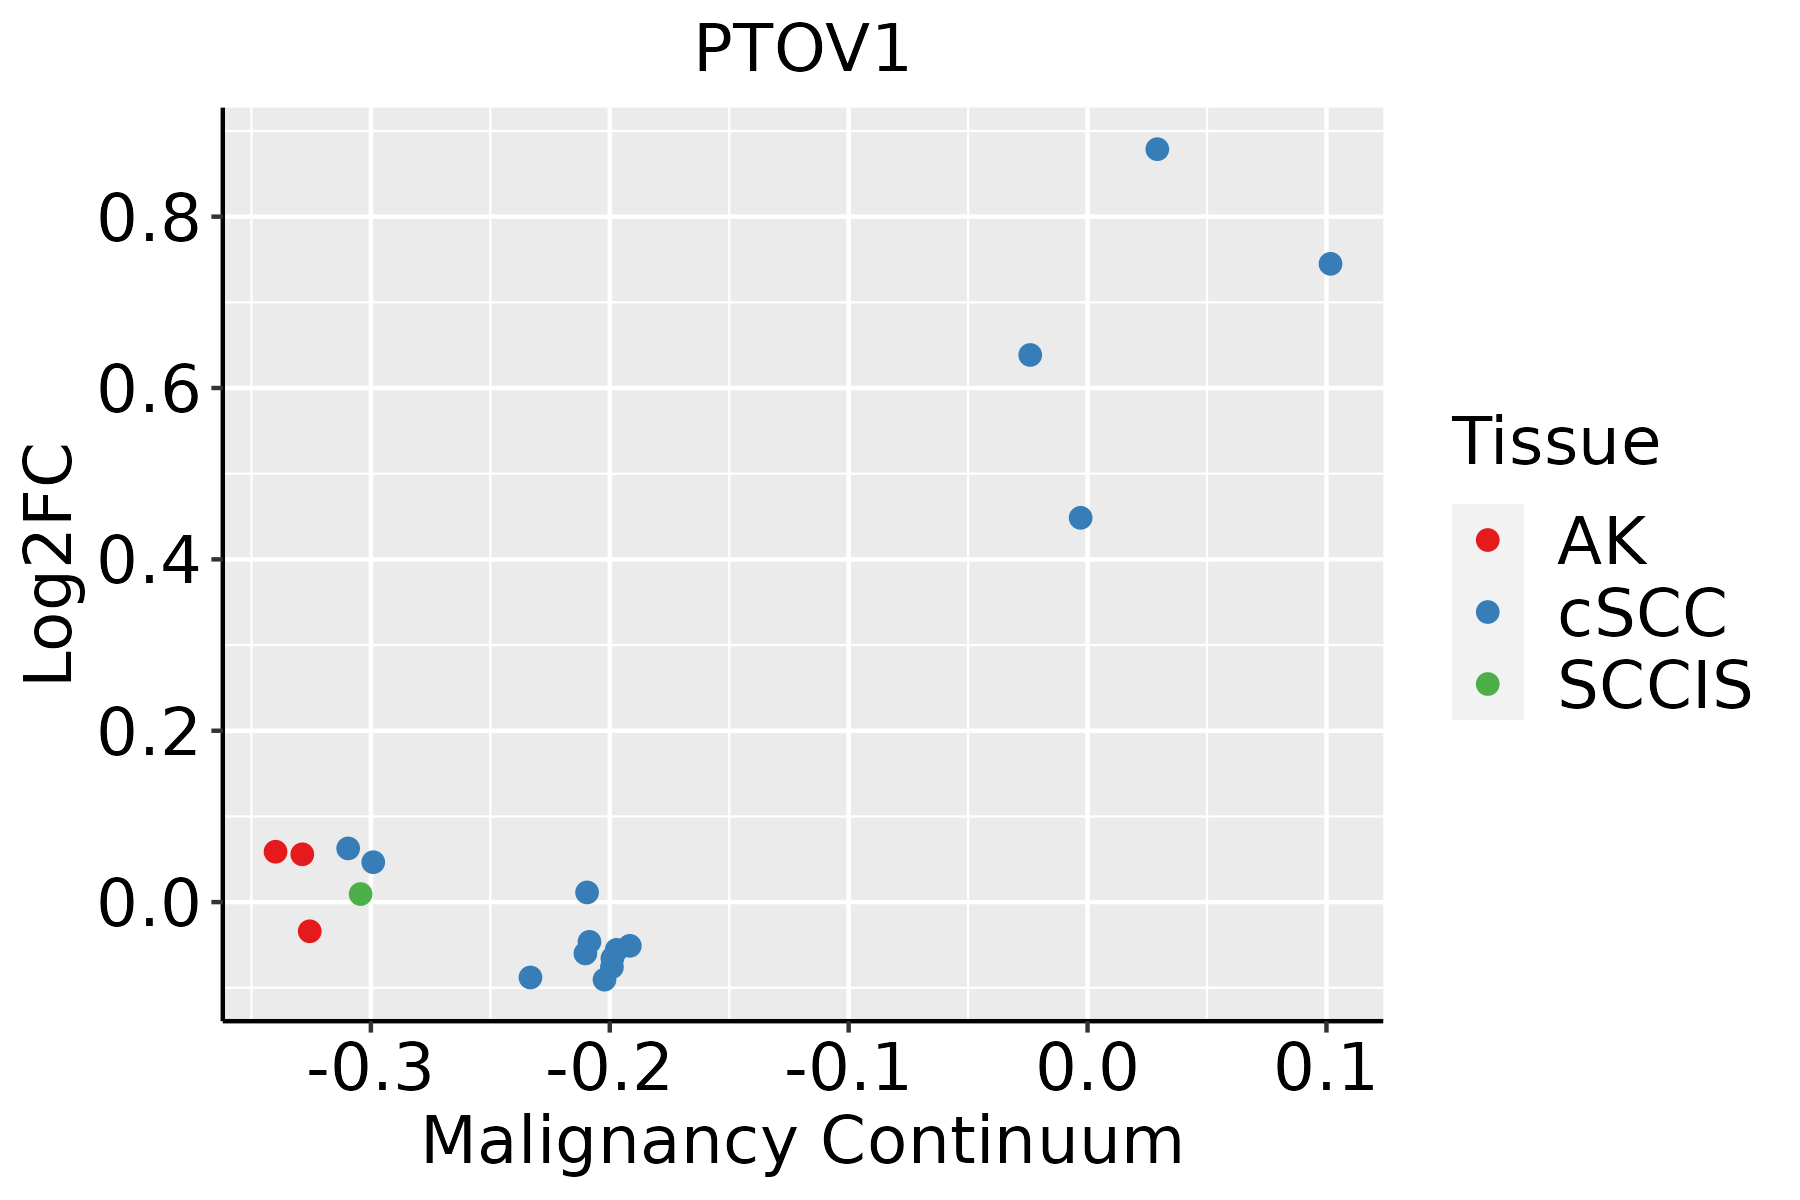 | AK: Actinic keratosis |
| cSCC: Cutaneous squamous cell carcinoma | ||
| SCCIS:squamous cell carcinoma in situ | ||
| Thyroid | 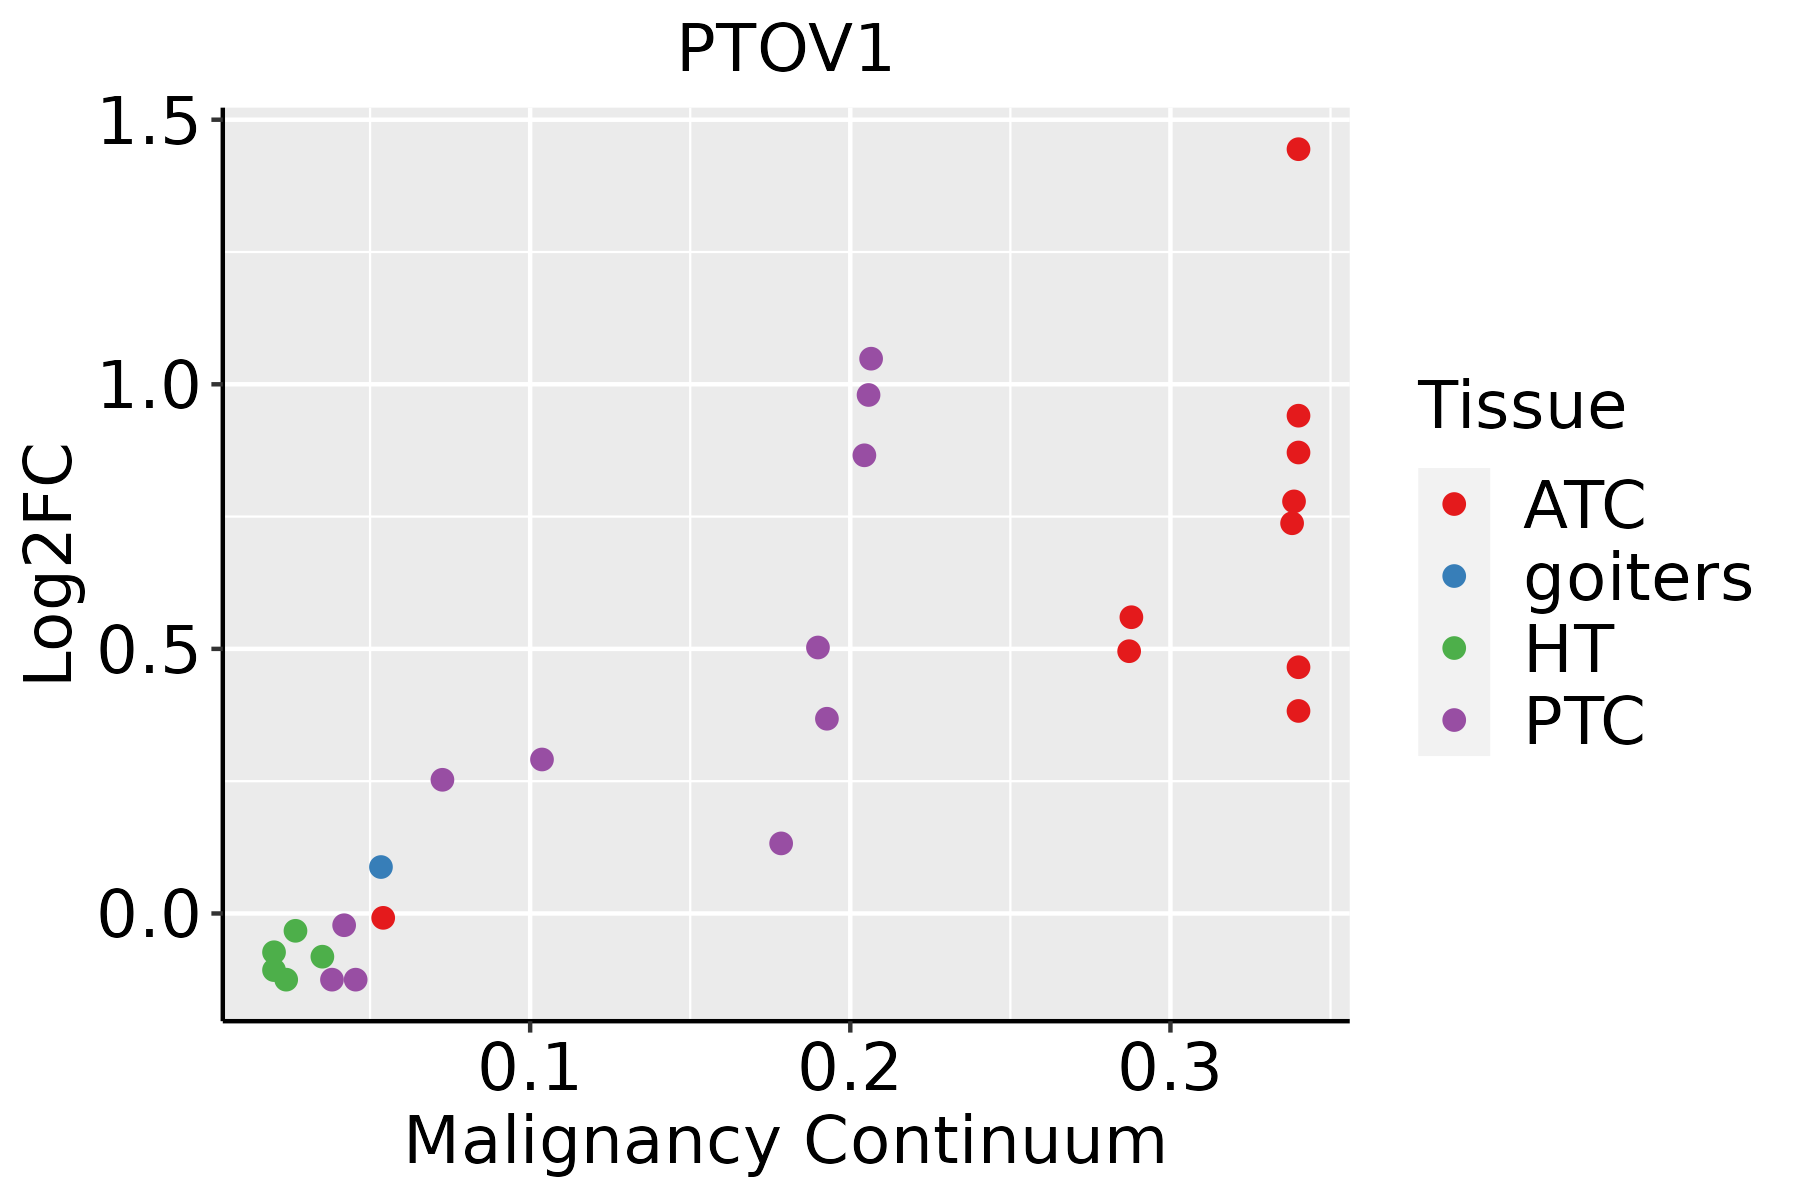 | ATC: Anaplastic thyroid cancer |
| HT: Hashimoto's thyroiditis | ||
| PTC: Papillary thyroid cancer |
| ∗log2FC in expression of this searched gene in stem-like cells from each diseased tissue sample relative to stem-like cells in normal samples in each tissue plotted against the malignancy continuum. Samples are colored based on if they are from different disease stage. |
Top |
Malignant transformation related pathway analysis |
| Find out the enriched GO biological processes and KEGG pathways involved in transition from healthy to precancer to cancer |
| Tissue | Disease Stage | Enriched GO biological Processes |
| Colorectum | AD |  |
| Colorectum | SER |  |
| Colorectum | MSS |  |
| Colorectum | MSI-H |  |
| Colorectum | FAP |  |
| ∗Top 15 enriched GO BP terms are showed in the bar plot of each disease state in each tissue. Each row represents a significant GO biological process which is colored according to the -log10(p.adjust). |
| Page: 1 2 3 4 5 6 7 8 9 |
| GO ID | Tissue | Disease Stage | Description | Gene Ratio | Bg Ratio | pvalue | p.adjust | Count |
| Page: 1 |
| Pathway ID | Tissue | Disease Stage | Description | Gene Ratio | Bg Ratio | pvalue | p.adjust | qvalue | Count |
| Page: 1 |
Top |
Cell-cell communication analysis |
| Identification of potential cell-cell interactions between two cell types and their ligand-receptor pairs for different disease states |
| Ligand | Receptor | LRpair | Pathway | Tissue | Disease Stage |
| Page: 1 |
Top |
Single-cell gene regulatory network inference analysis |
| Find out the significant the regulons (TFs) and the target genes of each regulon across cell types for different disease states |
| TF | Cell Type | Tissue | Disease Stage | Target Gene | RSS | Regulon Activity |
| ∗The dot plots of a searched regulon are shown for all cell subpopulations in each disease state of each tissue based on the regulon specific score inferred using pySCENIC and by calculating the average expression. |
| Page: 1 |
Top |
Somatic mutation of malignant transformation related genes |
| Annotation of somatic variants for genes involved in malignant transformation |
| Hugo Symbol | Variant Class | Variant Classification | dbSNP RS | HGVSc | HGVSp | HGVSp Short | SWISSPROT | BIOTYPE | SIFT | PolyPhen | Tumor Sample Barcode | Tissue | Histology | Sex | Age | Stage | Therapy Types | Drugs | Outcome |
| PTOV1 | insertion | Frame_Shift_Ins | novel | c.850_851insTCCCTCCG | p.His284LeufsTer7 | p.H284Lfs*7 | Q86YD1 | protein_coding | TCGA-DS-A1OB-01 | Cervix | cervical & endocervical cancer | Female | <65 | I/II | Chemotherapy | carboplatin | PD | ||
| PTOV1 | SNV | Missense_Mutation | rs771781769 | c.1208N>A | p.Arg403Gln | p.R403Q | Q86YD1 | protein_coding | tolerated_low_confidence(0.23) | benign(0.022) | TCGA-A6-6780-01 | Colorectum | colon adenocarcinoma | Male | >=65 | I/II | Unknown | Unknown | SD |
| PTOV1 | SNV | Missense_Mutation | rs377067186 | c.1174N>T | p.Arg392Cys | p.R392C | Q86YD1 | protein_coding | deleterious(0) | probably_damaging(0.995) | TCGA-AA-3818-01 | Colorectum | colon adenocarcinoma | Female | >=65 | I/II | Unknown | Unknown | PD |
| PTOV1 | SNV | Missense_Mutation | novel | c.851A>G | p.His284Arg | p.H284R | Q86YD1 | protein_coding | deleterious(0.04) | benign(0.403) | TCGA-AA-3949-01 | Colorectum | colon adenocarcinoma | Female | >=65 | III/IV | Unknown | Unknown | SD |
| PTOV1 | SNV | Missense_Mutation | c.728N>A | p.Gly243Asp | p.G243D | Q86YD1 | protein_coding | deleterious(0.01) | benign(0.286) | TCGA-CK-4952-01 | Colorectum | colon adenocarcinoma | Female | <65 | III/IV | Unknown | Unknown | SD | |
| PTOV1 | SNV | Missense_Mutation | rs764053837 | c.350N>A | p.Arg117Gln | p.R117Q | Q86YD1 | protein_coding | tolerated(0.07) | benign(0.062) | TCGA-CM-4752-01 | Colorectum | colon adenocarcinoma | Male | <65 | I/II | Unknown | Unknown | SD |
| PTOV1 | SNV | Missense_Mutation | c.1021N>T | p.Arg341Trp | p.R341W | Q86YD1 | protein_coding | deleterious(0) | probably_damaging(0.999) | TCGA-CM-6167-01 | Colorectum | colon adenocarcinoma | Female | <65 | III/IV | Unknown | Unknown | SD | |
| PTOV1 | SNV | Missense_Mutation | rs770938530 | c.313C>T | p.Arg105Cys | p.R105C | Q86YD1 | protein_coding | tolerated(0.06) | probably_damaging(0.995) | TCGA-CM-6171-01 | Colorectum | colon adenocarcinoma | Female | >=65 | I/II | Unknown | Unknown | SD |
| PTOV1 | SNV | Missense_Mutation | rs764330906 | c.1085N>A | p.Arg362His | p.R362H | Q86YD1 | protein_coding | deleterious(0.02) | probably_damaging(0.998) | TCGA-G4-6628-01 | Colorectum | colon adenocarcinoma | Male | >=65 | I/II | Unknown | Unknown | SD |
| PTOV1 | deletion | Frame_Shift_Del | c.239delG | p.Gly80ValfsTer4 | p.G80Vfs*4 | Q86YD1 | protein_coding | TCGA-AD-6895-01 | Colorectum | colon adenocarcinoma | Male | >=65 | III/IV | Unknown | Unknown | SD |
| Page: 1 2 3 4 5 |
Top |
Related drugs of malignant transformation related genes |
| Identification of chemicals and drugs interact with genes involved in malignant transfromation |
| (DGIdb 4.0) |
| Entrez ID | Symbol | Category | Interaction Types | Drug Claim Name | Drug Name | PMIDs |
| Page: 1 |

Copyright 2023-Present -The University of Texas Health Science Center at Houston |