
|
|||||
|
 | |
| |
| |
| |
| |
| |
|
Gene: PTN |
Gene summary for PTN |
| Gene information | Species | Human | Gene symbol | PTN | Gene ID | 5764 |
| Gene name | pleiotrophin | |
| Gene Alias | HARP | |
| Cytomap | 7q33 | |
| Gene Type | protein-coding | GO ID | GO:0000003 | UniProtAcc | A0A024R778 |
Top |
Malignant transformation analysis |
| Identification of the aberrant gene expression in precancerous and cancerous lesions by comparing the gene expression of stem-like cells in diseased tissues with normal stem cells |
| Entrez ID | Symbol | Replicates | Species | Organ | Tissue | Adj P-value | Log2FC | Malignancy |
| 5764 | PTN | GSM4909281 | Human | Breast | IDC | 4.32e-06 | -6.65e-02 | 0.21 |
| 5764 | PTN | GSM4909282 | Human | Breast | IDC | 2.50e-03 | -3.02e-01 | -0.0288 |
| 5764 | PTN | GSM4909285 | Human | Breast | IDC | 7.79e-05 | -3.03e-01 | 0.21 |
| 5764 | PTN | GSM4909286 | Human | Breast | IDC | 1.72e-05 | -3.12e-01 | 0.1081 |
| 5764 | PTN | GSM4909290 | Human | Breast | IDC | 2.64e-02 | -3.12e-01 | 0.2096 |
| 5764 | PTN | GSM4909299 | Human | Breast | IDC | 8.68e-87 | 1.66e+00 | 0.035 |
| 5764 | PTN | GSM4909300 | Human | Breast | IDC | 1.71e-17 | 1.10e+00 | 0.0334 |
| 5764 | PTN | GSM4909301 | Human | Breast | IDC | 7.79e-05 | -3.12e-01 | 0.1577 |
| 5764 | PTN | GSM4909304 | Human | Breast | IDC | 7.79e-05 | -3.09e-01 | 0.1636 |
| 5764 | PTN | GSM4909305 | Human | Breast | IDC | 8.54e-16 | 8.27e-01 | 0.0436 |
| 5764 | PTN | GSM4909309 | Human | Breast | IDC | 1.48e-62 | 1.54e+00 | 0.0483 |
| 5764 | PTN | GSM4909312 | Human | Breast | IDC | 1.72e-05 | -3.12e-01 | 0.1552 |
| 5764 | PTN | GSM4909313 | Human | Breast | IDC | 1.63e-23 | 9.90e-01 | 0.0391 |
| 5764 | PTN | GSM4909315 | Human | Breast | IDC | 7.79e-05 | -3.12e-01 | 0.21 |
| 5764 | PTN | GSM4909319 | Human | Breast | IDC | 7.79e-05 | -3.12e-01 | 0.1563 |
| 5764 | PTN | GSM4909321 | Human | Breast | IDC | 3.66e-05 | -3.12e-01 | 0.1559 |
| 5764 | PTN | NCCBC3 | Human | Breast | DCIS | 4.12e-54 | 1.23e+00 | 0.1198 |
| 5764 | PTN | DCIS2 | Human | Breast | DCIS | 7.06e-135 | 1.97e+00 | 0.0085 |
| 5764 | PTN | AEH-subject1 | Human | Endometrium | AEH | 7.30e-22 | -5.82e-01 | -0.3059 |
| 5764 | PTN | AEH-subject2 | Human | Endometrium | AEH | 6.64e-25 | -5.74e-01 | -0.2525 |
| Page: 1 2 3 4 5 6 |
| Tissue | Expression Dynamics | Abbreviation |
| Breast | 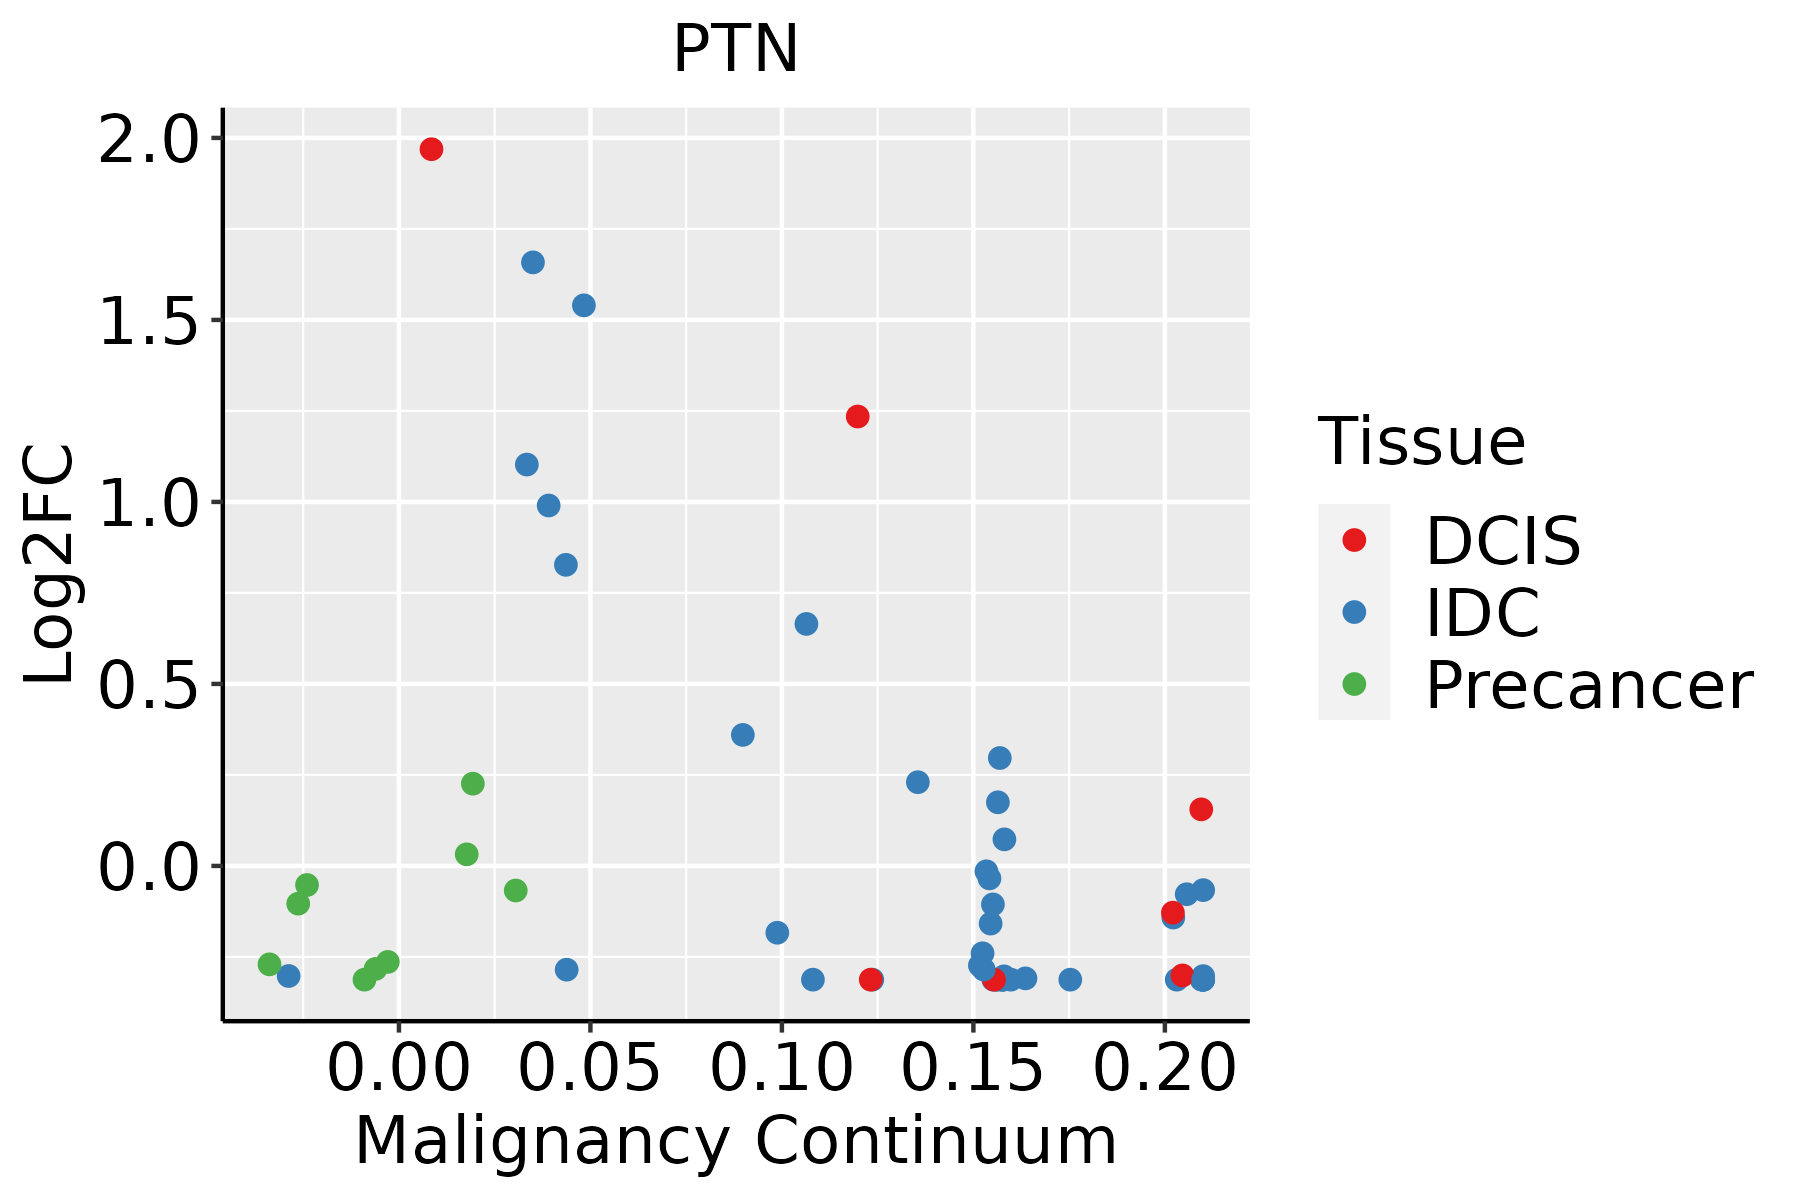 | IDC: Invasive ductal carcinoma |
| DCIS: Ductal carcinoma in situ | ||
| Precancer(BRCA1-mut): Precancerous lesion from BRCA1 mutation carriers | ||
| Endometrium | 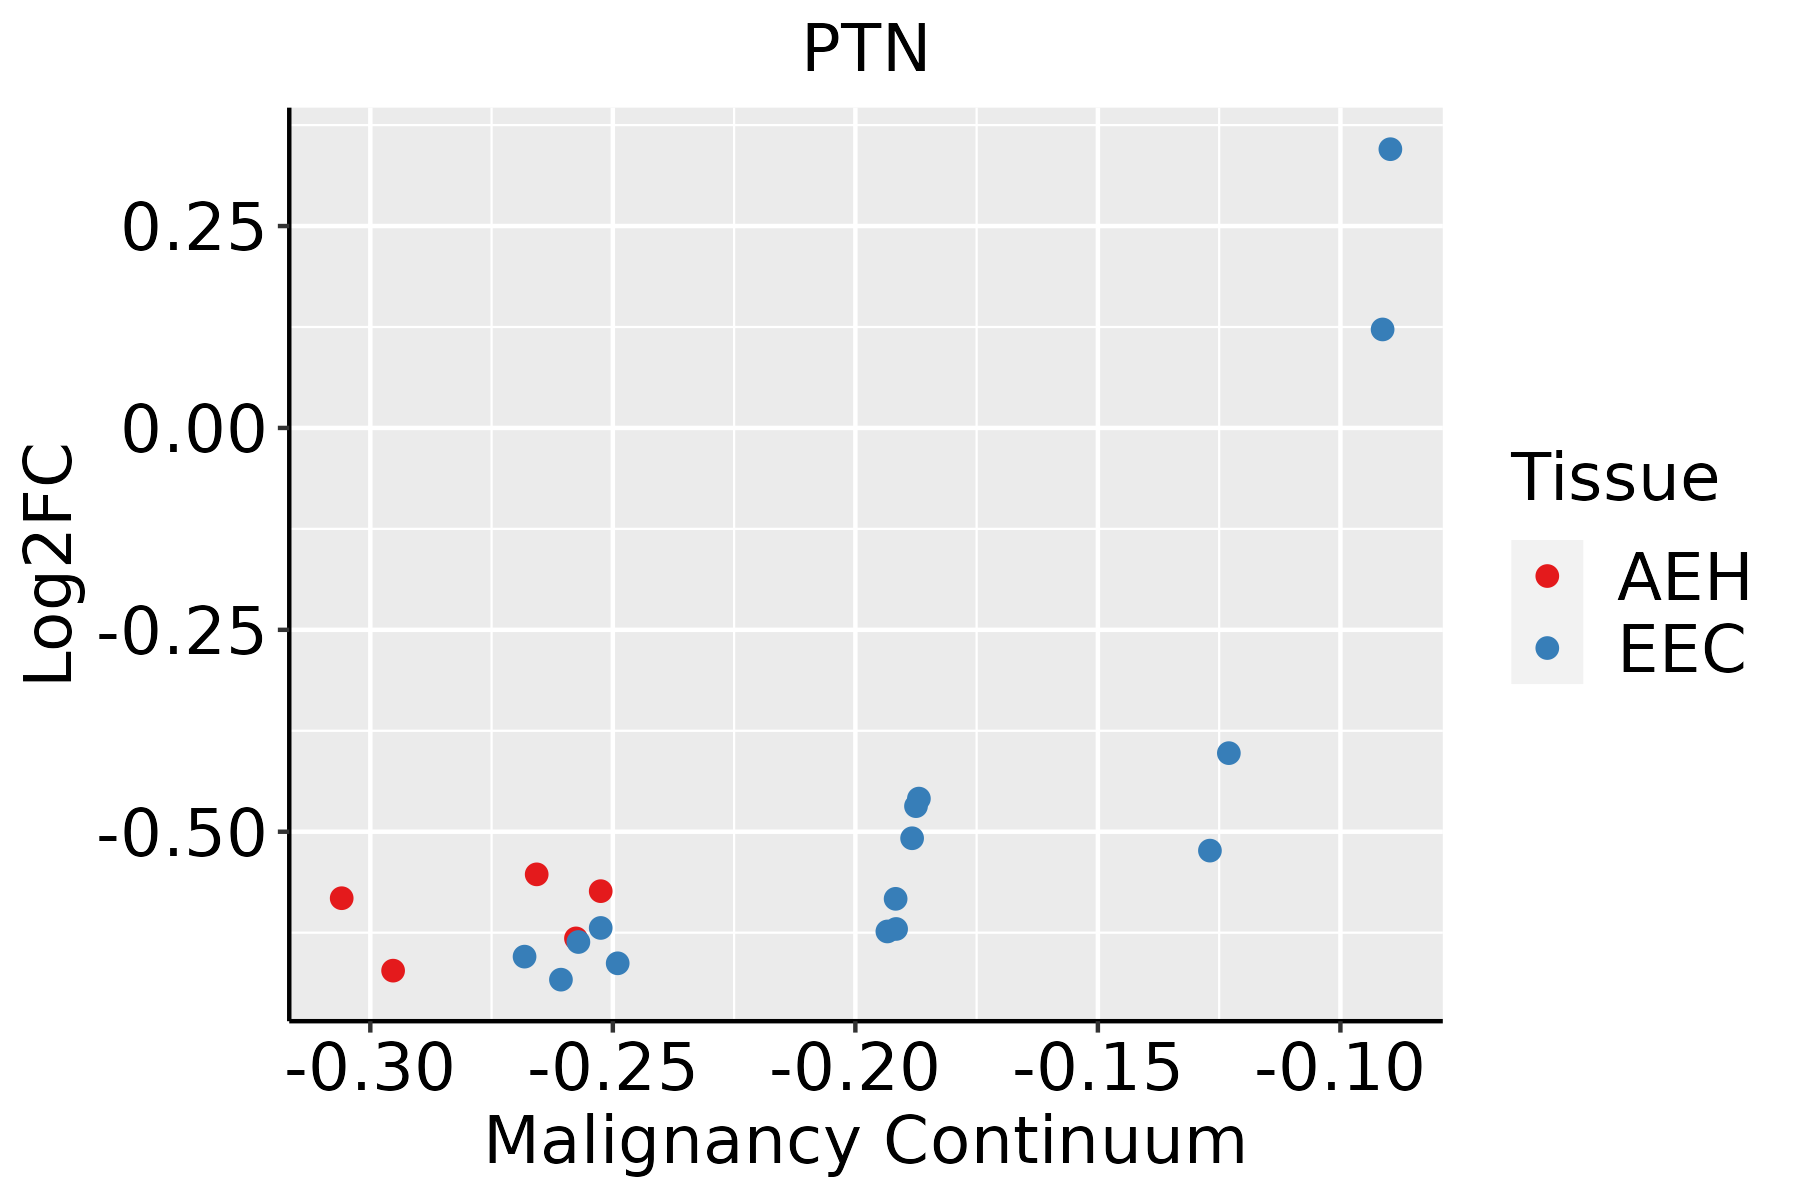 | AEH: Atypical endometrial hyperplasia |
| EEC: Endometrioid Cancer | ||
| Esophagus | 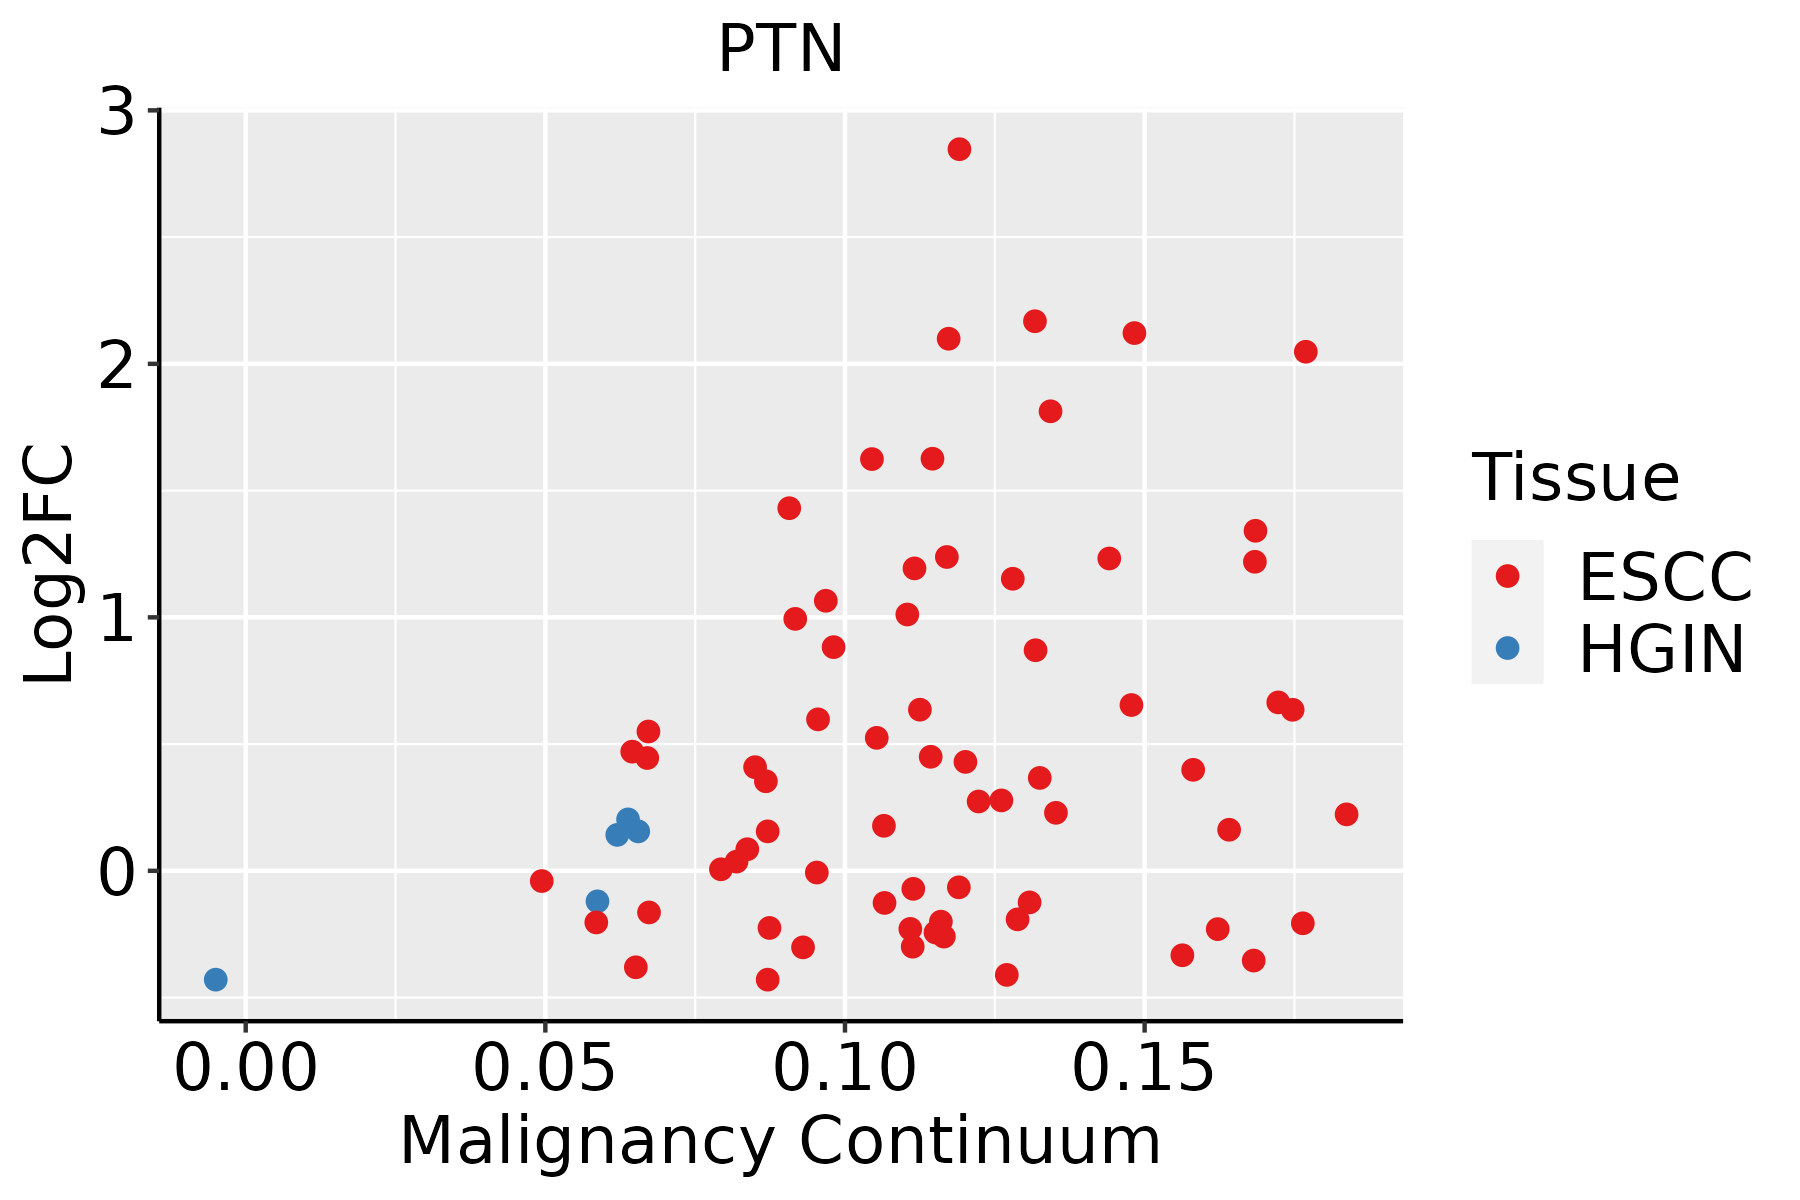 | ESCC: Esophageal squamous cell carcinoma |
| HGIN: High-grade intraepithelial neoplasias | ||
| LGIN: Low-grade intraepithelial neoplasias | ||
| Liver | 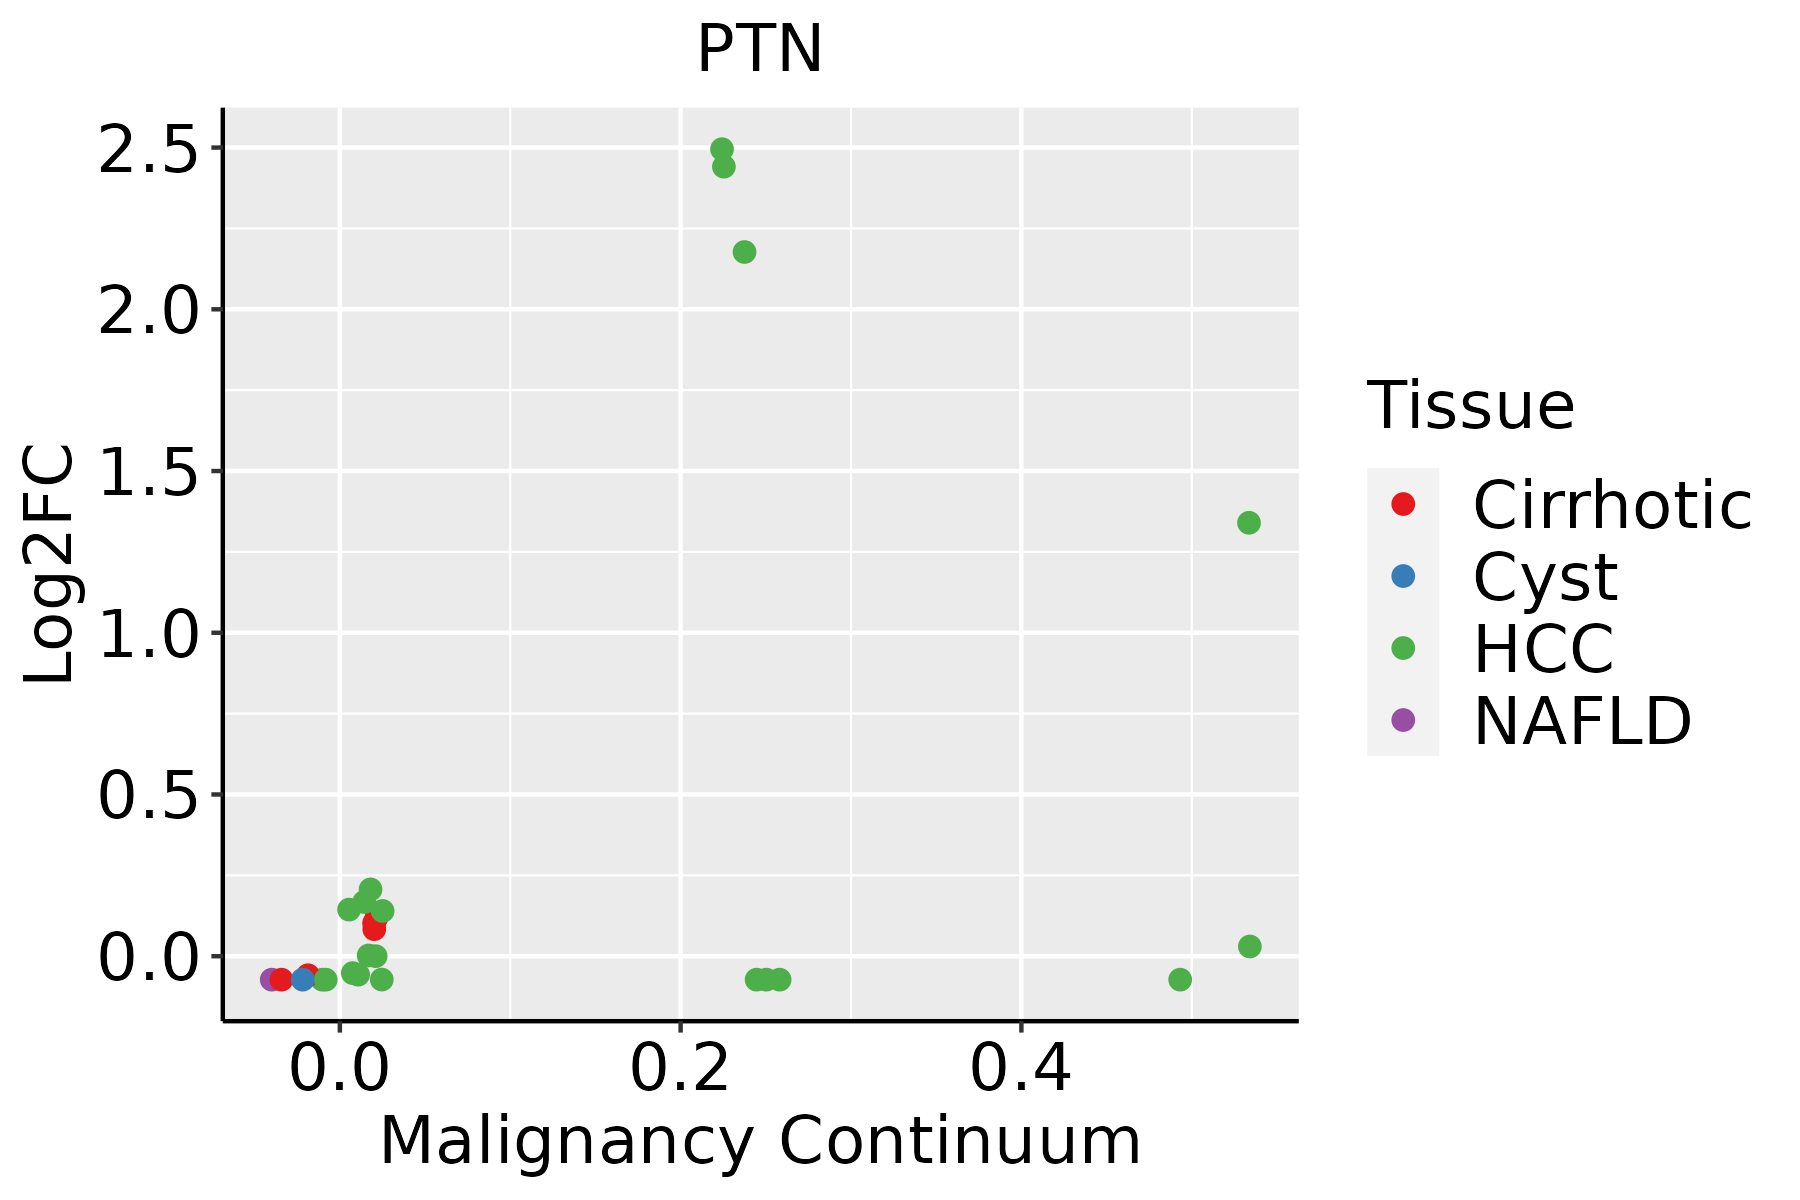 | HCC: Hepatocellular carcinoma |
| NAFLD: Non-alcoholic fatty liver disease | ||
| Oral Cavity | 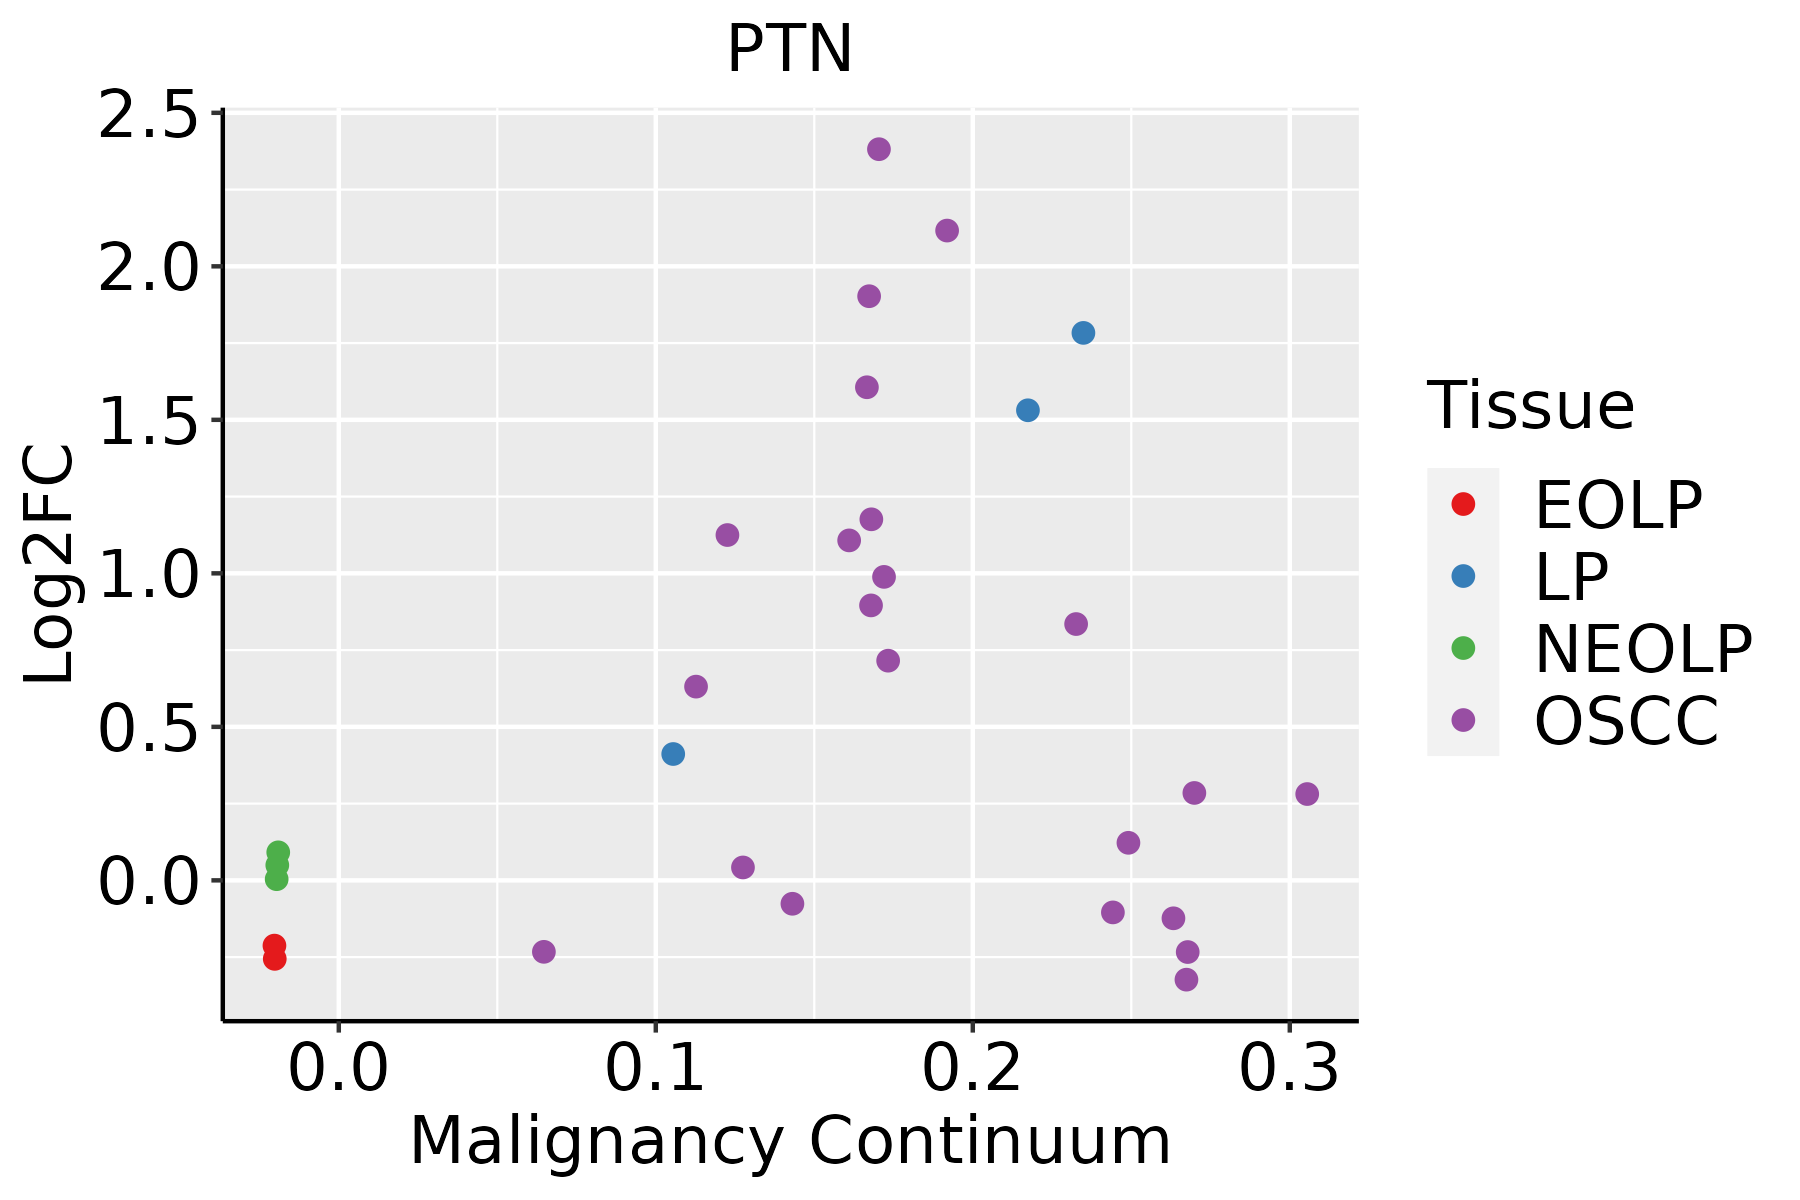 | EOLP: Erosive Oral lichen planus |
| LP: leukoplakia | ||
| NEOLP: Non-erosive oral lichen planus | ||
| OSCC: Oral squamous cell carcinoma | ||
| Thyroid | 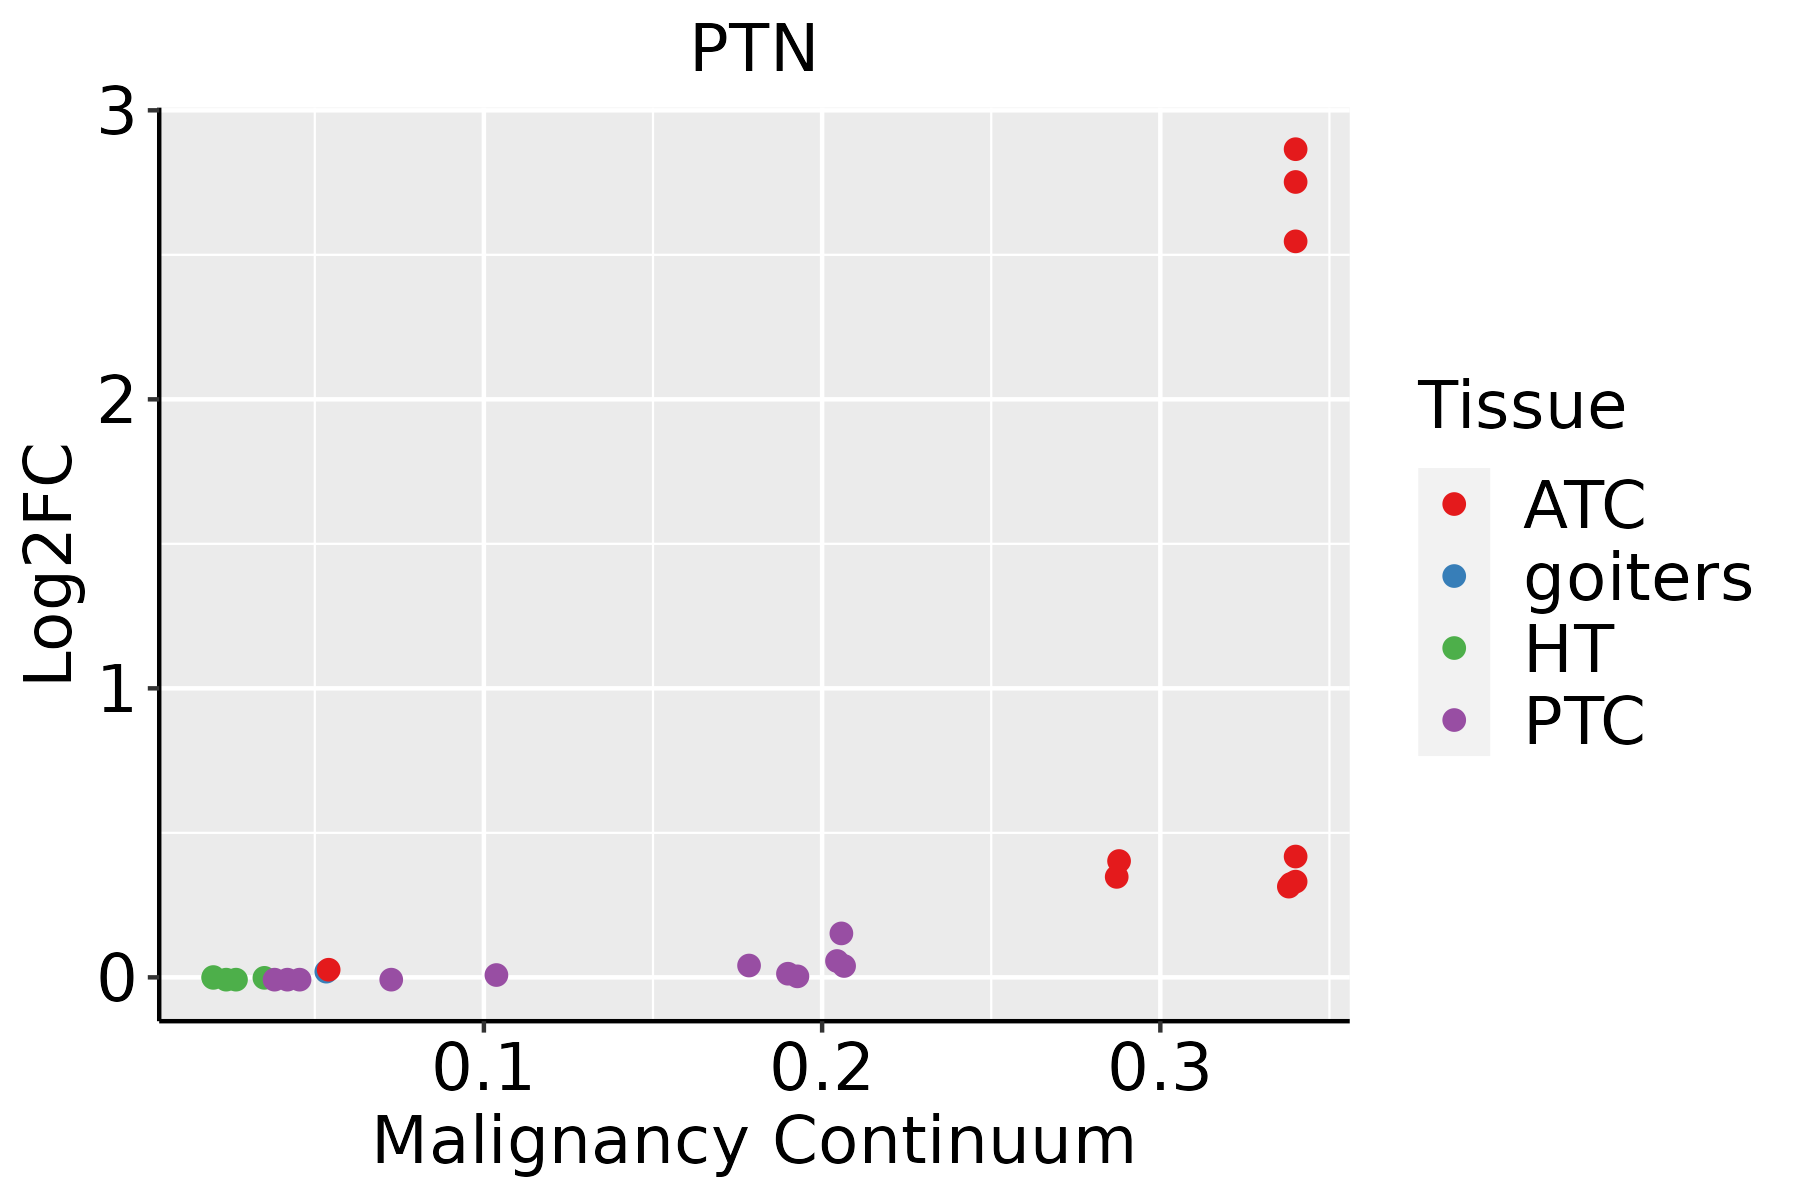 | ATC: Anaplastic thyroid cancer |
| HT: Hashimoto's thyroiditis | ||
| PTC: Papillary thyroid cancer |
| ∗log2FC in expression of this searched gene in stem-like cells from each diseased tissue sample relative to stem-like cells in normal samples in each tissue plotted against the malignancy continuum. Samples are colored based on if they are from different disease stage. |
Top |
Malignant transformation related pathway analysis |
| Find out the enriched GO biological processes and KEGG pathways involved in transition from healthy to precancer to cancer |
| Tissue | Disease Stage | Enriched GO biological Processes |
| Colorectum | AD |  |
| Colorectum | SER |  |
| Colorectum | MSS |  |
| Colorectum | MSI-H |  |
| Colorectum | FAP |  |
| ∗Top 15 enriched GO BP terms are showed in the bar plot of each disease state in each tissue. Each row represents a significant GO biological process which is colored according to the -log10(p.adjust). |
| Page: 1 2 3 4 5 6 7 8 9 |
| GO ID | Tissue | Disease Stage | Description | Gene Ratio | Bg Ratio | pvalue | p.adjust | Count |
| GO:004854514 | Breast | IDC | response to steroid hormone | 70/1434 | 339/18723 | 1.34e-14 | 4.23e-12 | 70 |
| GO:007048214 | Breast | IDC | response to oxygen levels | 64/1434 | 347/18723 | 3.45e-11 | 5.57e-09 | 64 |
| GO:003629314 | Breast | IDC | response to decreased oxygen levels | 60/1434 | 322/18723 | 9.26e-11 | 1.25e-08 | 60 |
| GO:000166614 | Breast | IDC | response to hypoxia | 58/1434 | 307/18723 | 1.09e-10 | 1.38e-08 | 58 |
| GO:000756511 | Breast | IDC | female pregnancy | 39/1434 | 193/18723 | 1.81e-08 | 1.27e-06 | 39 |
| GO:003629413 | Breast | IDC | cellular response to decreased oxygen levels | 34/1434 | 161/18723 | 4.73e-08 | 3.02e-06 | 34 |
| GO:00447061 | Breast | IDC | multi-multicellular organism process | 41/1434 | 220/18723 | 8.58e-08 | 5.19e-06 | 41 |
| GO:007145613 | Breast | IDC | cellular response to hypoxia | 32/1434 | 151/18723 | 1.07e-07 | 6.26e-06 | 32 |
| GO:007145313 | Breast | IDC | cellular response to oxygen levels | 35/1434 | 177/18723 | 1.68e-07 | 9.10e-06 | 35 |
| GO:004873214 | Breast | IDC | gland development | 64/1434 | 436/18723 | 3.47e-07 | 1.74e-05 | 64 |
| GO:004578514 | Breast | IDC | positive regulation of cell adhesion | 62/1434 | 437/18723 | 1.70e-06 | 7.16e-05 | 62 |
| GO:004860812 | Breast | IDC | reproductive structure development | 60/1434 | 424/18723 | 2.71e-06 | 1.03e-04 | 60 |
| GO:005090011 | Breast | IDC | leukocyte migration | 54/1434 | 369/18723 | 3.10e-06 | 1.15e-04 | 54 |
| GO:006145813 | Breast | IDC | reproductive system development | 60/1434 | 427/18723 | 3.41e-06 | 1.24e-04 | 60 |
| GO:003059511 | Breast | IDC | leukocyte chemotaxis | 38/1434 | 230/18723 | 5.36e-06 | 1.76e-04 | 38 |
| GO:000166714 | Breast | IDC | ameboidal-type cell migration | 64/1434 | 475/18723 | 6.65e-06 | 2.05e-04 | 64 |
| GO:000931412 | Breast | IDC | response to radiation | 62/1434 | 456/18723 | 6.91e-06 | 2.10e-04 | 62 |
| GO:005067313 | Breast | IDC | epithelial cell proliferation | 60/1434 | 437/18723 | 7.13e-06 | 2.15e-04 | 60 |
| GO:003235512 | Breast | IDC | response to estradiol | 27/1434 | 141/18723 | 7.87e-06 | 2.35e-04 | 27 |
| GO:005067812 | Breast | IDC | regulation of epithelial cell proliferation | 54/1434 | 381/18723 | 8.07e-06 | 2.39e-04 | 54 |
| Page: 1 2 3 4 5 6 7 8 9 10 11 12 13 14 15 16 17 18 19 20 21 22 23 24 25 26 27 28 29 30 31 32 33 34 35 36 37 38 39 40 41 42 43 44 45 46 47 48 49 50 51 52 53 54 55 56 57 58 59 60 61 62 63 64 65 66 67 68 69 70 71 72 73 74 75 76 77 78 |
| Pathway ID | Tissue | Disease Stage | Description | Gene Ratio | Bg Ratio | pvalue | p.adjust | qvalue | Count |
| Page: 1 |
Top |
Cell-cell communication analysis |
| Identification of potential cell-cell interactions between two cell types and their ligand-receptor pairs for different disease states |
| Ligand | Receptor | LRpair | Pathway | Tissue | Disease Stage |
| PTN | SDC1 | PTN_SDC1 | PTN | Breast | DCIS |
| PTN | SDC2 | PTN_SDC2 | PTN | Breast | DCIS |
| PTN | SDC3 | PTN_SDC3 | PTN | Breast | DCIS |
| PTN | SDC4 | PTN_SDC4 | PTN | Breast | DCIS |
| PTN | NCL | PTN_NCL | PTN | Breast | DCIS |
| PTN | SDC1 | PTN_SDC1 | PTN | Breast | Healthy |
| PTN | SDC2 | PTN_SDC2 | PTN | Breast | Healthy |
| PTN | SDC4 | PTN_SDC4 | PTN | Breast | Healthy |
| PTN | NCL | PTN_NCL | PTN | Breast | Healthy |
| PTN | SDC1 | PTN_SDC1 | PTN | Cervix | ADJ |
| PTN | SDC2 | PTN_SDC2 | PTN | Cervix | ADJ |
| PTN | SDC4 | PTN_SDC4 | PTN | Cervix | ADJ |
| PTN | NCL | PTN_NCL | PTN | Cervix | ADJ |
| PTN | PTPRZ1 | PTN_PTPRZ1 | PTN | Cervix | CC |
| PTN | SDC1 | PTN_SDC1 | PTN | Cervix | CC |
| PTN | SDC2 | PTN_SDC2 | PTN | Cervix | CC |
| PTN | SDC3 | PTN_SDC3 | PTN | Cervix | CC |
| PTN | SDC4 | PTN_SDC4 | PTN | Cervix | CC |
| PTN | NCL | PTN_NCL | PTN | Cervix | CC |
| PTN | SDC1 | PTN_SDC1 | PTN | Cervix | Precancer |
| Page: 1 2 3 4 5 6 7 8 |
Top |
Single-cell gene regulatory network inference analysis |
| Find out the significant the regulons (TFs) and the target genes of each regulon across cell types for different disease states |
| TF | Cell Type | Tissue | Disease Stage | Target Gene | RSS | Regulon Activity |
| ∗The dot plots of a searched regulon are shown for all cell subpopulations in each disease state of each tissue based on the regulon specific score inferred using pySCENIC and by calculating the average expression. |
| Page: 1 |
Top |
Somatic mutation of malignant transformation related genes |
| Annotation of somatic variants for genes involved in malignant transformation |
| Hugo Symbol | Variant Class | Variant Classification | dbSNP RS | HGVSc | HGVSp | HGVSp Short | SWISSPROT | BIOTYPE | SIFT | PolyPhen | Tumor Sample Barcode | Tissue | Histology | Sex | Age | Stage | Therapy Types | Drugs | Outcome |
| PTN | SNV | Missense_Mutation | c.51N>A | p.Phe17Leu | p.F17L | P21246 | protein_coding | tolerated(0.72) | benign(0) | TCGA-AN-A0AK-01 | Breast | breast invasive carcinoma | Female | >=65 | I/II | Unknown | Unknown | SD | |
| PTN | SNV | Missense_Mutation | rs559496875 | c.388G>A | p.Glu130Lys | p.E130K | P21246 | protein_coding | deleterious(0.03) | benign(0.18) | TCGA-BH-A2L8-01 | Breast | breast invasive carcinoma | Female | <65 | I/II | Chemotherapy | cytoxan | CR |
| PTN | SNV | Missense_Mutation | rs760057615 | c.413C>T | p.Ser138Phe | p.S138F | P21246 | protein_coding | deleterious(0) | probably_damaging(0.939) | TCGA-C8-A8HP-01 | Breast | breast invasive carcinoma | Female | <65 | III/IV | Chemotherapy | 5-fluorouracil | CR |
| PTN | SNV | Missense_Mutation | novel | c.157N>T | p.Ser53Cys | p.S53C | P21246 | protein_coding | deleterious(0.05) | probably_damaging(0.985) | TCGA-DS-A1OC-01 | Cervix | cervical & endocervical cancer | Female | <65 | I/II | Chemotherapy | gemcitabine | SD |
| PTN | insertion | Frame_Shift_Ins | novel | c.155_156insTGTGTGTGTGTGTGTGTGTGTGT | p.Trp52CysfsTer9 | p.W52Cfs*9 | P21246 | protein_coding | TCGA-DS-A1OC-01 | Cervix | cervical & endocervical cancer | Female | <65 | I/II | Chemotherapy | gemcitabine | SD | ||
| PTN | SNV | Missense_Mutation | c.340N>T | p.Ala114Ser | p.A114S | P21246 | protein_coding | tolerated(0.06) | benign(0.203) | TCGA-A6-5657-01 | Colorectum | colon adenocarcinoma | Male | >=65 | III/IV | Ancillary | leucovorin | SD | |
| PTN | SNV | Missense_Mutation | c.438G>T | p.Lys146Asn | p.K146N | P21246 | protein_coding | tolerated(0.11) | probably_damaging(0.995) | TCGA-AA-3821-01 | Colorectum | colon adenocarcinoma | Female | >=65 | I/II | Unknown | Unknown | SD | |
| PTN | SNV | Missense_Mutation | c.160N>T | p.Val54Leu | p.V54L | P21246 | protein_coding | tolerated(0.29) | possibly_damaging(0.825) | TCGA-AA-3986-01 | Colorectum | colon adenocarcinoma | Male | >=65 | I/II | Unknown | Unknown | SD | |
| PTN | SNV | Missense_Mutation | c.454G>A | p.Glu152Lys | p.E152K | P21246 | protein_coding | tolerated(0.59) | probably_damaging(0.973) | TCGA-AG-A002-01 | Colorectum | rectum adenocarcinoma | Male | <65 | I/II | Unknown | Unknown | SD | |
| PTN | SNV | Missense_Mutation | c.359N>T | p.Gly120Val | p.G120V | P21246 | protein_coding | deleterious(0) | possibly_damaging(0.903) | TCGA-AG-A02G-01 | Colorectum | rectum adenocarcinoma | Male | >=65 | III/IV | Chemotherapy | folinic | PD |
| Page: 1 2 3 4 5 |
Top |
Related drugs of malignant transformation related genes |
| Identification of chemicals and drugs interact with genes involved in malignant transfromation |
| (DGIdb 4.0) |
| Entrez ID | Symbol | Category | Interaction Types | Drug Claim Name | Drug Name | PMIDs |
| Page: 1 |

Copyright 2023-Present -The University of Texas Health Science Center at Houston |