
|
|||||
|
 | |
| |
| |
| |
| |
| |
|
Gene: PTMA |
Gene summary for PTMA |
| Gene information | Species | Human | Gene symbol | PTMA | Gene ID | 5757 |
| Gene name | prothymosin alpha | |
| Gene Alias | TMSA | |
| Cytomap | 2q37.1 | |
| Gene Type | protein-coding | GO ID | GO:0006139 | UniProtAcc | P06454 |
Top |
Malignant transformation analysis |
| Identification of the aberrant gene expression in precancerous and cancerous lesions by comparing the gene expression of stem-like cells in diseased tissues with normal stem cells |
| Entrez ID | Symbol | Replicates | Species | Organ | Tissue | Adj P-value | Log2FC | Malignancy |
| 5757 | PTMA | CCI_1 | Human | Cervix | CC | 4.18e-55 | -1.66e+00 | 0.528 |
| 5757 | PTMA | CCI_2 | Human | Cervix | CC | 9.00e-12 | -3.19e-01 | 0.5249 |
| 5757 | PTMA | CCI_3 | Human | Cervix | CC | 3.40e-30 | -1.05e+00 | 0.516 |
| 5757 | PTMA | CCII_1 | Human | Cervix | CC | 2.35e-106 | -1.80e+00 | 0.3249 |
| 5757 | PTMA | H2 | Human | Cervix | HSIL_HPV | 4.93e-21 | -2.70e-01 | 0.0632 |
| 5757 | PTMA | L1 | Human | Cervix | CC | 5.45e-08 | -2.60e-01 | 0.0802 |
| 5757 | PTMA | T1 | Human | Cervix | CC | 7.66e-22 | -2.52e-01 | 0.0918 |
| 5757 | PTMA | HTA11_3410_2000001011 | Human | Colorectum | AD | 2.41e-47 | 1.19e+00 | 0.0155 |
| 5757 | PTMA | HTA11_2487_2000001011 | Human | Colorectum | SER | 1.50e-26 | 1.47e+00 | -0.1808 |
| 5757 | PTMA | HTA11_2951_2000001011 | Human | Colorectum | AD | 1.34e-10 | 1.16e+00 | 0.0216 |
| 5757 | PTMA | HTA11_1938_2000001011 | Human | Colorectum | AD | 4.02e-39 | 2.03e+00 | -0.0811 |
| 5757 | PTMA | HTA11_78_2000001011 | Human | Colorectum | AD | 3.62e-42 | 1.80e+00 | -0.1088 |
| 5757 | PTMA | HTA11_347_2000001011 | Human | Colorectum | AD | 8.38e-98 | 2.54e+00 | -0.1954 |
| 5757 | PTMA | HTA11_411_2000001011 | Human | Colorectum | SER | 6.85e-19 | 1.97e+00 | -0.2602 |
| 5757 | PTMA | HTA11_2112_2000001011 | Human | Colorectum | SER | 1.55e-05 | 1.58e+00 | -0.2196 |
| 5757 | PTMA | HTA11_3361_2000001011 | Human | Colorectum | AD | 2.47e-18 | 1.80e+00 | -0.1207 |
| 5757 | PTMA | HTA11_83_2000001011 | Human | Colorectum | SER | 1.20e-34 | 2.04e+00 | -0.1526 |
| 5757 | PTMA | HTA11_696_2000001011 | Human | Colorectum | AD | 5.22e-62 | 1.92e+00 | -0.1464 |
| 5757 | PTMA | HTA11_866_2000001011 | Human | Colorectum | AD | 8.44e-54 | 1.70e+00 | -0.1001 |
| 5757 | PTMA | HTA11_1391_2000001011 | Human | Colorectum | AD | 2.60e-47 | 2.61e+00 | -0.059 |
| Page: 1 2 3 4 5 6 7 8 9 10 11 12 13 14 15 16 |
| Tissue | Expression Dynamics | Abbreviation |
| Cervix |  | CC: Cervix cancer |
| HSIL_HPV: HPV-infected high-grade squamous intraepithelial lesions | ||
| N_HPV: HPV-infected normal cervix | ||
| Colorectum (GSE201348) |  | FAP: Familial adenomatous polyposis |
| CRC: Colorectal cancer | ||
| Colorectum (HTA11) |  | AD: Adenomas |
| SER: Sessile serrated lesions | ||
| MSI-H: Microsatellite-high colorectal cancer | ||
| MSS: Microsatellite stable colorectal cancer | ||
| Endometrium | 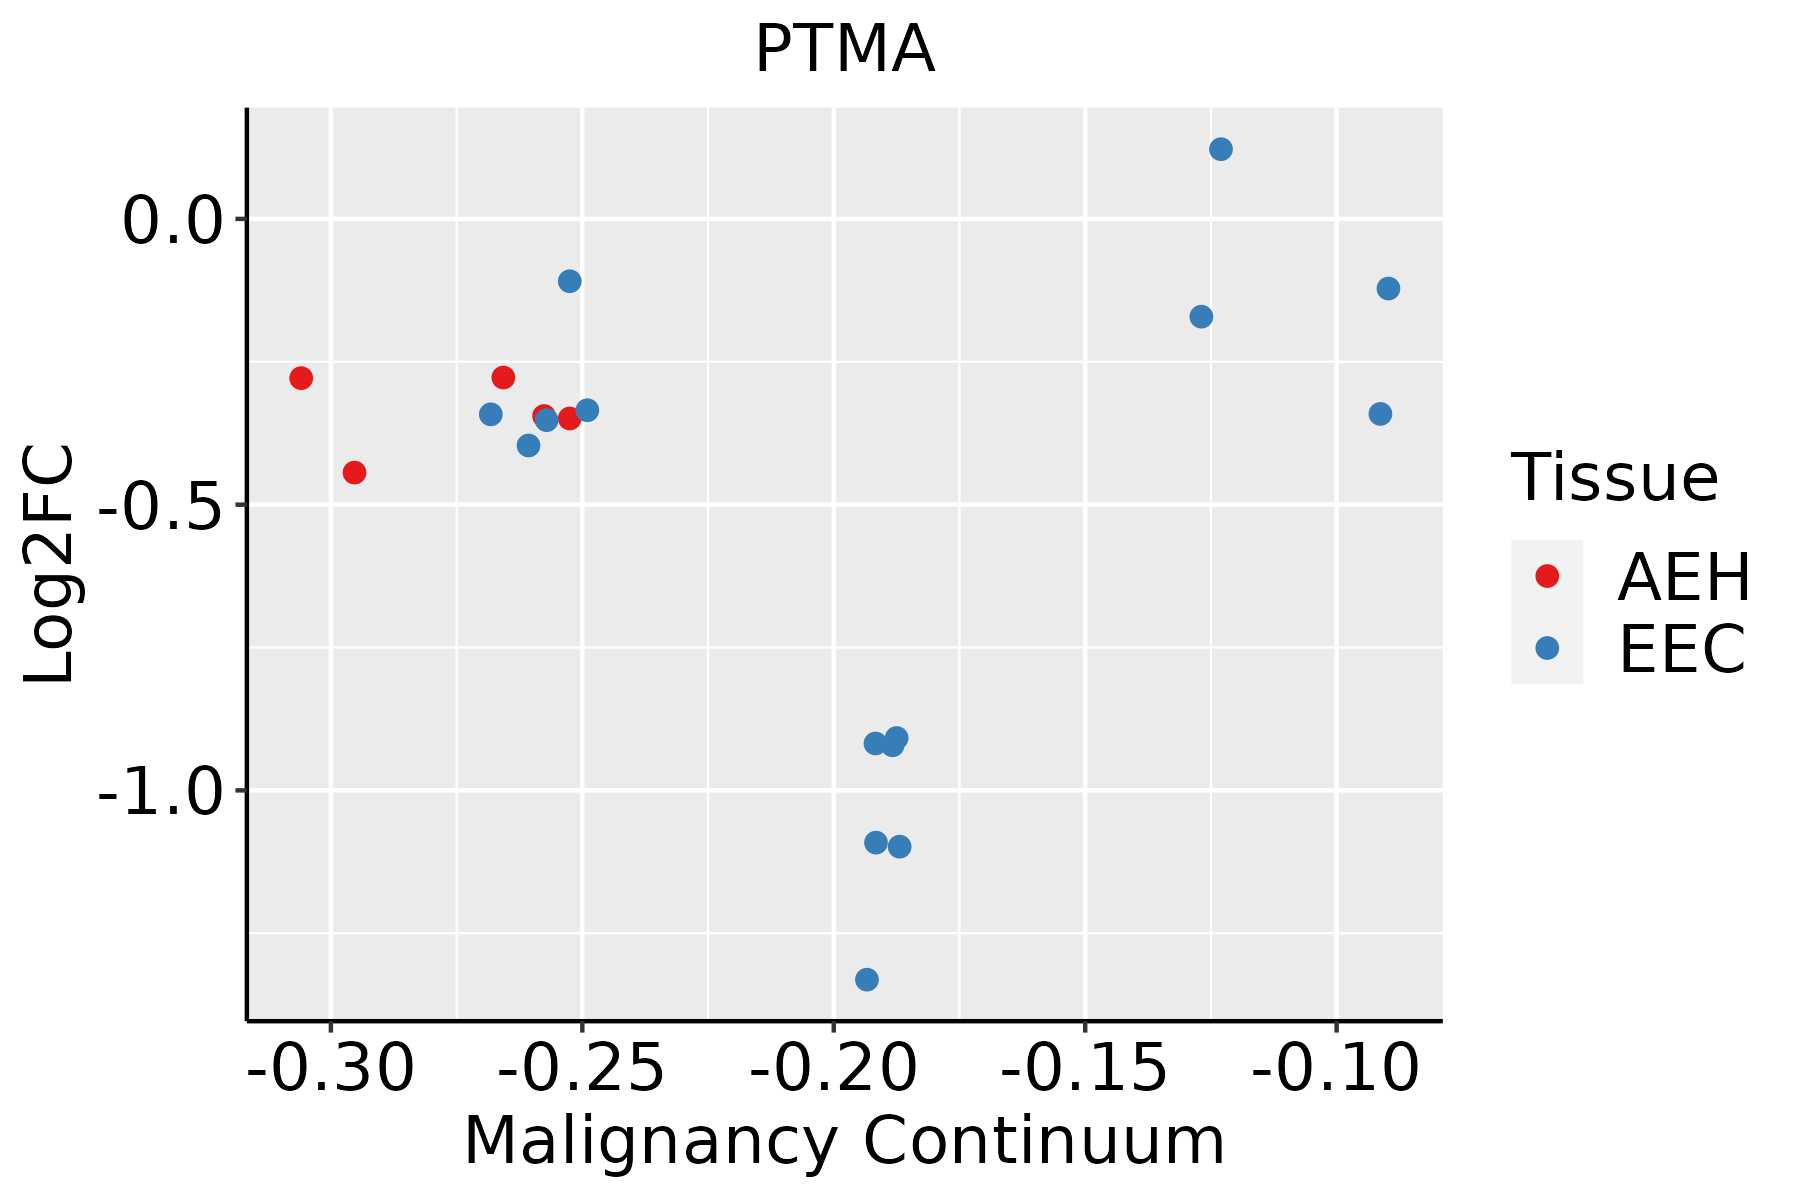 | AEH: Atypical endometrial hyperplasia |
| EEC: Endometrioid Cancer | ||
| Esophagus | 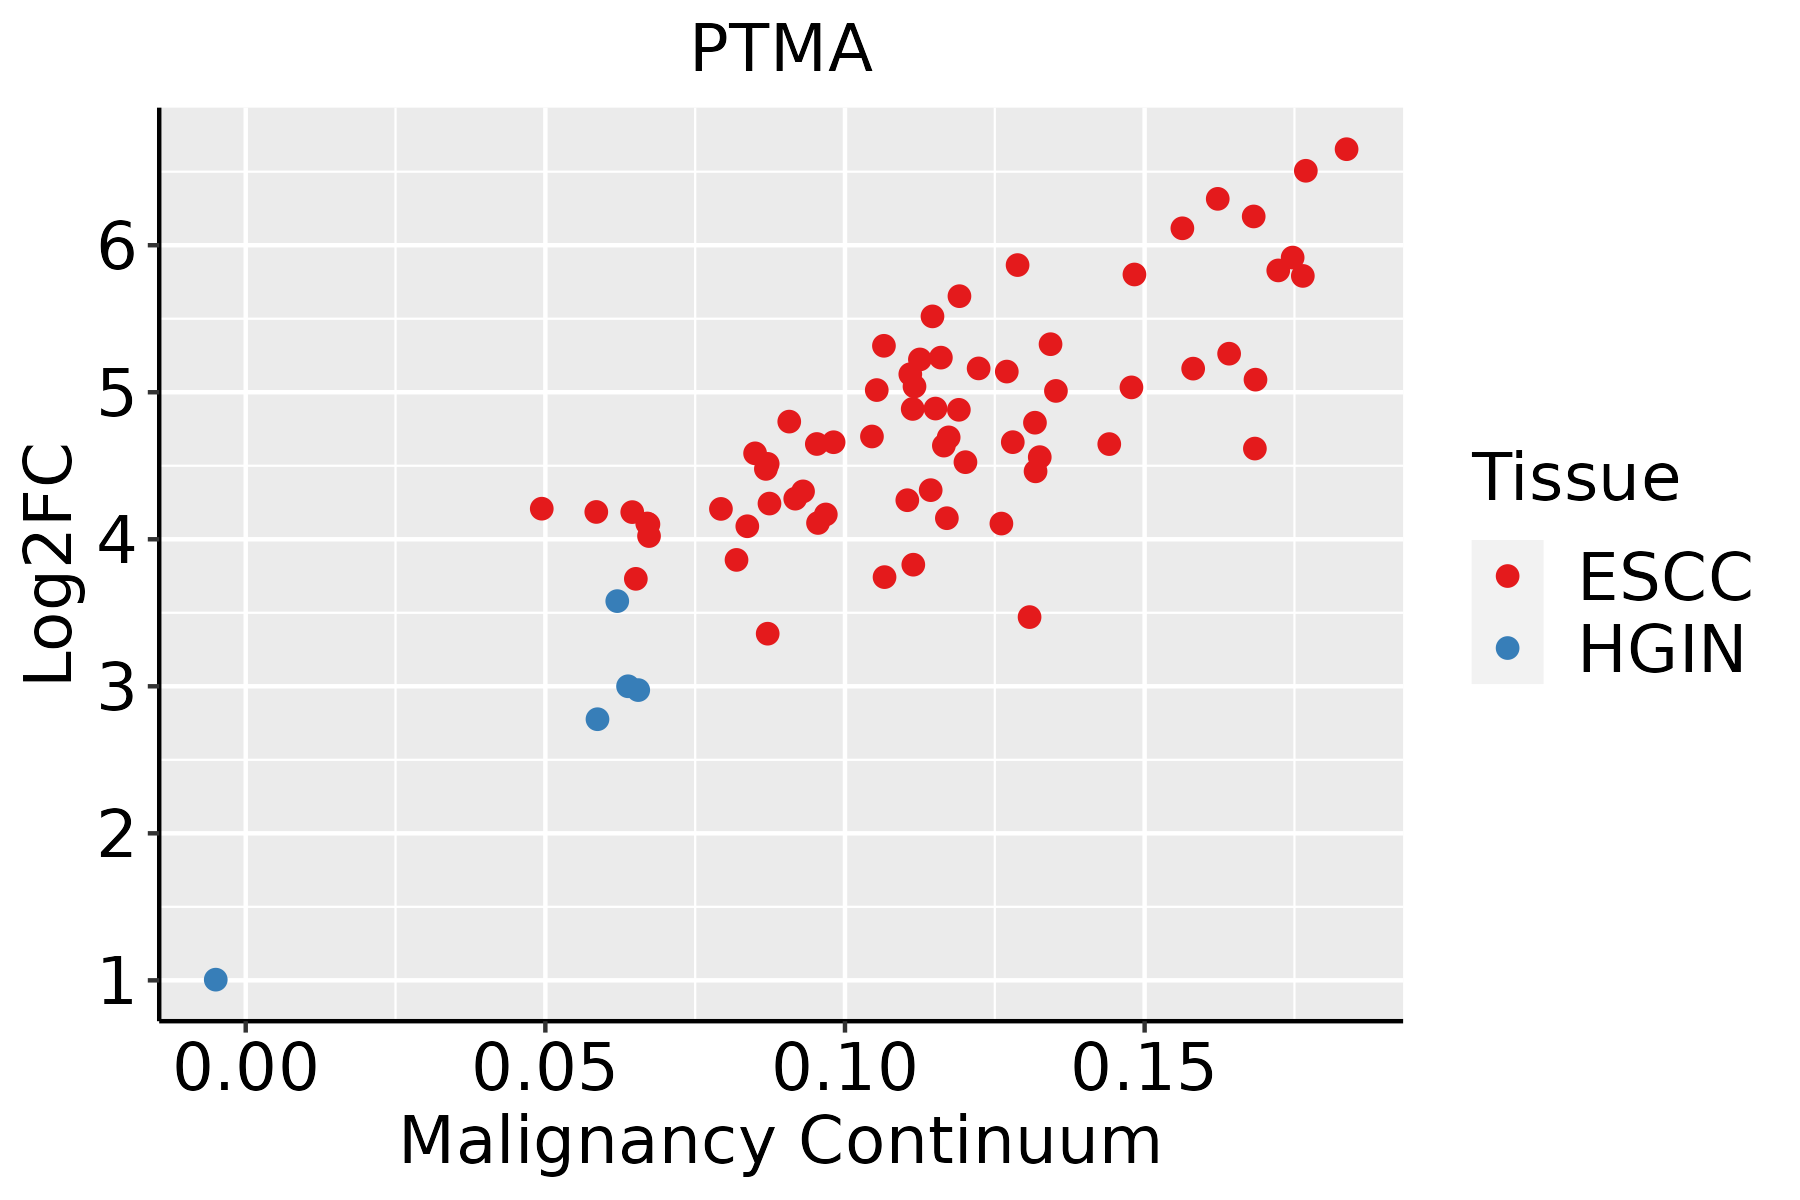 | ESCC: Esophageal squamous cell carcinoma |
| HGIN: High-grade intraepithelial neoplasias | ||
| LGIN: Low-grade intraepithelial neoplasias | ||
| Liver | 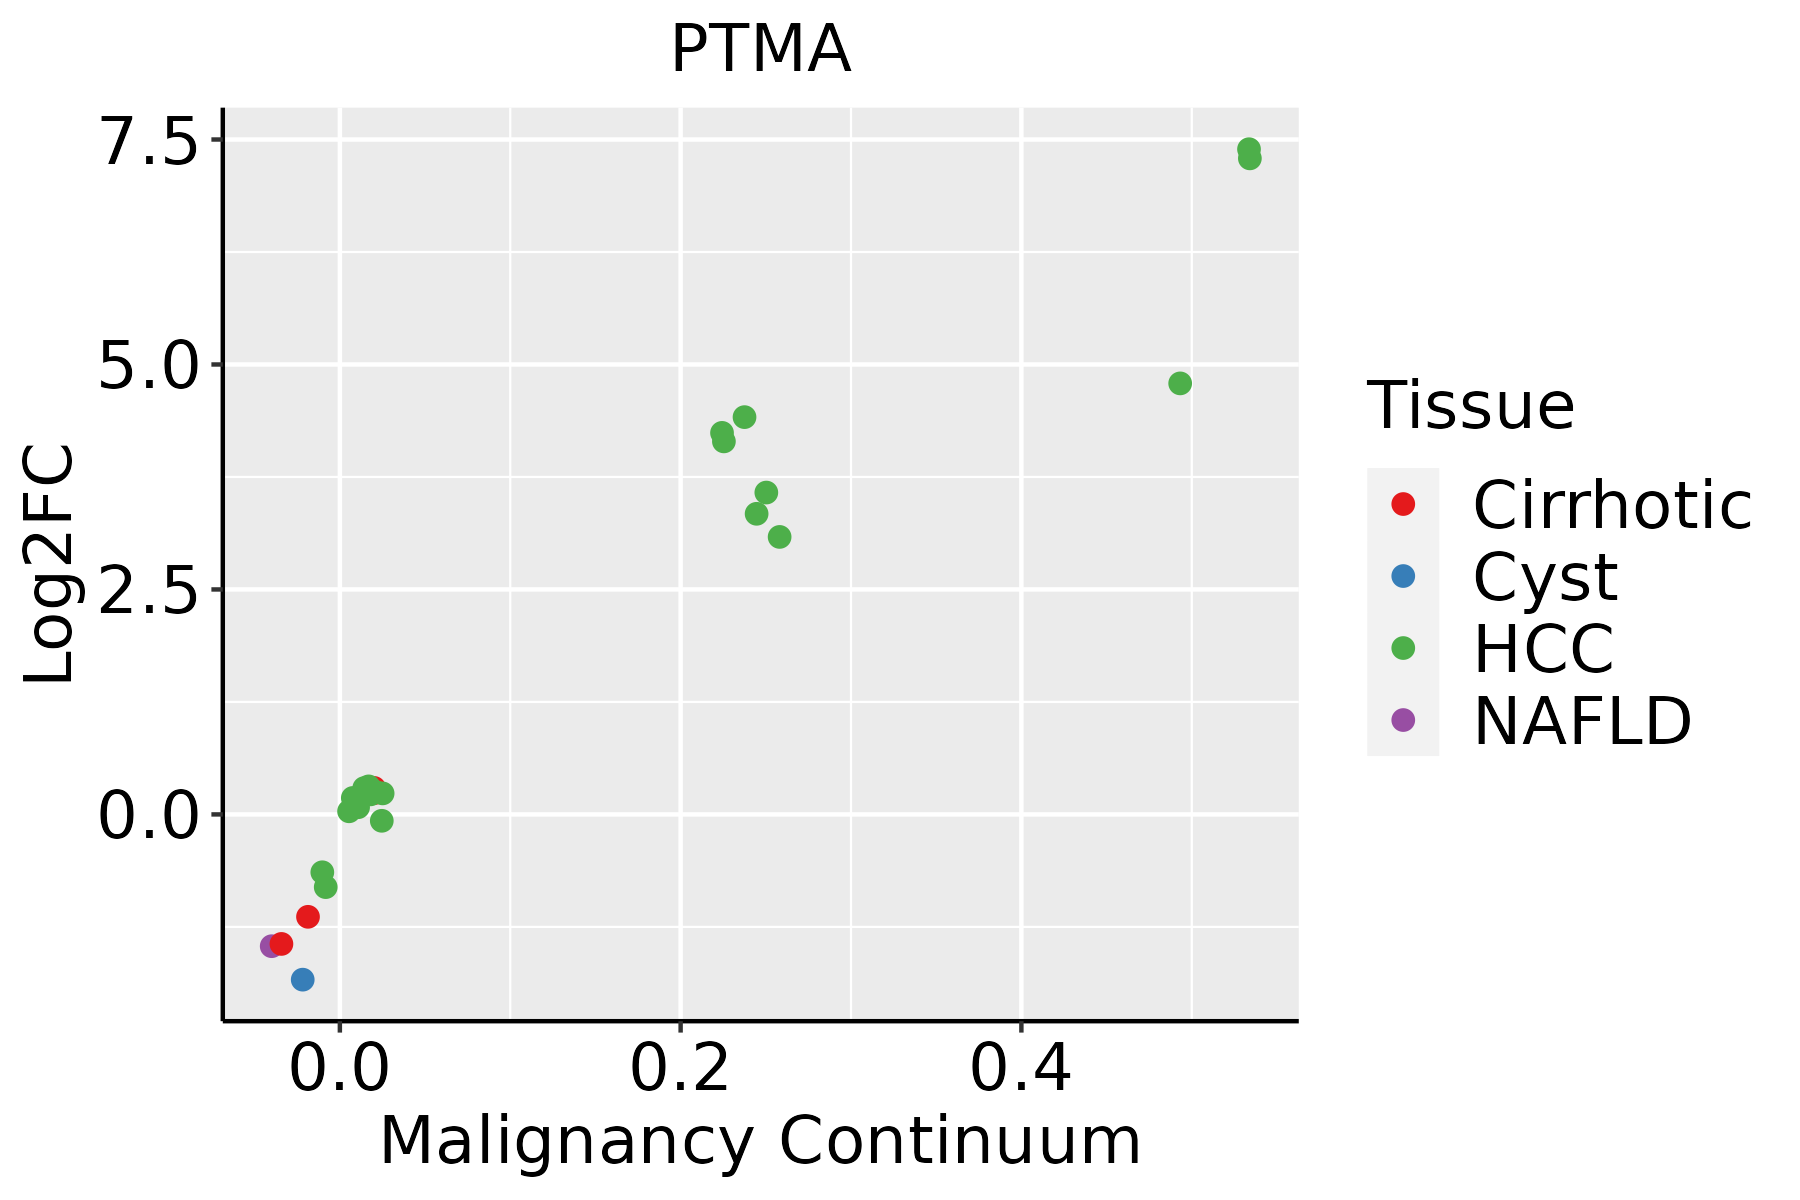 | HCC: Hepatocellular carcinoma |
| NAFLD: Non-alcoholic fatty liver disease | ||
| Oral Cavity |  | EOLP: Erosive Oral lichen planus |
| LP: leukoplakia | ||
| NEOLP: Non-erosive oral lichen planus | ||
| OSCC: Oral squamous cell carcinoma | ||
| Prostate | 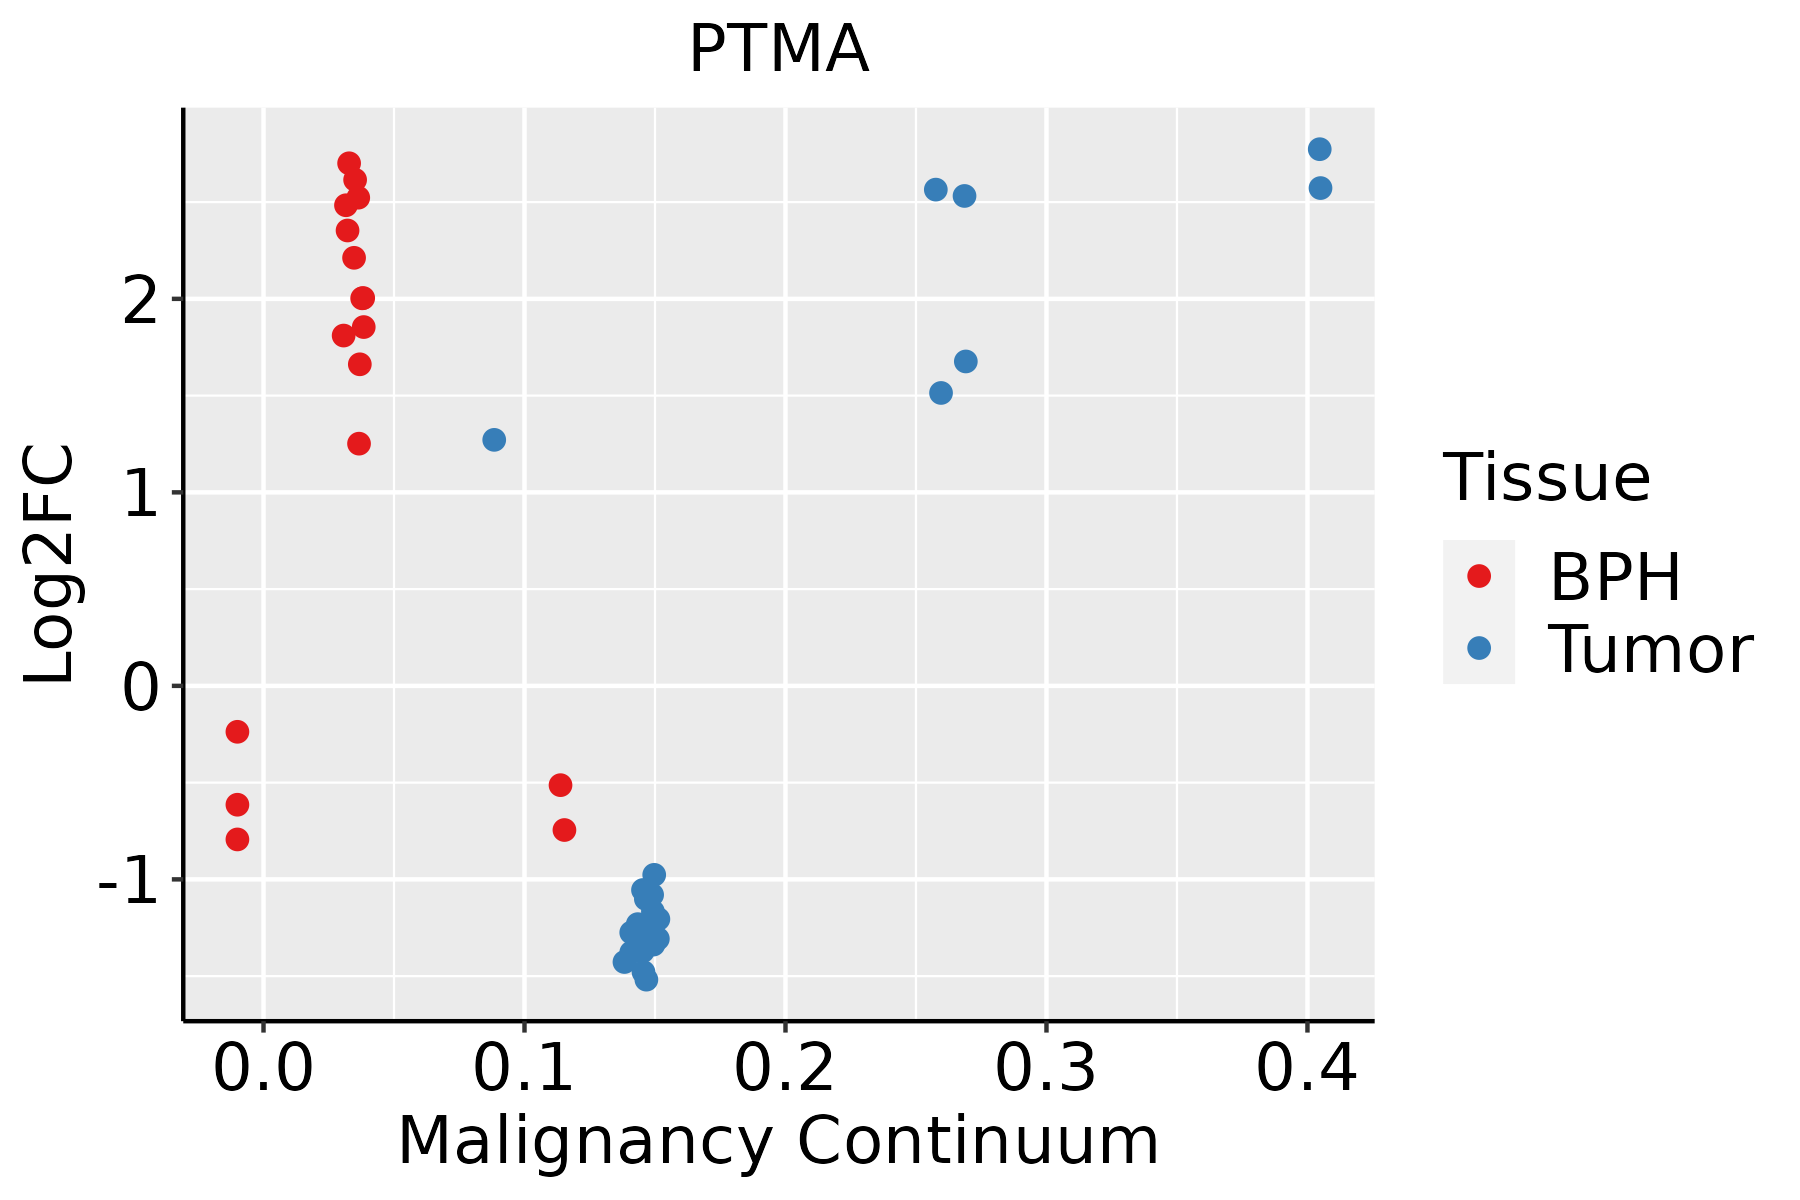 | BPH: Benign Prostatic Hyperplasia |
| Skin | 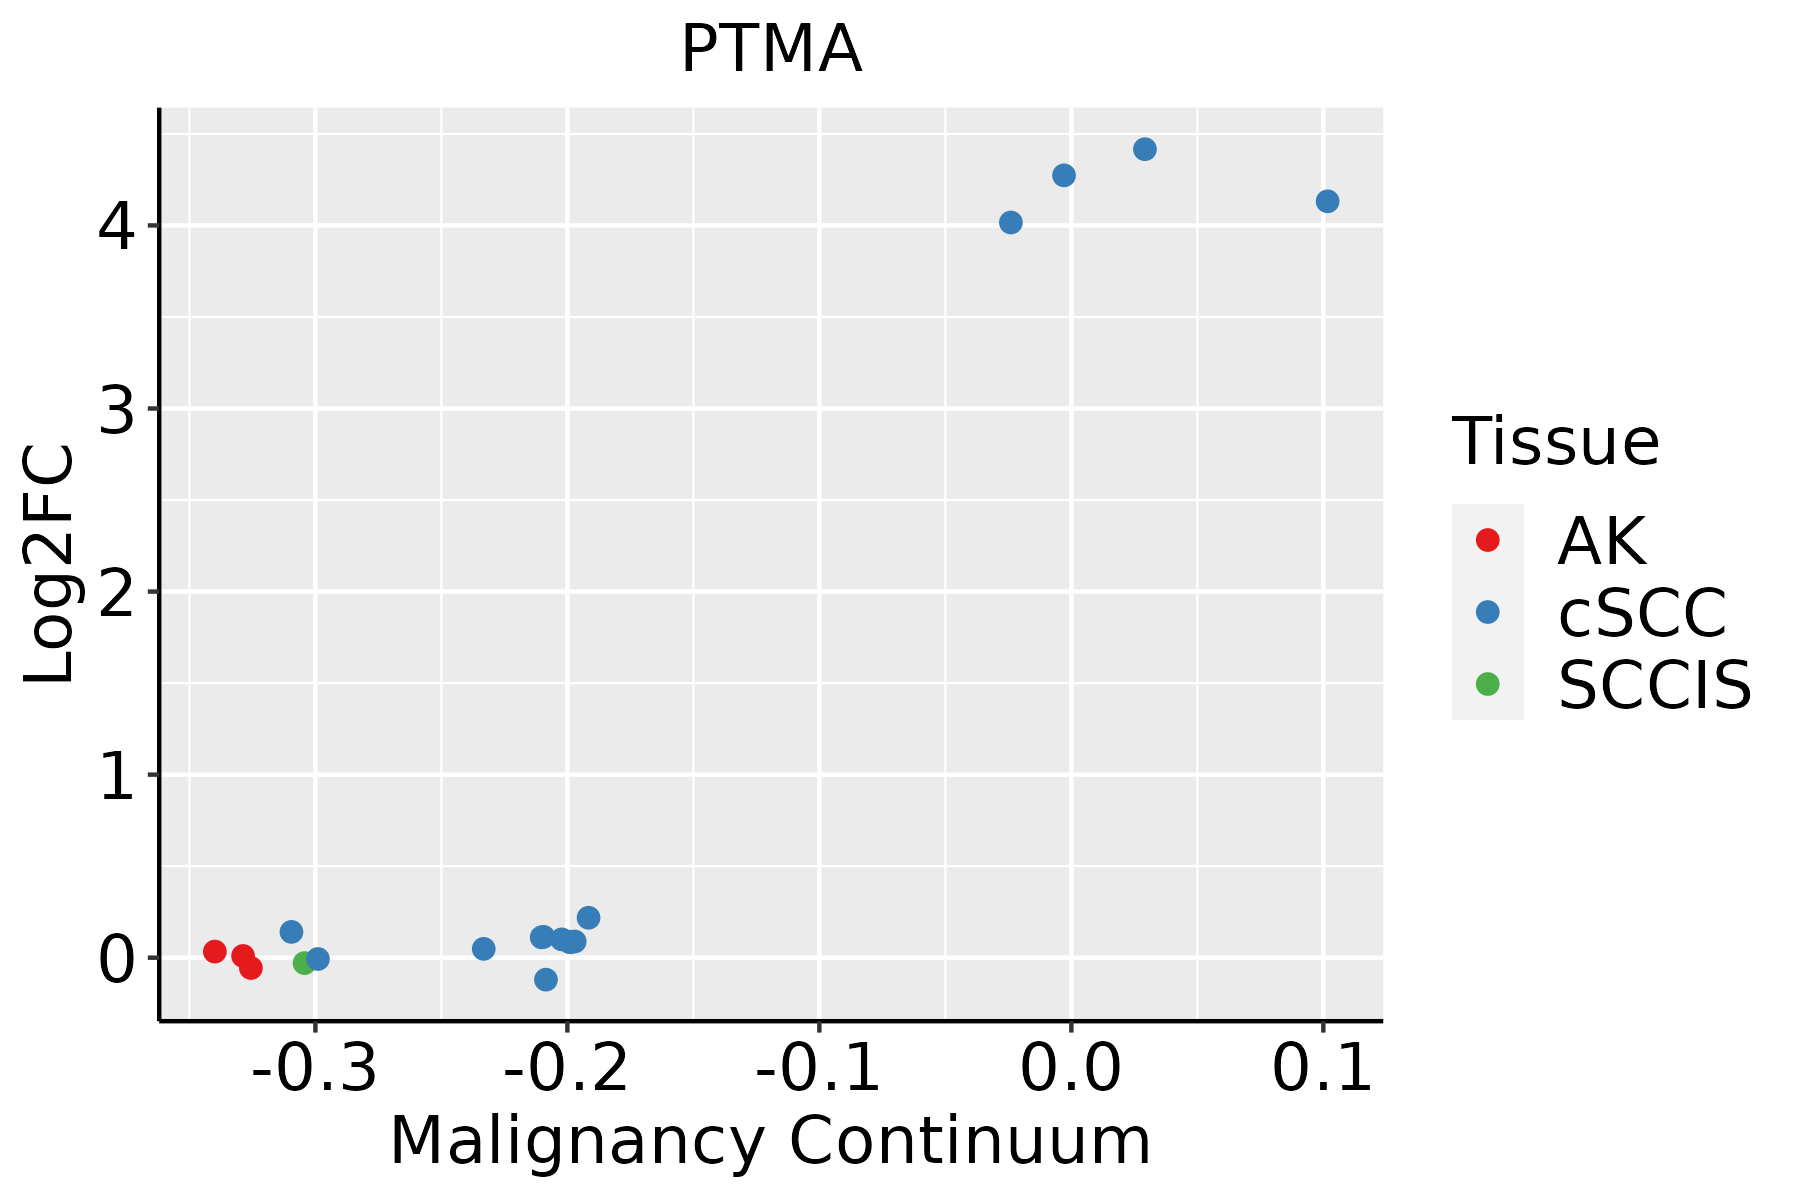 | AK: Actinic keratosis |
| cSCC: Cutaneous squamous cell carcinoma | ||
| SCCIS:squamous cell carcinoma in situ | ||
| Thyroid | 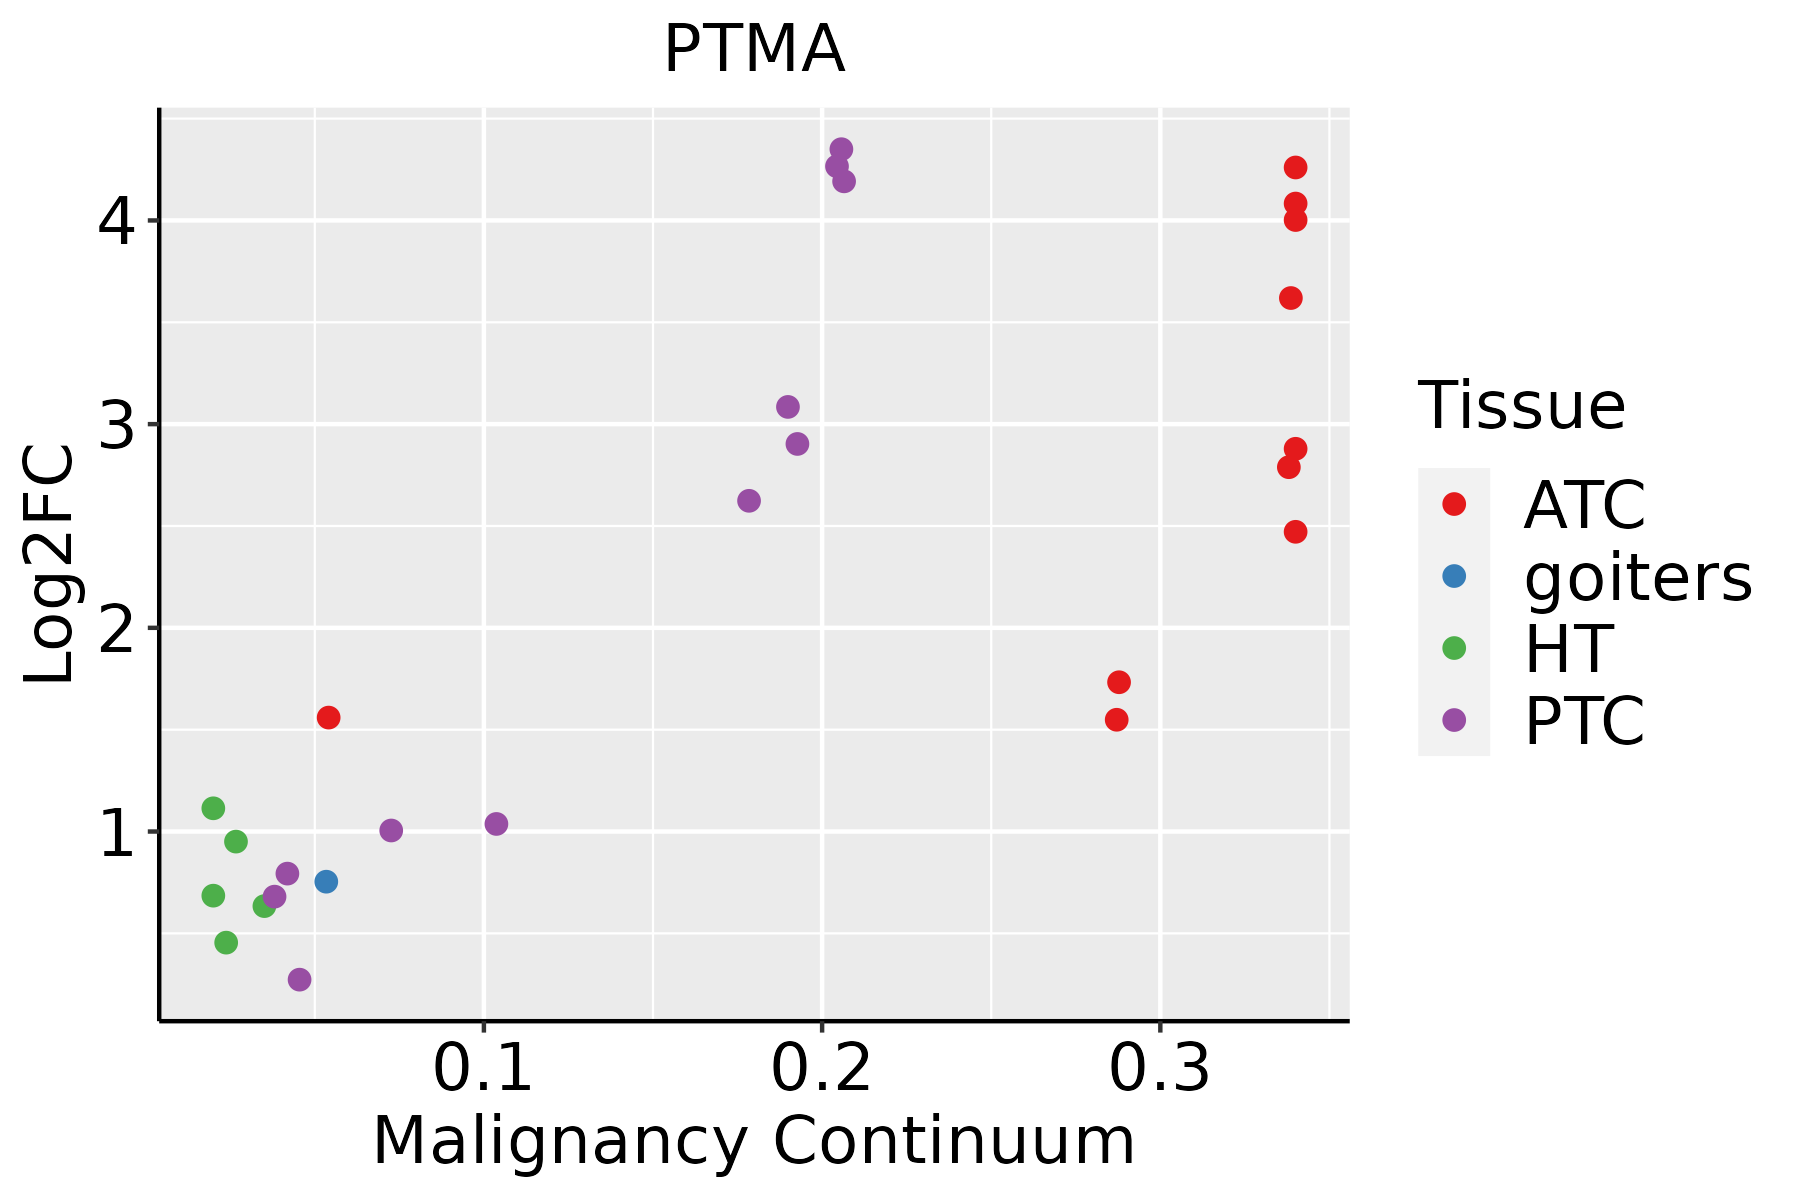 | ATC: Anaplastic thyroid cancer |
| HT: Hashimoto's thyroiditis | ||
| PTC: Papillary thyroid cancer |
| ∗log2FC in expression of this searched gene in stem-like cells from each diseased tissue sample relative to stem-like cells in normal samples in each tissue plotted against the malignancy continuum. Samples are colored based on if they are from different disease stage. |
Top |
Malignant transformation related pathway analysis |
| Find out the enriched GO biological processes and KEGG pathways involved in transition from healthy to precancer to cancer |
| Tissue | Disease Stage | Enriched GO biological Processes |
| Colorectum | AD |  |
| Colorectum | SER |  |
| Colorectum | MSS |  |
| Colorectum | MSI-H |  |
| Colorectum | FAP |  |
| ∗Top 15 enriched GO BP terms are showed in the bar plot of each disease state in each tissue. Each row represents a significant GO biological process which is colored according to the -log10(p.adjust). |
| Page: 1 2 3 4 5 6 7 8 9 |
| GO ID | Tissue | Disease Stage | Description | Gene Ratio | Bg Ratio | pvalue | p.adjust | Count |
| Page: 1 |
| Pathway ID | Tissue | Disease Stage | Description | Gene Ratio | Bg Ratio | pvalue | p.adjust | qvalue | Count |
| Page: 1 |
Top |
Cell-cell communication analysis |
| Identification of potential cell-cell interactions between two cell types and their ligand-receptor pairs for different disease states |
| Ligand | Receptor | LRpair | Pathway | Tissue | Disease Stage |
| Page: 1 |
Top |
Single-cell gene regulatory network inference analysis |
| Find out the significant the regulons (TFs) and the target genes of each regulon across cell types for different disease states |
| TF | Cell Type | Tissue | Disease Stage | Target Gene | RSS | Regulon Activity |
| ∗The dot plots of a searched regulon are shown for all cell subpopulations in each disease state of each tissue based on the regulon specific score inferred using pySCENIC and by calculating the average expression. |
| Page: 1 |
Top |
Somatic mutation of malignant transformation related genes |
| Annotation of somatic variants for genes involved in malignant transformation |
| Hugo Symbol | Variant Class | Variant Classification | dbSNP RS | HGVSc | HGVSp | HGVSp Short | SWISSPROT | BIOTYPE | SIFT | PolyPhen | Tumor Sample Barcode | Tissue | Histology | Sex | Age | Stage | Therapy Types | Drugs | Outcome |
| PTMA | SNV | Missense_Mutation | novel | c.82G>A | p.Glu28Lys | p.E28K | P06454 | protein_coding | tolerated(0.06) | probably_damaging(0.945) | TCGA-DS-A1OB-01 | Cervix | cervical & endocervical cancer | Female | <65 | I/II | Chemotherapy | carboplatin | PD |
| PTMA | SNV | Missense_Mutation | novel | c.148G>C | p.Asp50His | p.D50H | P06454 | protein_coding | deleterious(0.03) | possibly_damaging(0.553) | TCGA-EK-A3GK-01 | Cervix | cervical & endocervical cancer | Female | <65 | I/II | Unknown | Unknown | SD |
| PTMA | SNV | Missense_Mutation | novel | c.286N>A | p.Glu96Lys | p.E96K | P06454 | protein_coding | deleterious(0.04) | benign(0.433) | TCGA-VS-A958-01 | Cervix | cervical & endocervical cancer | Female | <65 | I/II | Chemotherapy | cisplatin | CR |
| PTMA | SNV | Missense_Mutation | novel | c.295N>A | p.Asp99Asn | p.D99N | P06454 | protein_coding | tolerated(0.07) | benign(0.122) | TCGA-VS-A958-01 | Cervix | cervical & endocervical cancer | Female | <65 | I/II | Chemotherapy | cisplatin | CR |
| PTMA | insertion | Frame_Shift_Ins | novel | c.38_39insCACCAAGG | p.Asp16AlafsTer5 | p.D16Afs*5 | P06454 | protein_coding | TCGA-C5-A1M9-01 | Cervix | cervical & endocervical cancer | Female | <65 | I/II | Chemotherapy | cisplatin | PD | ||
| PTMA | SNV | Missense_Mutation | novel | c.295N>A | p.Asp99Asn | p.D99N | P06454 | protein_coding | tolerated(0.07) | benign(0.122) | TCGA-AP-A056-01 | Endometrium | uterine corpus endometrioid carcinoma | Female | <65 | I/II | Unknown | Unknown | SD |
| PTMA | SNV | Missense_Mutation | novel | c.195N>T | p.Glu65Asp | p.E65D | P06454 | protein_coding | tolerated(0.13) | benign(0.003) | TCGA-AX-A1CE-01 | Endometrium | uterine corpus endometrioid carcinoma | Female | <65 | I/II | Unspecific | Paclitaxel | SD |
| PTMA | SNV | Missense_Mutation | novel | c.309G>T | p.Lys103Asn | p.K103N | P06454 | protein_coding | deleterious(0) | probably_damaging(0.995) | TCGA-AX-A2HC-01 | Endometrium | uterine corpus endometrioid carcinoma | Female | <65 | III/IV | Chemotherapy | paclitaxel | PD |
| PTMA | SNV | Missense_Mutation | novel | c.25N>G | p.Ser9Gly | p.S9G | P06454 | protein_coding | tolerated(0.05) | benign(0) | TCGA-D1-A1NZ-01 | Endometrium | uterine corpus endometrioid carcinoma | Female | <65 | I/II | Unknown | Unknown | SD |
| PTMA | SNV | Missense_Mutation | c.97N>T | p.Ala33Ser | p.A33S | P06454 | protein_coding | deleterious(0.03) | benign(0.19) | TCGA-49-4507-01 | Lung | lung adenocarcinoma | Female | >=65 | III/IV | Chemotherapy | taxol | PD |
| Page: 1 2 |
Top |
Related drugs of malignant transformation related genes |
| Identification of chemicals and drugs interact with genes involved in malignant transfromation |
| (DGIdb 4.0) |
| Entrez ID | Symbol | Category | Interaction Types | Drug Claim Name | Drug Name | PMIDs |
| 5757 | PTMA | NA | THYMALFASIN | THYMALFASIN |
| Page: 1 |

Copyright 2023-Present -The University of Texas Health Science Center at Houston |