| Tissue | Expression Dynamics | Abbreviation |
| Esophagus | 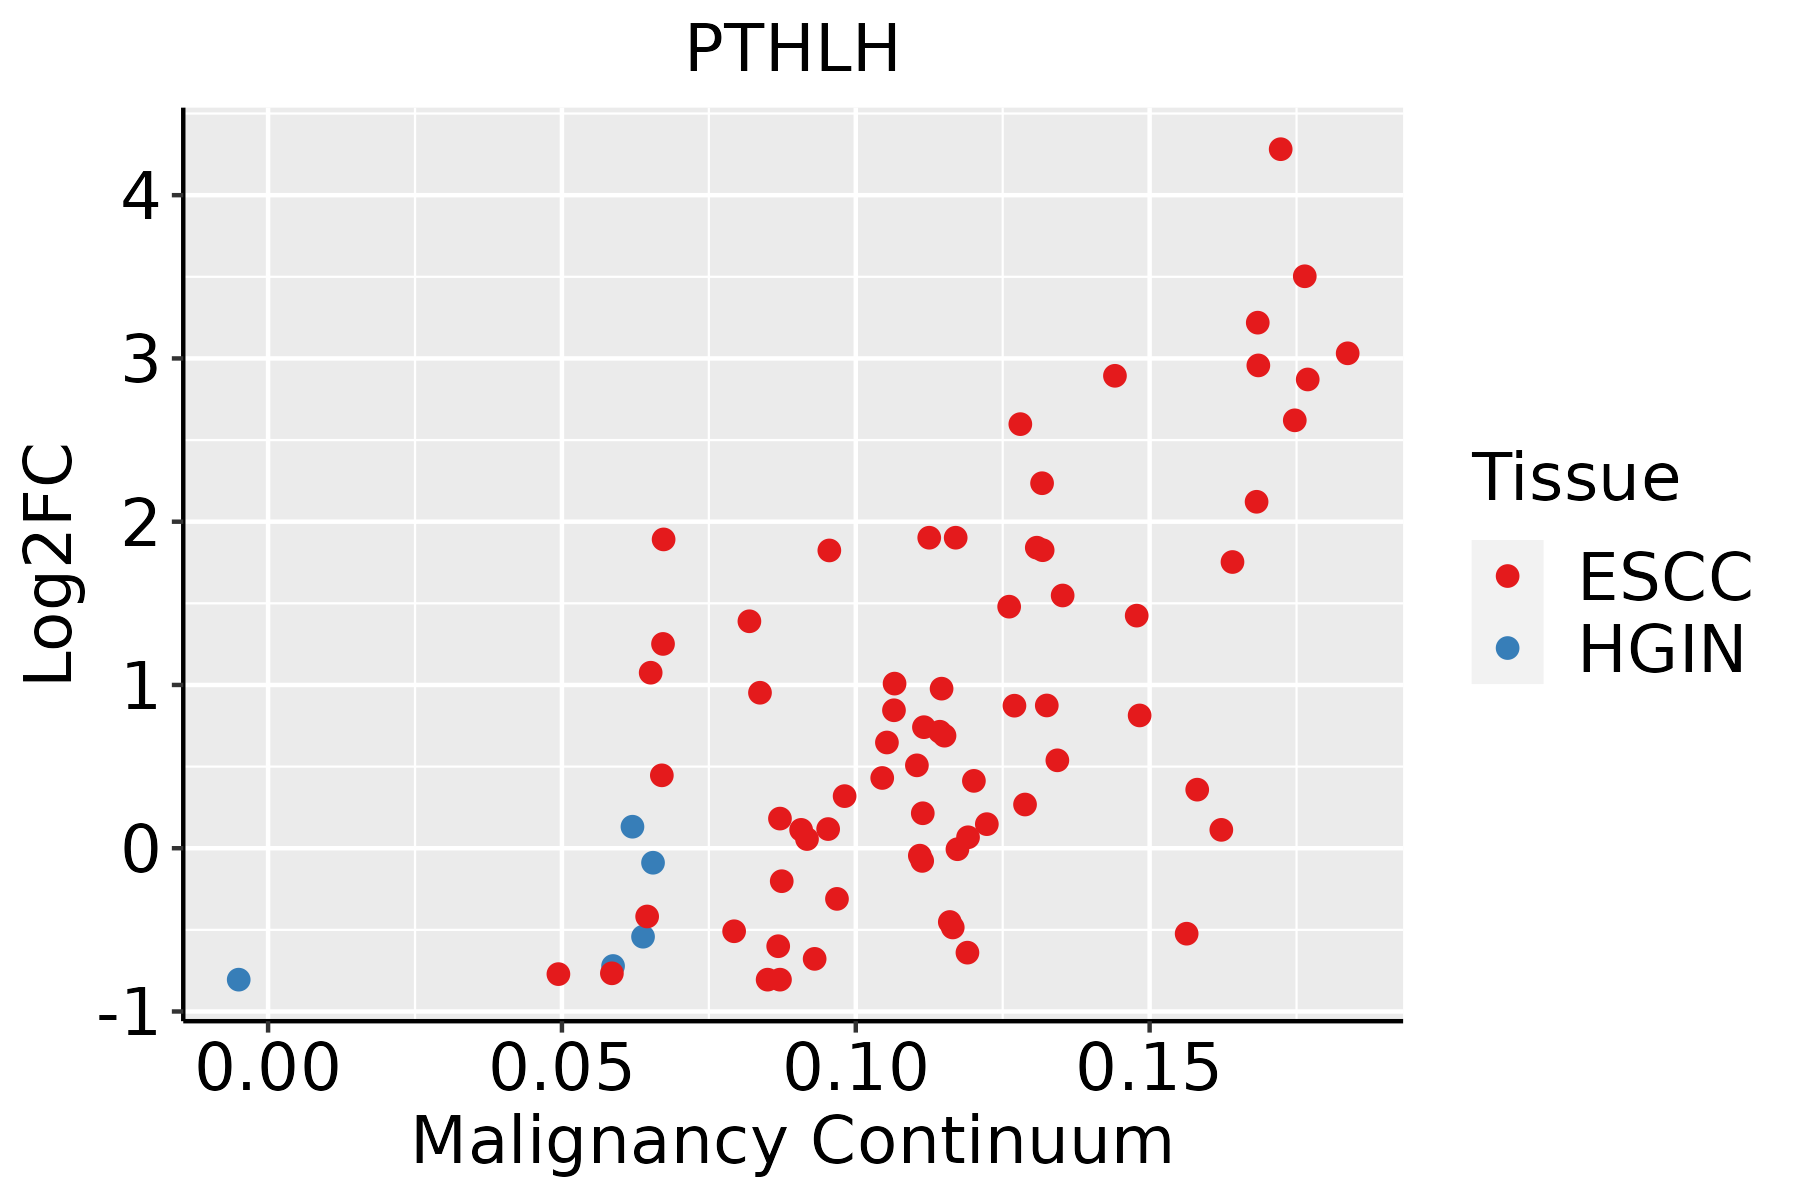 | ESCC: Esophageal squamous cell carcinoma |
| HGIN: High-grade intraepithelial neoplasias |
| LGIN: Low-grade intraepithelial neoplasias |
| Liver | 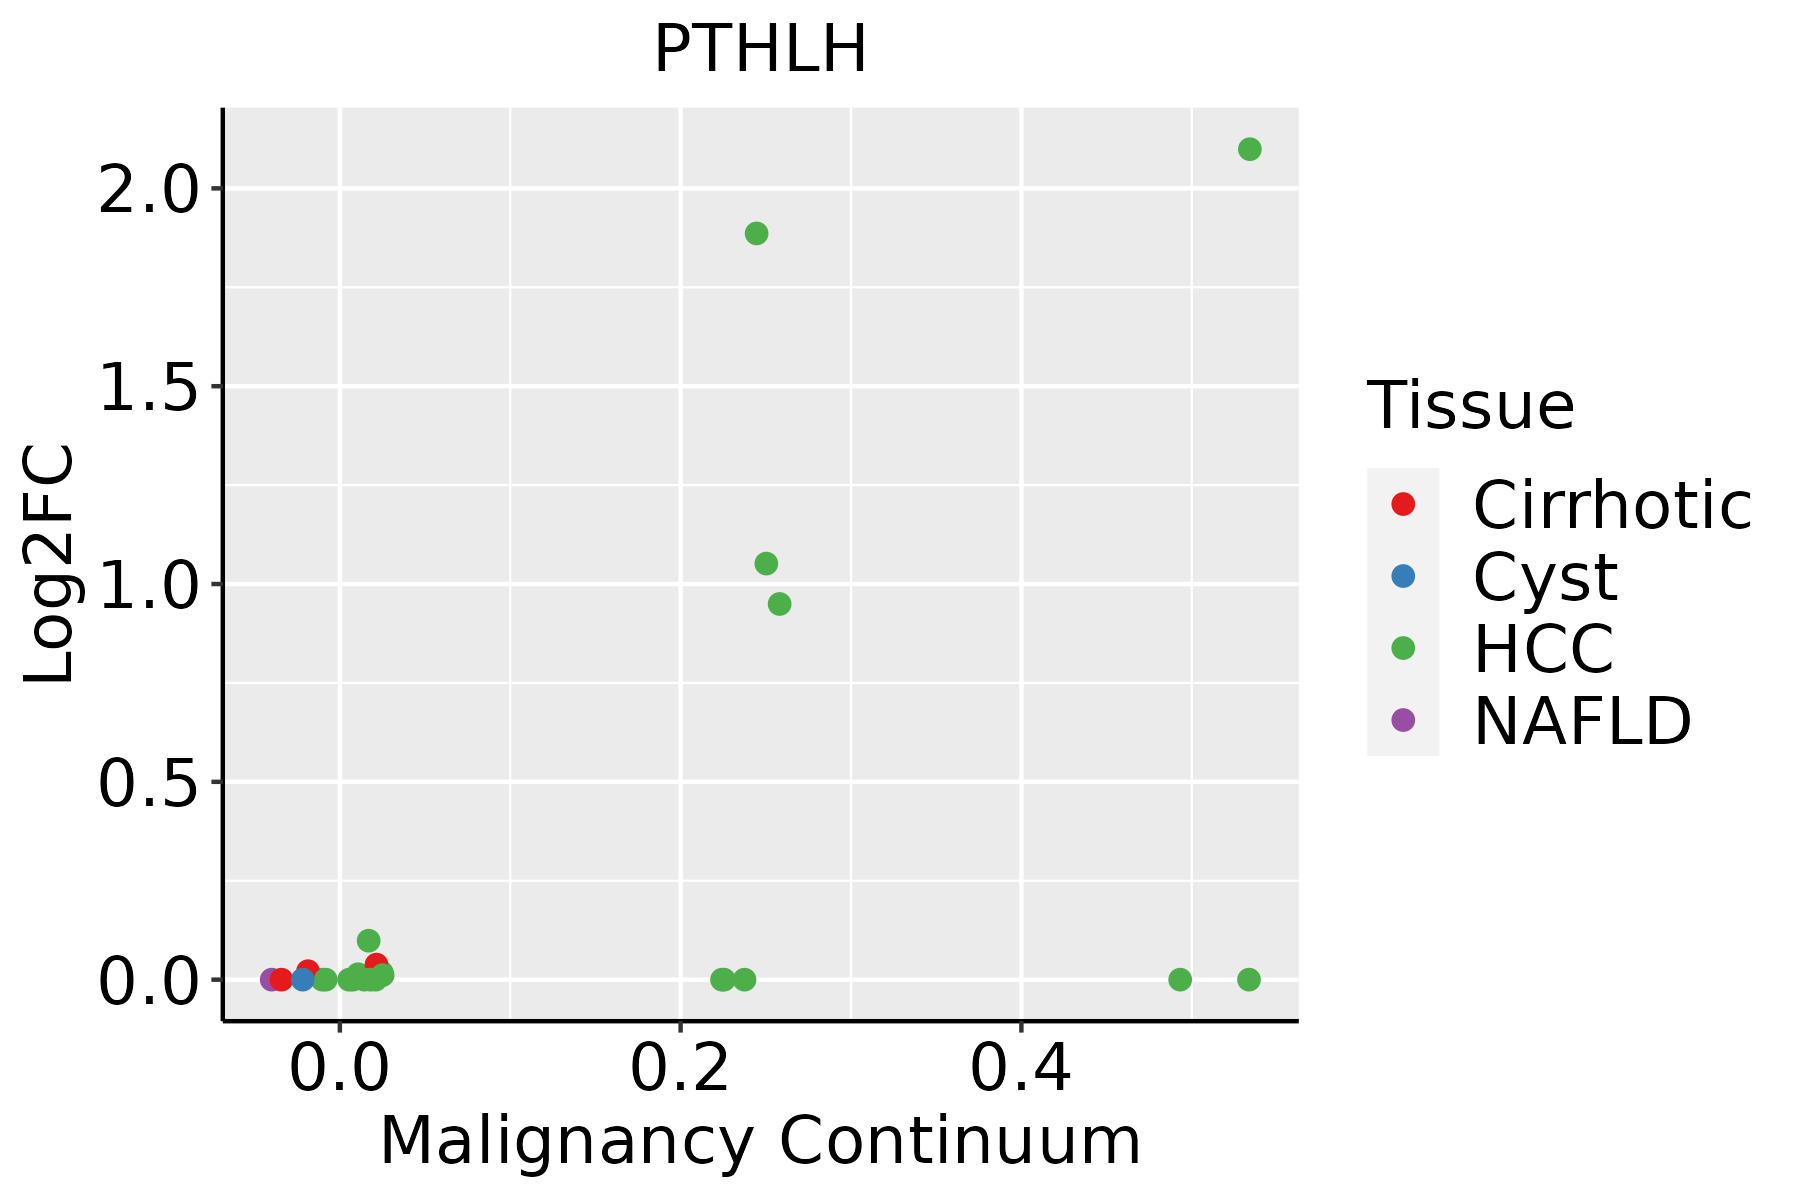 | HCC: Hepatocellular carcinoma |
| NAFLD: Non-alcoholic fatty liver disease |
| Oral Cavity | 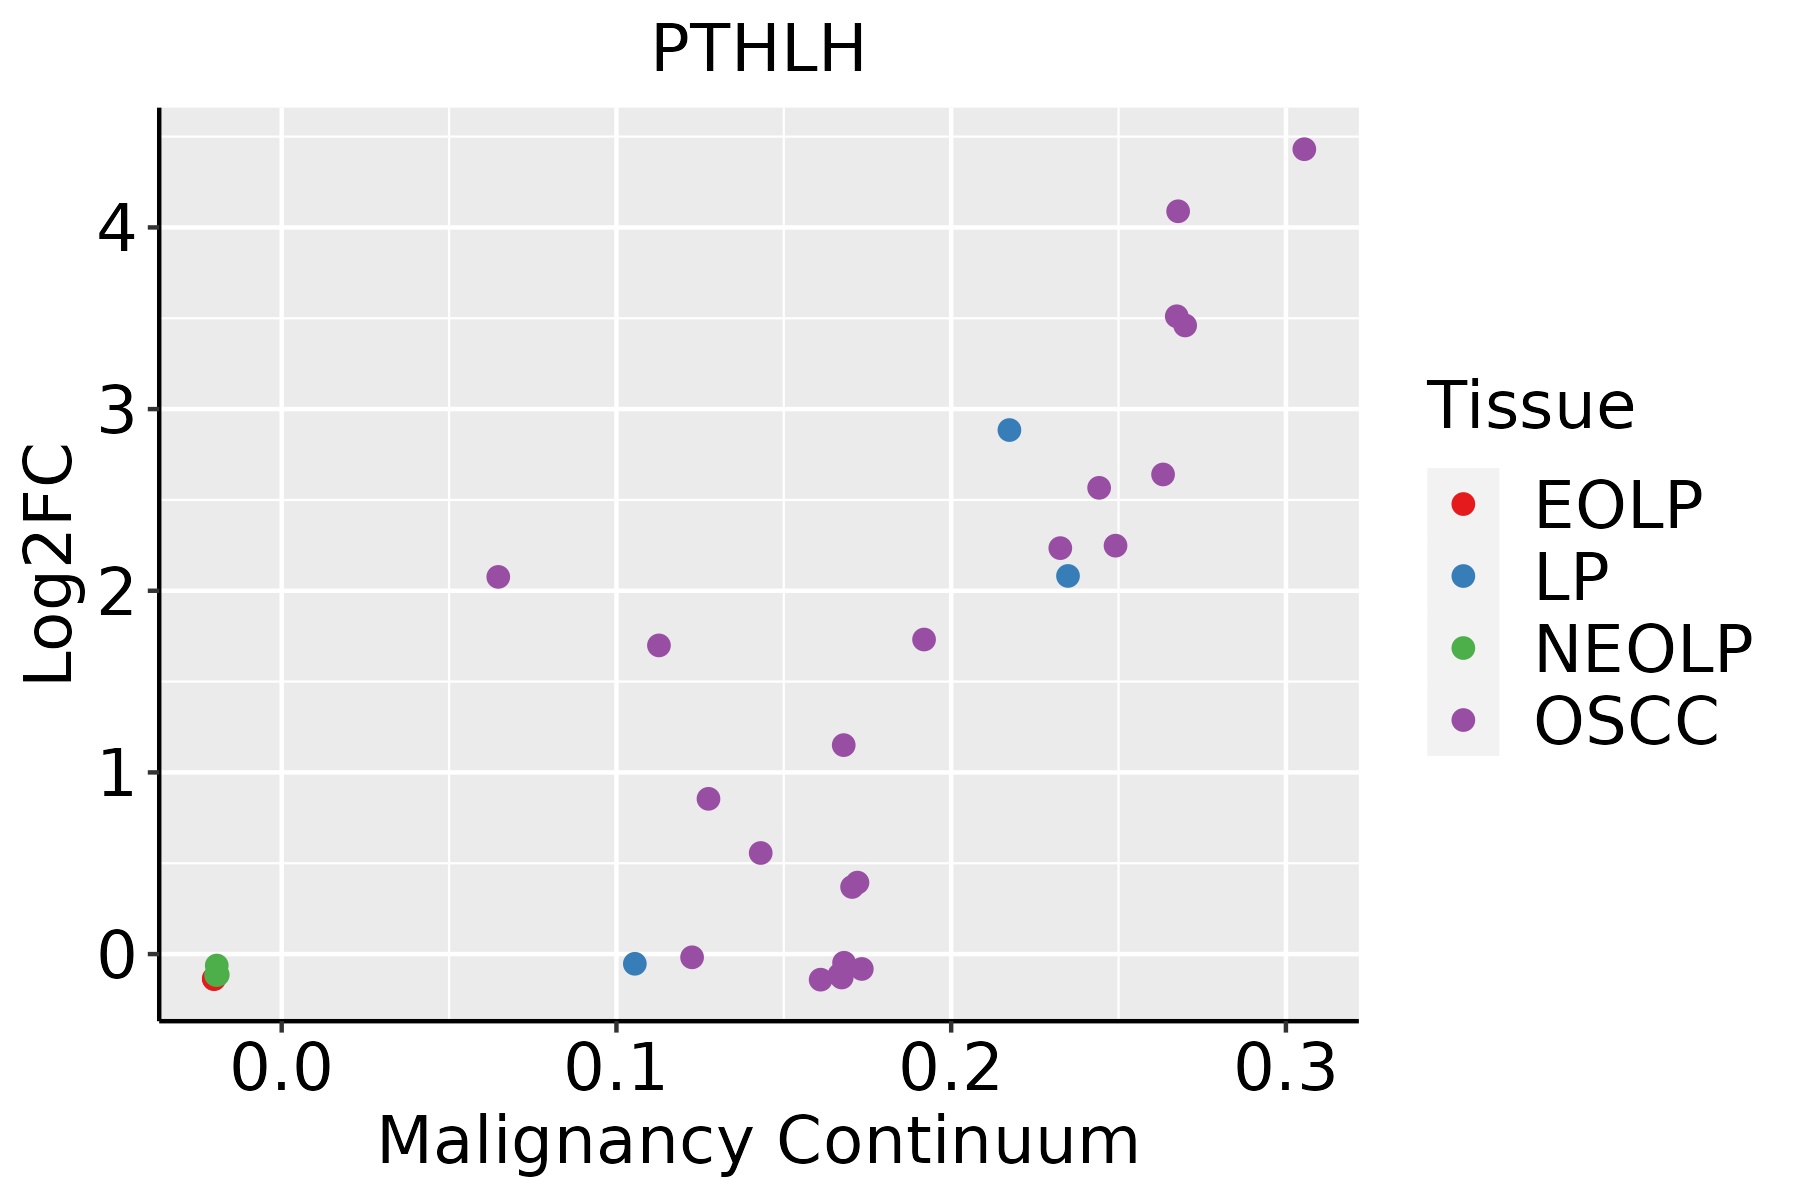 | EOLP: Erosive Oral lichen planus |
| LP: leukoplakia |
| NEOLP: Non-erosive oral lichen planus |
| OSCC: Oral squamous cell carcinoma |
| Skin |  | AK: Actinic keratosis |
| cSCC: Cutaneous squamous cell carcinoma |
| SCCIS:squamous cell carcinoma in situ |
| GO ID | Tissue | Disease Stage | Description | Gene Ratio | Bg Ratio | pvalue | p.adjust | Count |
| GO:000164917 | Esophagus | HGIN | osteoblast differentiation | 50/2587 | 229/18723 | 5.88e-04 | 8.30e-03 | 50 |
| GO:000911720 | Esophagus | HGIN | nucleotide metabolic process | 92/2587 | 489/18723 | 1.11e-03 | 1.36e-02 | 92 |
| GO:000675320 | Esophagus | HGIN | nucleoside phosphate metabolic process | 93/2587 | 497/18723 | 1.25e-03 | 1.49e-02 | 93 |
| GO:000915026 | Esophagus | HGIN | purine ribonucleotide metabolic process | 71/2587 | 368/18723 | 2.00e-03 | 2.11e-02 | 71 |
| GO:000616325 | Esophagus | HGIN | purine nucleotide metabolic process | 75/2587 | 396/18723 | 2.53e-03 | 2.51e-02 | 75 |
| GO:001969320 | Esophagus | HGIN | ribose phosphate metabolic process | 75/2587 | 396/18723 | 2.53e-03 | 2.51e-02 | 75 |
| GO:007252125 | Esophagus | HGIN | purine-containing compound metabolic process | 78/2587 | 416/18723 | 2.78e-03 | 2.73e-02 | 78 |
| GO:000150316 | Esophagus | HGIN | ossification | 75/2587 | 408/18723 | 5.49e-03 | 4.49e-02 | 75 |
| GO:000925920 | Esophagus | HGIN | ribonucleotide metabolic process | 71/2587 | 385/18723 | 6.25e-03 | 4.97e-02 | 71 |
| GO:0006753110 | Esophagus | ESCC | nucleoside phosphate metabolic process | 288/8552 | 497/18723 | 1.80e-08 | 3.50e-07 | 288 |
| GO:0019693111 | Esophagus | ESCC | ribose phosphate metabolic process | 234/8552 | 396/18723 | 4.24e-08 | 7.76e-07 | 234 |
| GO:0009117111 | Esophagus | ESCC | nucleotide metabolic process | 282/8552 | 489/18723 | 4.70e-08 | 8.50e-07 | 282 |
| GO:000854410 | Esophagus | ESCC | epidermis development | 193/8552 | 324/18723 | 2.87e-07 | 4.19e-06 | 193 |
| GO:0009259111 | Esophagus | ESCC | ribonucleotide metabolic process | 224/8552 | 385/18723 | 4.41e-07 | 6.00e-06 | 224 |
| GO:0072521111 | Esophagus | ESCC | purine-containing compound metabolic process | 238/8552 | 416/18723 | 1.20e-06 | 1.49e-05 | 238 |
| GO:0009150111 | Esophagus | ESCC | purine ribonucleotide metabolic process | 213/8552 | 368/18723 | 1.40e-06 | 1.69e-05 | 213 |
| GO:000164918 | Esophagus | ESCC | osteoblast differentiation | 140/8552 | 229/18723 | 1.63e-06 | 1.95e-05 | 140 |
| GO:0006163111 | Esophagus | ESCC | purine nucleotide metabolic process | 226/8552 | 396/18723 | 2.81e-06 | 3.21e-05 | 226 |
| GO:000150317 | Esophagus | ESCC | ossification | 232/8552 | 408/18723 | 3.00e-06 | 3.40e-05 | 232 |
| GO:00512161 | Esophagus | ESCC | cartilage development | 103/8552 | 190/18723 | 1.08e-02 | 3.67e-02 | 103 |
| Hugo Symbol | Variant Class | Variant Classification | dbSNP RS | HGVSc | HGVSp | HGVSp Short | SWISSPROT | BIOTYPE | SIFT | PolyPhen | Tumor Sample Barcode | Tissue | Histology | Sex | Age | Stage | Therapy Types | Drugs | Outcome |
| PTHLH | SNV | Missense_Mutation | | c.126N>T | p.Gln42His | p.Q42H | P12272 | protein_coding | deleterious(0) | probably_damaging(0.998) | TCGA-AN-A04C-01 | Breast | breast invasive carcinoma | Female | <65 | I/II | Unknown | Unknown | SD |
| PTHLH | SNV | Missense_Mutation | | c.221N>T | p.Ala74Val | p.A74V | P12272 | protein_coding | tolerated(0.05) | benign(0.393) | TCGA-BH-A1FD-01 | Breast | breast invasive carcinoma | Female | >=65 | I/II | Unknown | Unknown | PD |
| PTHLH | SNV | Missense_Mutation | | c.521C>T | p.Ser174Leu | p.S174L | P12272 | protein_coding | tolerated_low_confidence(0.46) | benign(0) | TCGA-C8-A26V-01 | Breast | breast invasive carcinoma | Female | <65 | III/IV | Hormone Therapy | tamoxiphen | CR |
| PTHLH | SNV | Missense_Mutation | | c.430N>T | p.Arg144Cys | p.R144C | P12272 | protein_coding | deleterious(0) | probably_damaging(0.993) | TCGA-ZJ-AAXT-01 | Cervix | cervical & endocervical cancer | Female | <65 | III/IV | Unknown | Unknown | SD |
| PTHLH | SNV | Missense_Mutation | rs778459165 | c.506C>T | p.Ser169Leu | p.S169L | P12272 | protein_coding | deleterious_low_confidence(0.04) | benign(0.006) | TCGA-AA-3663-01 | Colorectum | colon adenocarcinoma | Male | <65 | I/II | Unknown | Unknown | SD |
| PTHLH | SNV | Missense_Mutation | rs758972275 | c.397N>T | p.Arg133Cys | p.R133C | P12272 | protein_coding | deleterious(0) | probably_damaging(0.993) | TCGA-AA-3977-01 | Colorectum | colon adenocarcinoma | Male | >=65 | I/II | Unknown | Unknown | SD |
| PTHLH | SNV | Missense_Mutation | | c.503N>T | p.Thr168Met | p.T168M | P12272 | protein_coding | deleterious_low_confidence(0) | benign(0.011) | TCGA-AZ-4615-01 | Colorectum | colon adenocarcinoma | Male | >=65 | III/IV | Chemotherapy | xeloda | PD |
| PTHLH | SNV | Missense_Mutation | rs778459165 | c.506N>T | p.Ser169Leu | p.S169L | P12272 | protein_coding | deleterious_low_confidence(0.04) | benign(0.006) | TCGA-CK-5915-01 | Colorectum | colon adenocarcinoma | Male | <65 | I/II | Unknown | Unknown | SD |
| PTHLH | SNV | Missense_Mutation | | c.398N>A | p.Arg133His | p.R133H | P12272 | protein_coding | deleterious(0.04) | probably_damaging(0.991) | TCGA-CM-6171-01 | Colorectum | colon adenocarcinoma | Female | >=65 | I/II | Unknown | Unknown | SD |
| PTHLH | SNV | Missense_Mutation | novel | c.485N>C | p.Leu162Pro | p.L162P | P12272 | protein_coding | tolerated_low_confidence(0.16) | benign(0) | TCGA-G4-6314-01 | Colorectum | colon adenocarcinoma | Female | >=65 | III/IV | Ancillary | leucovorin | SD |
| Entrez ID | Symbol | Category | Interaction Types | Drug Claim Name | Drug Name | PMIDs |
| 5744 | PTHLH | HORMONE ACTIVITY, DRUGGABLE GENOME | | MAGNESIUM SULFATE | | 11384692 |
| 5744 | PTHLH | HORMONE ACTIVITY, DRUGGABLE GENOME | | DIFFERENTIATION AGENTS | | 10839458 |
| 5744 | PTHLH | HORMONE ACTIVITY, DRUGGABLE GENOME | | PROTEOLYTIC ENZYMES | | 7556886 |
| 5744 | PTHLH | HORMONE ACTIVITY, DRUGGABLE GENOME | | VINBLASTINE | VINBLASTINE | 9784008 |
| 5744 | PTHLH | HORMONE ACTIVITY, DRUGGABLE GENOME | | DIMETHYL SULFOXIDE | | 10839458 |
| 5744 | PTHLH | HORMONE ACTIVITY, DRUGGABLE GENOME | inhibitor | CHEMBL2109562 | CAL | |


