
|
|||||
|
 | |
| |
| |
| |
| |
| |
|
Gene: PTGS1 |
Gene summary for PTGS1 |
| Gene information | Species | Human | Gene symbol | PTGS1 | Gene ID | 5742 |
| Gene name | prostaglandin-endoperoxide synthase 1 | |
| Gene Alias | COX1 | |
| Cytomap | 9q33.2 | |
| Gene Type | protein-coding | GO ID | GO:0001516 | UniProtAcc | P23219 |
Top |
Malignant transformation analysis |
| Identification of the aberrant gene expression in precancerous and cancerous lesions by comparing the gene expression of stem-like cells in diseased tissues with normal stem cells |
| Entrez ID | Symbol | Replicates | Species | Organ | Tissue | Adj P-value | Log2FC | Malignancy |
| 5742 | PTGS1 | P2T-E | Human | Esophagus | ESCC | 8.73e-07 | 5.55e-02 | 0.1177 |
| 5742 | PTGS1 | P8T-E | Human | Esophagus | ESCC | 1.84e-05 | 2.02e-01 | 0.0889 |
| 5742 | PTGS1 | P21T-E | Human | Esophagus | ESCC | 4.22e-62 | 1.90e+00 | 0.1617 |
| 5742 | PTGS1 | P37T-E | Human | Esophagus | ESCC | 9.59e-19 | 5.62e-01 | 0.1371 |
| 5742 | PTGS1 | P38T-E | Human | Esophagus | ESCC | 4.20e-03 | 1.77e-01 | 0.127 |
| 5742 | PTGS1 | P47T-E | Human | Esophagus | ESCC | 2.21e-02 | 8.98e-02 | 0.1067 |
| 5742 | PTGS1 | P52T-E | Human | Esophagus | ESCC | 2.66e-15 | 6.61e-01 | 0.1555 |
| 5742 | PTGS1 | P62T-E | Human | Esophagus | ESCC | 1.26e-11 | 4.17e-01 | 0.1302 |
| 5742 | PTGS1 | P74T-E | Human | Esophagus | ESCC | 2.94e-20 | 5.79e-01 | 0.1479 |
| 5742 | PTGS1 | P80T-E | Human | Esophagus | ESCC | 3.01e-05 | 3.28e-01 | 0.155 |
| 5742 | PTGS1 | P89T-E | Human | Esophagus | ESCC | 6.99e-05 | 6.30e-01 | 0.1752 |
| 5742 | PTGS1 | P91T-E | Human | Esophagus | ESCC | 1.20e-15 | 1.69e+00 | 0.1828 |
| 5742 | PTGS1 | C04 | Human | Oral cavity | OSCC | 6.12e-17 | 7.19e-01 | 0.2633 |
| 5742 | PTGS1 | C21 | Human | Oral cavity | OSCC | 1.01e-13 | 4.48e-01 | 0.2678 |
| 5742 | PTGS1 | C30 | Human | Oral cavity | OSCC | 1.89e-16 | 7.62e-01 | 0.3055 |
| 5742 | PTGS1 | C51 | Human | Oral cavity | OSCC | 1.03e-26 | 1.06e+00 | 0.2674 |
| 5742 | PTGS1 | C06 | Human | Oral cavity | OSCC | 3.05e-10 | 1.57e+00 | 0.2699 |
| 5742 | PTGS1 | C09 | Human | Oral cavity | OSCC | 1.87e-03 | 2.23e-01 | 0.1431 |
| 5742 | PTGS1 | EOLP-1 | Human | Oral cavity | EOLP | 1.23e-02 | 1.54e-01 | -0.0202 |
| 5742 | PTGS1 | EOLP-2 | Human | Oral cavity | EOLP | 5.05e-11 | 3.52e-01 | -0.0203 |
| Page: 1 2 |
| Tissue | Expression Dynamics | Abbreviation |
| Esophagus | 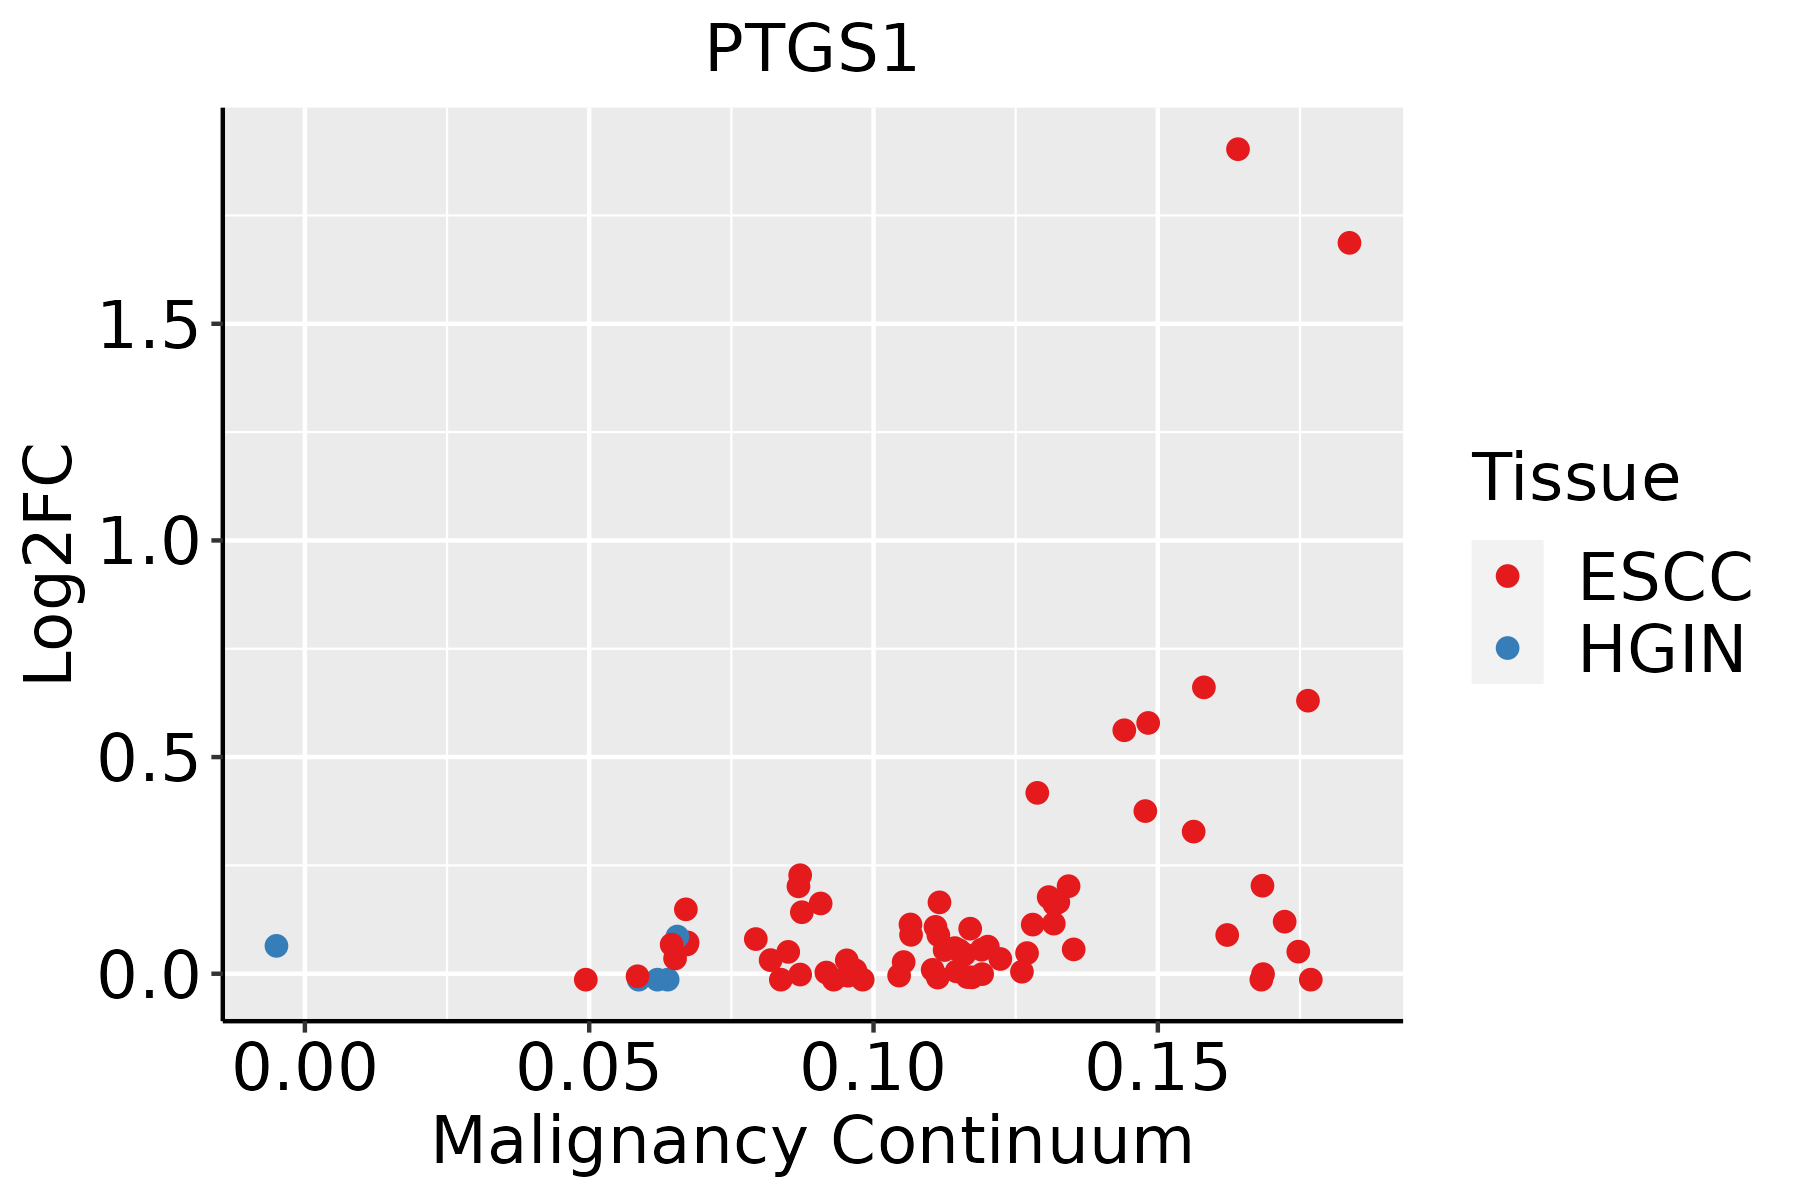 | ESCC: Esophageal squamous cell carcinoma |
| HGIN: High-grade intraepithelial neoplasias | ||
| LGIN: Low-grade intraepithelial neoplasias | ||
| Oral Cavity |  | EOLP: Erosive Oral lichen planus |
| LP: leukoplakia | ||
| NEOLP: Non-erosive oral lichen planus | ||
| OSCC: Oral squamous cell carcinoma | ||
| Skin | 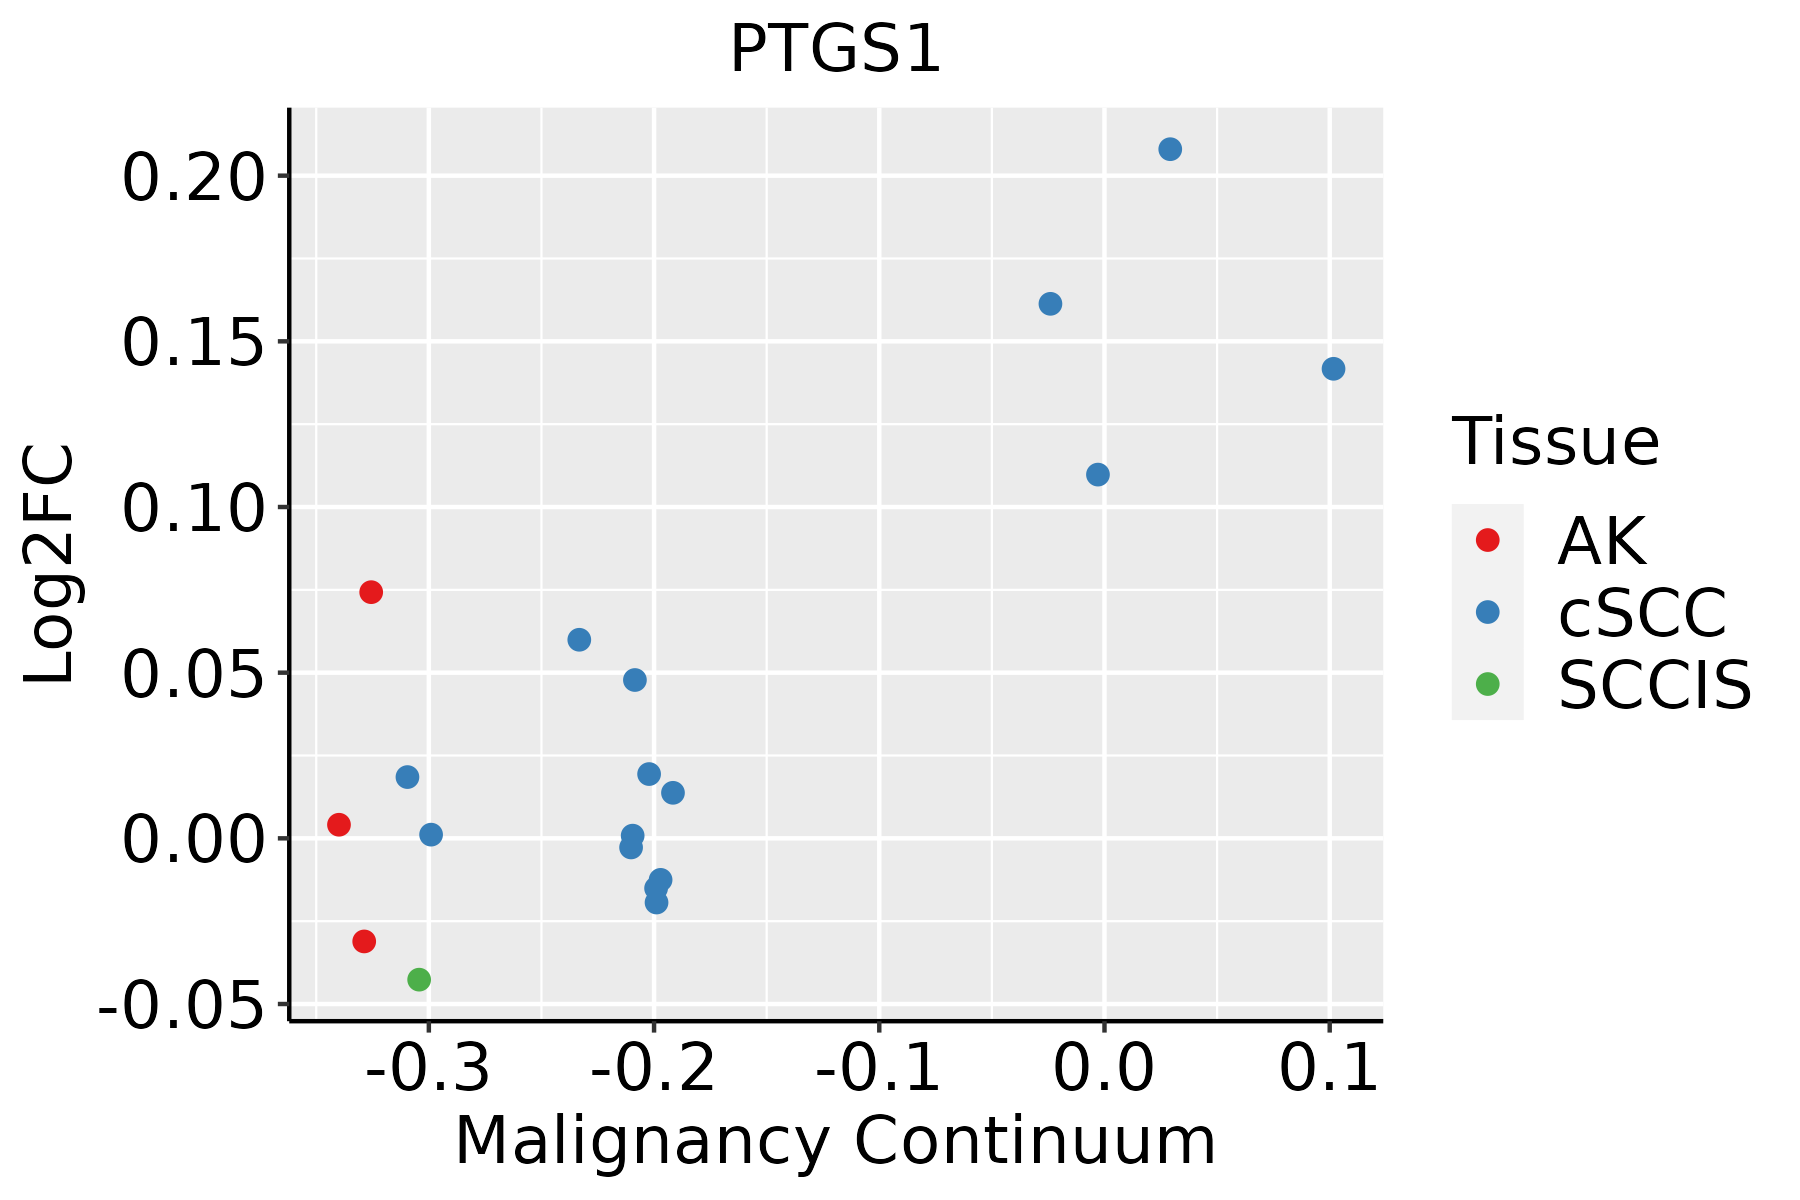 | AK: Actinic keratosis |
| cSCC: Cutaneous squamous cell carcinoma | ||
| SCCIS:squamous cell carcinoma in situ |
| ∗log2FC in expression of this searched gene in stem-like cells from each diseased tissue sample relative to stem-like cells in normal samples in each tissue plotted against the malignancy continuum. Samples are colored based on if they are from different disease stage. |
Top |
Malignant transformation related pathway analysis |
| Find out the enriched GO biological processes and KEGG pathways involved in transition from healthy to precancer to cancer |
| Tissue | Disease Stage | Enriched GO biological Processes |
| Colorectum | AD |  |
| Colorectum | SER |  |
| Colorectum | MSS |  |
| Colorectum | MSI-H |  |
| Colorectum | FAP |  |
| ∗Top 15 enriched GO BP terms are showed in the bar plot of each disease state in each tissue. Each row represents a significant GO biological process which is colored according to the -log10(p.adjust). |
| Page: 1 2 3 4 5 6 7 8 9 |
| GO ID | Tissue | Disease Stage | Description | Gene Ratio | Bg Ratio | pvalue | p.adjust | Count |
| GO:0006979111 | Esophagus | ESCC | response to oxidative stress | 303/8552 | 446/18723 | 7.15e-22 | 1.30e-19 | 303 |
| GO:00066318 | Esophagus | ESCC | fatty acid metabolic process | 217/8552 | 390/18723 | 4.21e-05 | 3.39e-04 | 217 |
| GO:000963620 | Esophagus | ESCC | response to toxic substance | 150/8552 | 262/18723 | 1.00e-04 | 7.12e-04 | 150 |
| GO:00463948 | Esophagus | ESCC | carboxylic acid biosynthetic process | 175/8552 | 314/18723 | 1.98e-04 | 1.26e-03 | 175 |
| GO:00160538 | Esophagus | ESCC | organic acid biosynthetic process | 175/8552 | 316/18723 | 3.04e-04 | 1.82e-03 | 175 |
| GO:1990748110 | Esophagus | ESCC | cellular detoxification | 70/8552 | 116/18723 | 1.02e-03 | 5.17e-03 | 70 |
| GO:000669211 | Esophagus | ESCC | prostanoid metabolic process | 33/8552 | 49/18723 | 1.80e-03 | 8.26e-03 | 33 |
| GO:000669311 | Esophagus | ESCC | prostaglandin metabolic process | 33/8552 | 49/18723 | 1.80e-03 | 8.26e-03 | 33 |
| GO:0097237110 | Esophagus | ESCC | cellular response to toxic substance | 72/8552 | 124/18723 | 3.65e-03 | 1.49e-02 | 72 |
| GO:0098869110 | Esophagus | ESCC | cellular oxidant detoxification | 60/8552 | 101/18723 | 3.76e-03 | 1.53e-02 | 60 |
| GO:000697920 | Oral cavity | OSCC | response to oxidative stress | 273/7305 | 446/18723 | 8.35e-22 | 1.65e-19 | 273 |
| GO:000963618 | Oral cavity | OSCC | response to toxic substance | 137/7305 | 262/18723 | 7.94e-06 | 8.52e-05 | 137 |
| GO:00160537 | Oral cavity | OSCC | organic acid biosynthetic process | 155/7305 | 316/18723 | 1.64e-04 | 1.13e-03 | 155 |
| GO:00463947 | Oral cavity | OSCC | carboxylic acid biosynthetic process | 154/7305 | 314/18723 | 1.73e-04 | 1.19e-03 | 154 |
| GO:00066317 | Oral cavity | OSCC | fatty acid metabolic process | 186/7305 | 390/18723 | 2.65e-04 | 1.69e-03 | 186 |
| GO:199074818 | Oral cavity | OSCC | cellular detoxification | 63/7305 | 116/18723 | 5.80e-04 | 3.31e-03 | 63 |
| GO:009886918 | Oral cavity | OSCC | cellular oxidant detoxification | 55/7305 | 101/18723 | 1.16e-03 | 5.89e-03 | 55 |
| GO:009723718 | Oral cavity | OSCC | cellular response to toxic substance | 65/7305 | 124/18723 | 1.63e-03 | 7.74e-03 | 65 |
| GO:00066928 | Oral cavity | OSCC | prostanoid metabolic process | 29/7305 | 49/18723 | 3.33e-03 | 1.42e-02 | 29 |
| GO:00066938 | Oral cavity | OSCC | prostaglandin metabolic process | 29/7305 | 49/18723 | 3.33e-03 | 1.42e-02 | 29 |
| Page: 1 2 |
| Pathway ID | Tissue | Disease Stage | Description | Gene Ratio | Bg Ratio | pvalue | p.adjust | qvalue | Count |
| hsa046116 | Oral cavity | EOLP | Platelet activation | 29/1218 | 124/8465 | 4.73e-03 | 1.48e-02 | 8.75e-03 | 29 |
| hsa0461114 | Oral cavity | EOLP | Platelet activation | 29/1218 | 124/8465 | 4.73e-03 | 1.48e-02 | 8.75e-03 | 29 |
| Page: 1 |
Top |
Cell-cell communication analysis |
| Identification of potential cell-cell interactions between two cell types and their ligand-receptor pairs for different disease states |
| Ligand | Receptor | LRpair | Pathway | Tissue | Disease Stage |
| Page: 1 |
Top |
Single-cell gene regulatory network inference analysis |
| Find out the significant the regulons (TFs) and the target genes of each regulon across cell types for different disease states |
| TF | Cell Type | Tissue | Disease Stage | Target Gene | RSS | Regulon Activity |
| ∗The dot plots of a searched regulon are shown for all cell subpopulations in each disease state of each tissue based on the regulon specific score inferred using pySCENIC and by calculating the average expression. |
| Page: 1 |
Top |
Somatic mutation of malignant transformation related genes |
| Annotation of somatic variants for genes involved in malignant transformation |
| Hugo Symbol | Variant Class | Variant Classification | dbSNP RS | HGVSc | HGVSp | HGVSp Short | SWISSPROT | BIOTYPE | SIFT | PolyPhen | Tumor Sample Barcode | Tissue | Histology | Sex | Age | Stage | Therapy Types | Drugs | Outcome |
| PTGS1 | SNV | Missense_Mutation | rs778094724 | c.1628N>C | p.Tyr543Ser | p.Y543S | P23219 | protein_coding | deleterious(0) | probably_damaging(0.98) | TCGA-A7-A0CE-01 | Breast | breast invasive carcinoma | Female | <65 | I/II | Chemotherapy | adriamycin | SD |
| PTGS1 | SNV | Missense_Mutation | c.511C>T | p.Pro171Ser | p.P171S | P23219 | protein_coding | deleterious(0) | probably_damaging(0.997) | TCGA-AN-A0AK-01 | Breast | breast invasive carcinoma | Female | >=65 | I/II | Unknown | Unknown | SD | |
| PTGS1 | SNV | Missense_Mutation | novel | c.958C>A | p.Pro320Thr | p.P320T | P23219 | protein_coding | deleterious(0) | probably_damaging(0.939) | TCGA-AN-A0AK-01 | Breast | breast invasive carcinoma | Female | >=65 | I/II | Unknown | Unknown | SD |
| PTGS1 | SNV | Missense_Mutation | c.1197N>C | p.Gln399His | p.Q399H | P23219 | protein_coding | tolerated(0.22) | benign(0.005) | TCGA-AO-A0J2-01 | Breast | breast invasive carcinoma | Female | <65 | I/II | Chemotherapy | cyclophosphamide | SD | |
| PTGS1 | SNV | Missense_Mutation | rs753219685 | c.1622N>T | p.Pro541Leu | p.P541L | P23219 | protein_coding | deleterious(0) | probably_damaging(0.998) | TCGA-BH-A1F5-01 | Breast | breast invasive carcinoma | Female | <65 | I/II | Unknown | Unknown | SD |
| PTGS1 | SNV | Missense_Mutation | c.1504N>A | p.Phe502Ile | p.F502I | P23219 | protein_coding | deleterious(0) | possibly_damaging(0.856) | TCGA-D8-A1XK-01 | Breast | breast invasive carcinoma | Female | <65 | I/II | Chemotherapy | doxorubicine+cyclophosphamide | SD | |
| PTGS1 | insertion | In_Frame_Ins | novel | c.1630_1631insTTTCCCCAGTGCCAACCATGCCAAATTCTA | p.Trp544delinsPheSerProValProThrMetProAsnSerArg | p.W544delinsFSPVPTMPNSR | P23219 | protein_coding | TCGA-A7-A0CE-01 | Breast | breast invasive carcinoma | Female | <65 | I/II | Chemotherapy | adriamycin | SD | ||
| PTGS1 | insertion | Frame_Shift_Ins | novel | c.1244_1245insATTAG | p.Asp415GlufsTer59 | p.D415Efs*59 | P23219 | protein_coding | TCGA-AN-A0FX-01 | Breast | breast invasive carcinoma | Female | <65 | I/II | Unknown | Unknown | SD | ||
| PTGS1 | insertion | Nonsense_Mutation | novel | c.1246_1247insGGGTGACTCAGCACATTTGATTAGCC | p.Tyr416TrpfsTer7 | p.Y416Wfs*7 | P23219 | protein_coding | TCGA-AN-A0FX-01 | Breast | breast invasive carcinoma | Female | <65 | I/II | Unknown | Unknown | SD | ||
| PTGS1 | insertion | Frame_Shift_Ins | novel | c.1680_1681insAAAA | p.Ala561LysfsTer29 | p.A561Kfs*29 | P23219 | protein_coding | TCGA-AR-A0TU-01 | Breast | breast invasive carcinoma | Female | <65 | I/II | Unspecific | Doxorubicin | SD |
| Page: 1 2 3 4 5 6 7 8 |
Top |
Related drugs of malignant transformation related genes |
| Identification of chemicals and drugs interact with genes involved in malignant transfromation |
| (DGIdb 4.0) |
| Entrez ID | Symbol | Category | Interaction Types | Drug Claim Name | Drug Name | PMIDs |
| 5742 | PTGS1 | ENZYME, DRUGGABLE GENOME | inhibitor | CHEMBL956 | SUPROFEN | |
| 5742 | PTGS1 | ENZYME, DRUGGABLE GENOME | MESALAZINE | MESALAMINE | ||
| 5742 | PTGS1 | ENZYME, DRUGGABLE GENOME | inhibitor | CHEMBL101 | PHENYLBUTAZONE | |
| 5742 | PTGS1 | ENZYME, DRUGGABLE GENOME | inhibitor | CHEMBL1200760 | BALSALAZIDE DISODIUM | |
| 5742 | PTGS1 | ENZYME, DRUGGABLE GENOME | MEFENAMIC ACID | |||
| 5742 | PTGS1 | ENZYME, DRUGGABLE GENOME | inhibitor | CHEMBL1120 | BISMUTH SUBSALICYLATE | |
| 5742 | PTGS1 | ENZYME, DRUGGABLE GENOME | IBUPROFEN | IBUPROFEN | ||
| 5742 | PTGS1 | ENZYME, DRUGGABLE GENOME | inhibitor | CHEMBL1201141 | IBUPROFEN LYSINE | |
| 5742 | PTGS1 | ENZYME, DRUGGABLE GENOME | inhibitor | CHEMBL1200463 | OXAPROZIN POTASSIUM | |
| 5742 | PTGS1 | ENZYME, DRUGGABLE GENOME | ASPIRIN | ASPIRIN | 23651359 |
| Page: 1 2 3 4 5 6 7 8 9 10 11 12 13 14 15 16 17 |

Copyright 2023-Present -The University of Texas Health Science Center at Houston |