
|
|||||
|
 | |
| |
| |
| |
| |
| |
|
Gene: PTGR2 |
Gene summary for PTGR2 |
| Gene information | Species | Human | Gene symbol | PTGR2 | Gene ID | 145482 |
| Gene name | prostaglandin reductase 2 | |
| Gene Alias | HEL-S-298 | |
| Cytomap | 14q24.3 | |
| Gene Type | protein-coding | GO ID | GO:0006082 | UniProtAcc | Q8N8N7 |
Top |
Malignant transformation analysis |
| Identification of the aberrant gene expression in precancerous and cancerous lesions by comparing the gene expression of stem-like cells in diseased tissues with normal stem cells |
| Entrez ID | Symbol | Replicates | Species | Organ | Tissue | Adj P-value | Log2FC | Malignancy |
| 145482 | PTGR2 | HCC1_Meng | Human | Liver | HCC | 2.47e-71 | 1.69e-01 | 0.0246 |
| 145482 | PTGR2 | HCC2_Meng | Human | Liver | HCC | 2.73e-13 | 4.09e-02 | 0.0107 |
| 145482 | PTGR2 | cirrhotic2 | Human | Liver | Cirrhotic | 3.97e-05 | 1.13e-01 | 0.0201 |
| 145482 | PTGR2 | HCC1 | Human | Liver | HCC | 1.40e-02 | 2.78e+00 | 0.5336 |
| 145482 | PTGR2 | HCC2 | Human | Liver | HCC | 5.57e-16 | 3.36e+00 | 0.5341 |
| 145482 | PTGR2 | S016 | Human | Liver | HCC | 1.85e-03 | 2.22e-01 | 0.2243 |
| Page: 1 |
| Tissue | Expression Dynamics | Abbreviation |
| Liver | 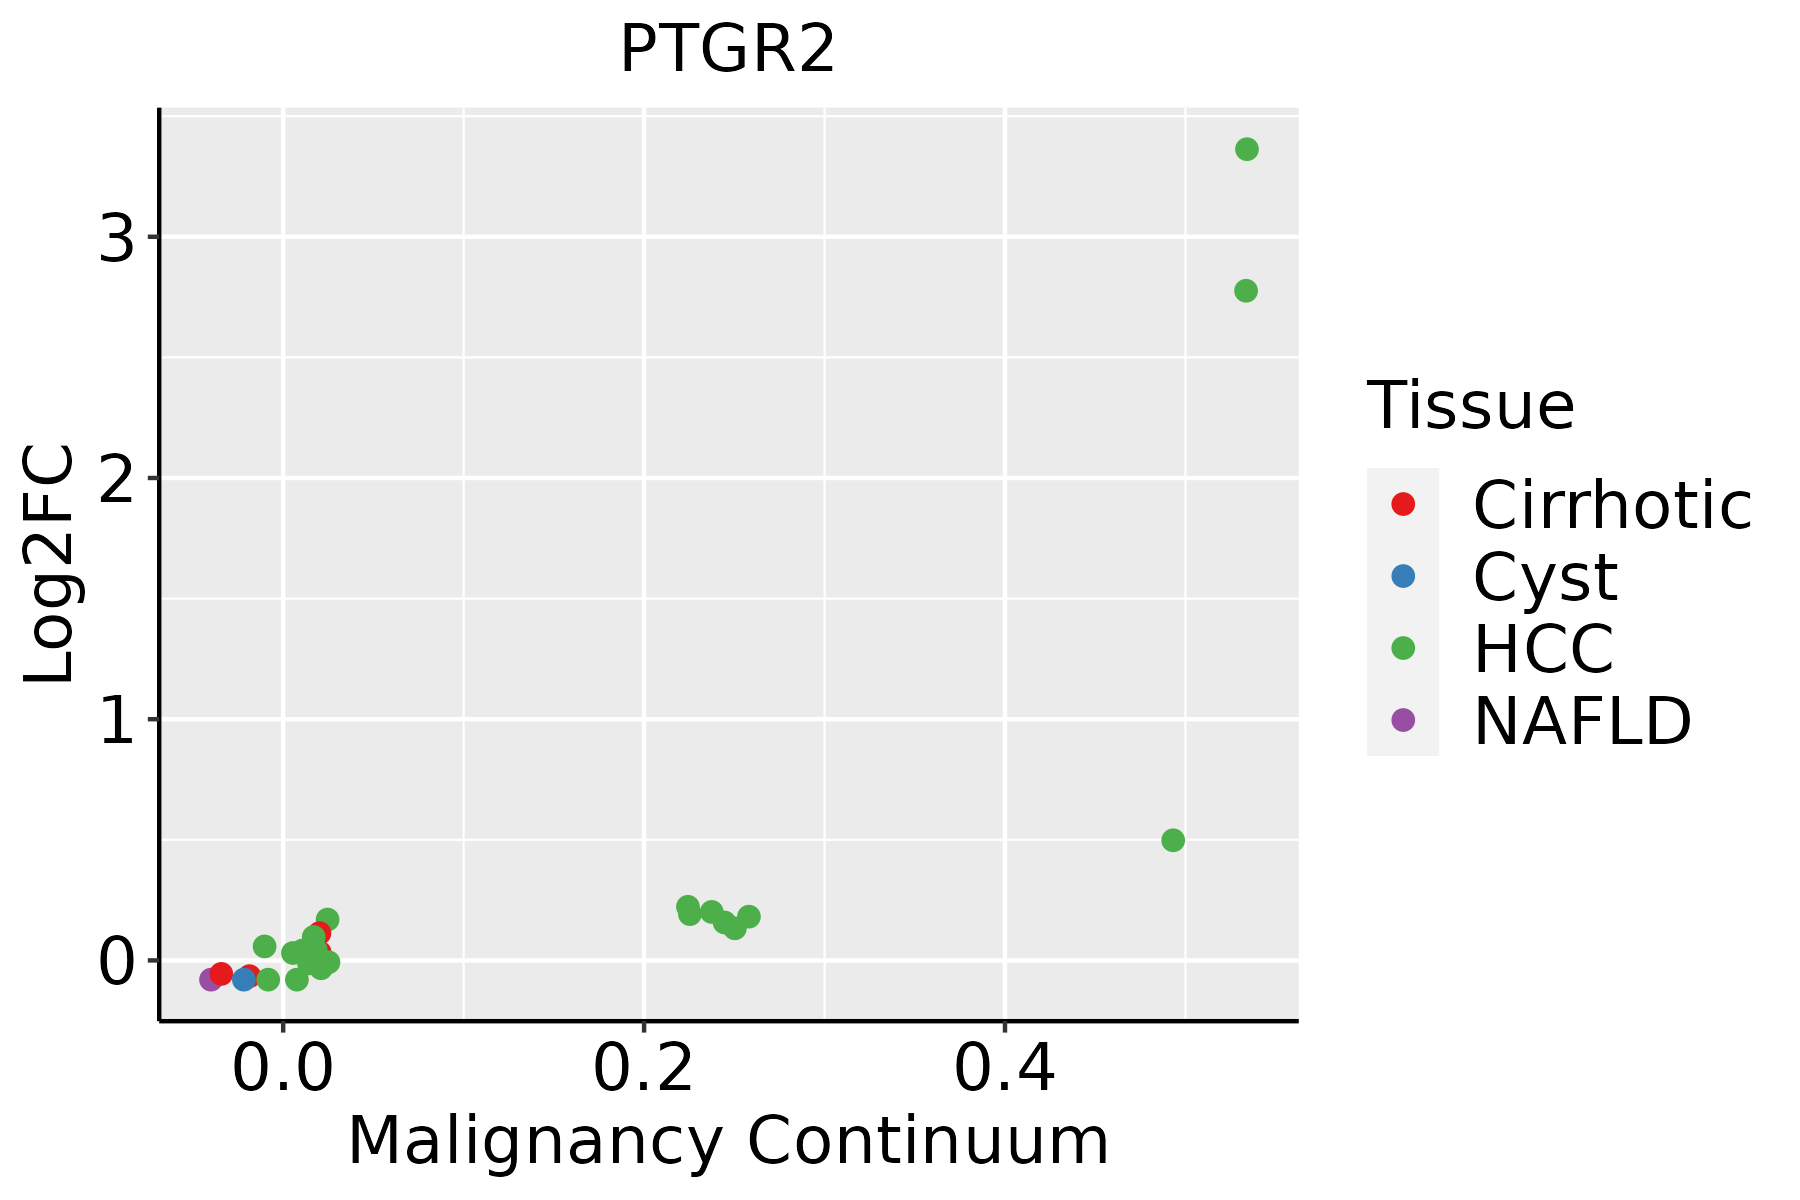 | HCC: Hepatocellular carcinoma |
| NAFLD: Non-alcoholic fatty liver disease |
| ∗log2FC in expression of this searched gene in stem-like cells from each diseased tissue sample relative to stem-like cells in normal samples in each tissue plotted against the malignancy continuum. Samples are colored based on if they are from different disease stage. |
Top |
Malignant transformation related pathway analysis |
| Find out the enriched GO biological processes and KEGG pathways involved in transition from healthy to precancer to cancer |
| Tissue | Disease Stage | Enriched GO biological Processes |
| Colorectum | AD |  |
| Colorectum | SER |  |
| Colorectum | MSS |  |
| Colorectum | MSI-H |  |
| Colorectum | FAP |  |
| ∗Top 15 enriched GO BP terms are showed in the bar plot of each disease state in each tissue. Each row represents a significant GO biological process which is colored according to the -log10(p.adjust). |
| Page: 1 2 3 4 5 6 7 8 9 |
| GO ID | Tissue | Disease Stage | Description | Gene Ratio | Bg Ratio | pvalue | p.adjust | Count |
| GO:000663112 | Liver | Cirrhotic | fatty acid metabolic process | 165/4634 | 390/18723 | 1.29e-14 | 1.26e-12 | 165 |
| GO:00066926 | Liver | Cirrhotic | prostanoid metabolic process | 22/4634 | 49/18723 | 1.64e-03 | 1.05e-02 | 22 |
| GO:00066936 | Liver | Cirrhotic | prostaglandin metabolic process | 22/4634 | 49/18723 | 1.64e-03 | 1.05e-02 | 22 |
| GO:003355911 | Liver | Cirrhotic | unsaturated fatty acid metabolic process | 43/4634 | 116/18723 | 2.09e-03 | 1.29e-02 | 43 |
| GO:000663122 | Liver | HCC | fatty acid metabolic process | 238/7958 | 390/18723 | 8.24e-14 | 4.84e-12 | 238 |
| Page: 1 |
| Pathway ID | Tissue | Disease Stage | Description | Gene Ratio | Bg Ratio | pvalue | p.adjust | qvalue | Count |
| Page: 1 |
Top |
Cell-cell communication analysis |
| Identification of potential cell-cell interactions between two cell types and their ligand-receptor pairs for different disease states |
| Ligand | Receptor | LRpair | Pathway | Tissue | Disease Stage |
| Page: 1 |
Top |
Single-cell gene regulatory network inference analysis |
| Find out the significant the regulons (TFs) and the target genes of each regulon across cell types for different disease states |
| TF | Cell Type | Tissue | Disease Stage | Target Gene | RSS | Regulon Activity |
| ∗The dot plots of a searched regulon are shown for all cell subpopulations in each disease state of each tissue based on the regulon specific score inferred using pySCENIC and by calculating the average expression. |
| Page: 1 |
Top |
Somatic mutation of malignant transformation related genes |
| Annotation of somatic variants for genes involved in malignant transformation |
| Hugo Symbol | Variant Class | Variant Classification | dbSNP RS | HGVSc | HGVSp | HGVSp Short | SWISSPROT | BIOTYPE | SIFT | PolyPhen | Tumor Sample Barcode | Tissue | Histology | Sex | Age | Stage | Therapy Types | Drugs | Outcome |
| PTGR2 | SNV | Missense_Mutation | c.754C>A | p.Leu252Met | p.L252M | Q8N8N7 | protein_coding | deleterious(0) | probably_damaging(0.999) | TCGA-A8-A09Z-01 | Breast | breast invasive carcinoma | Female | >=65 | I/II | Unknown | Unknown | SD | |
| PTGR2 | SNV | Missense_Mutation | c.754N>A | p.Leu252Met | p.L252M | Q8N8N7 | protein_coding | deleterious(0) | probably_damaging(0.999) | TCGA-AA-3966-01 | Colorectum | colon adenocarcinoma | Female | >=65 | I/II | Unknown | Unknown | SD | |
| PTGR2 | SNV | Missense_Mutation | novel | c.839N>T | p.Arg280Ile | p.R280I | Q8N8N7 | protein_coding | deleterious(0) | possibly_damaging(0.641) | TCGA-AZ-4315-01 | Colorectum | colon adenocarcinoma | Male | <65 | I/II | Unknown | Unknown | SD |
| PTGR2 | SNV | Missense_Mutation | novel | c.723A>G | p.Ile241Met | p.I241M | Q8N8N7 | protein_coding | tolerated(0.06) | probably_damaging(0.946) | TCGA-AG-A002-01 | Colorectum | rectum adenocarcinoma | Male | <65 | I/II | Unknown | Unknown | SD |
| PTGR2 | deletion | Frame_Shift_Del | c.39delN | p.Asn15MetfsTer42 | p.N15Mfs*42 | Q8N8N7 | protein_coding | TCGA-A6-2686-01 | Colorectum | colon adenocarcinoma | Female | >=65 | I/II | Unknown | Unknown | SD | |||
| PTGR2 | SNV | Missense_Mutation | novel | c.266N>G | p.Asn89Ser | p.N89S | Q8N8N7 | protein_coding | tolerated(0.72) | benign(0) | TCGA-AJ-A3EK-01 | Endometrium | uterine corpus endometrioid carcinoma | Female | <65 | I/II | Chemotherapy | carboplatin | CR |
| PTGR2 | SNV | Missense_Mutation | novel | c.428N>A | p.Gly143Glu | p.G143E | Q8N8N7 | protein_coding | deleterious(0) | probably_damaging(0.998) | TCGA-AP-A0LM-01 | Endometrium | uterine corpus endometrioid carcinoma | Female | <65 | III/IV | Chemotherapy | cisplatin | SD |
| PTGR2 | SNV | Missense_Mutation | novel | c.212N>A | p.Ser71Tyr | p.S71Y | Q8N8N7 | protein_coding | tolerated(0.05) | benign(0.211) | TCGA-AP-A1E0-01 | Endometrium | uterine corpus endometrioid carcinoma | Female | <65 | III/IV | Chemotherapy | paclitaxel | SD |
| PTGR2 | SNV | Missense_Mutation | novel | c.857N>T | p.Arg286Ile | p.R286I | Q8N8N7 | protein_coding | deleterious(0.03) | possibly_damaging(0.571) | TCGA-AX-A2HC-01 | Endometrium | uterine corpus endometrioid carcinoma | Female | <65 | III/IV | Chemotherapy | paclitaxel | PD |
| PTGR2 | SNV | Missense_Mutation | novel | c.1016G>T | p.Gly339Val | p.G339V | Q8N8N7 | protein_coding | deleterious(0) | probably_damaging(1) | TCGA-B5-A0KB-01 | Endometrium | uterine corpus endometrioid carcinoma | Female | <65 | I/II | Chemotherapy | paclitaxel | PD |
| Page: 1 2 |
Top |
Related drugs of malignant transformation related genes |
| Identification of chemicals and drugs interact with genes involved in malignant transfromation |
| (DGIdb 4.0) |
| Entrez ID | Symbol | Category | Interaction Types | Drug Claim Name | Drug Name | PMIDs |
| Page: 1 |

Copyright 2023-Present -The University of Texas Health Science Center at Houston |