
|
|||||
|
 | |
| |
| |
| |
| |
| |
|
Gene: PTGFRN |
Gene summary for PTGFRN |
| Gene information | Species | Human | Gene symbol | PTGFRN | Gene ID | 5738 |
| Gene name | prostaglandin F2 receptor inhibitor | |
| Gene Alias | CD315 | |
| Cytomap | 1p13.1 | |
| Gene Type | protein-coding | GO ID | GO:0000768 | UniProtAcc | Q9P2B2 |
Top |
Malignant transformation analysis |
| Identification of the aberrant gene expression in precancerous and cancerous lesions by comparing the gene expression of stem-like cells in diseased tissues with normal stem cells |
| Entrez ID | Symbol | Replicates | Species | Organ | Tissue | Adj P-value | Log2FC | Malignancy |
| 5738 | PTGFRN | CCI_1 | Human | Cervix | CC | 3.64e-04 | 5.99e-01 | 0.528 |
| 5738 | PTGFRN | CCI_3 | Human | Cervix | CC | 5.21e-06 | 5.79e-01 | 0.516 |
| 5738 | PTGFRN | Tumor | Human | Cervix | CC | 1.20e-08 | 3.21e-01 | 0.1241 |
| 5738 | PTGFRN | sample3 | Human | Cervix | CC | 1.45e-06 | 2.83e-01 | 0.1387 |
| 5738 | PTGFRN | T3 | Human | Cervix | CC | 1.17e-09 | 2.71e-01 | 0.1389 |
| 5738 | PTGFRN | LZE4T | Human | Esophagus | ESCC | 1.15e-13 | 1.63e-01 | 0.0811 |
| 5738 | PTGFRN | LZE7T | Human | Esophagus | ESCC | 3.50e-05 | 1.18e-01 | 0.0667 |
| 5738 | PTGFRN | LZE8T | Human | Esophagus | ESCC | 5.85e-04 | -4.42e-02 | 0.067 |
| 5738 | PTGFRN | LZE22T | Human | Esophagus | ESCC | 5.38e-04 | 1.63e-01 | 0.068 |
| 5738 | PTGFRN | LZE24T | Human | Esophagus | ESCC | 5.47e-12 | 6.57e-02 | 0.0596 |
| 5738 | PTGFRN | LZE21T | Human | Esophagus | ESCC | 2.48e-03 | 5.38e-02 | 0.0655 |
| 5738 | PTGFRN | P2T-E | Human | Esophagus | ESCC | 2.33e-21 | 2.79e-01 | 0.1177 |
| 5738 | PTGFRN | P4T-E | Human | Esophagus | ESCC | 5.66e-09 | 2.37e-01 | 0.1323 |
| 5738 | PTGFRN | P5T-E | Human | Esophagus | ESCC | 6.00e-23 | 2.77e-01 | 0.1327 |
| 5738 | PTGFRN | P8T-E | Human | Esophagus | ESCC | 6.33e-22 | 1.67e-01 | 0.0889 |
| 5738 | PTGFRN | P9T-E | Human | Esophagus | ESCC | 2.95e-15 | 1.79e-01 | 0.1131 |
| 5738 | PTGFRN | P10T-E | Human | Esophagus | ESCC | 3.23e-28 | 6.11e-01 | 0.116 |
| 5738 | PTGFRN | P11T-E | Human | Esophagus | ESCC | 4.79e-04 | 2.41e-01 | 0.1426 |
| 5738 | PTGFRN | P12T-E | Human | Esophagus | ESCC | 2.10e-21 | 5.62e-01 | 0.1122 |
| 5738 | PTGFRN | P15T-E | Human | Esophagus | ESCC | 1.74e-16 | 2.72e-01 | 0.1149 |
| Page: 1 2 3 4 5 6 |
| Tissue | Expression Dynamics | Abbreviation |
| Cervix | 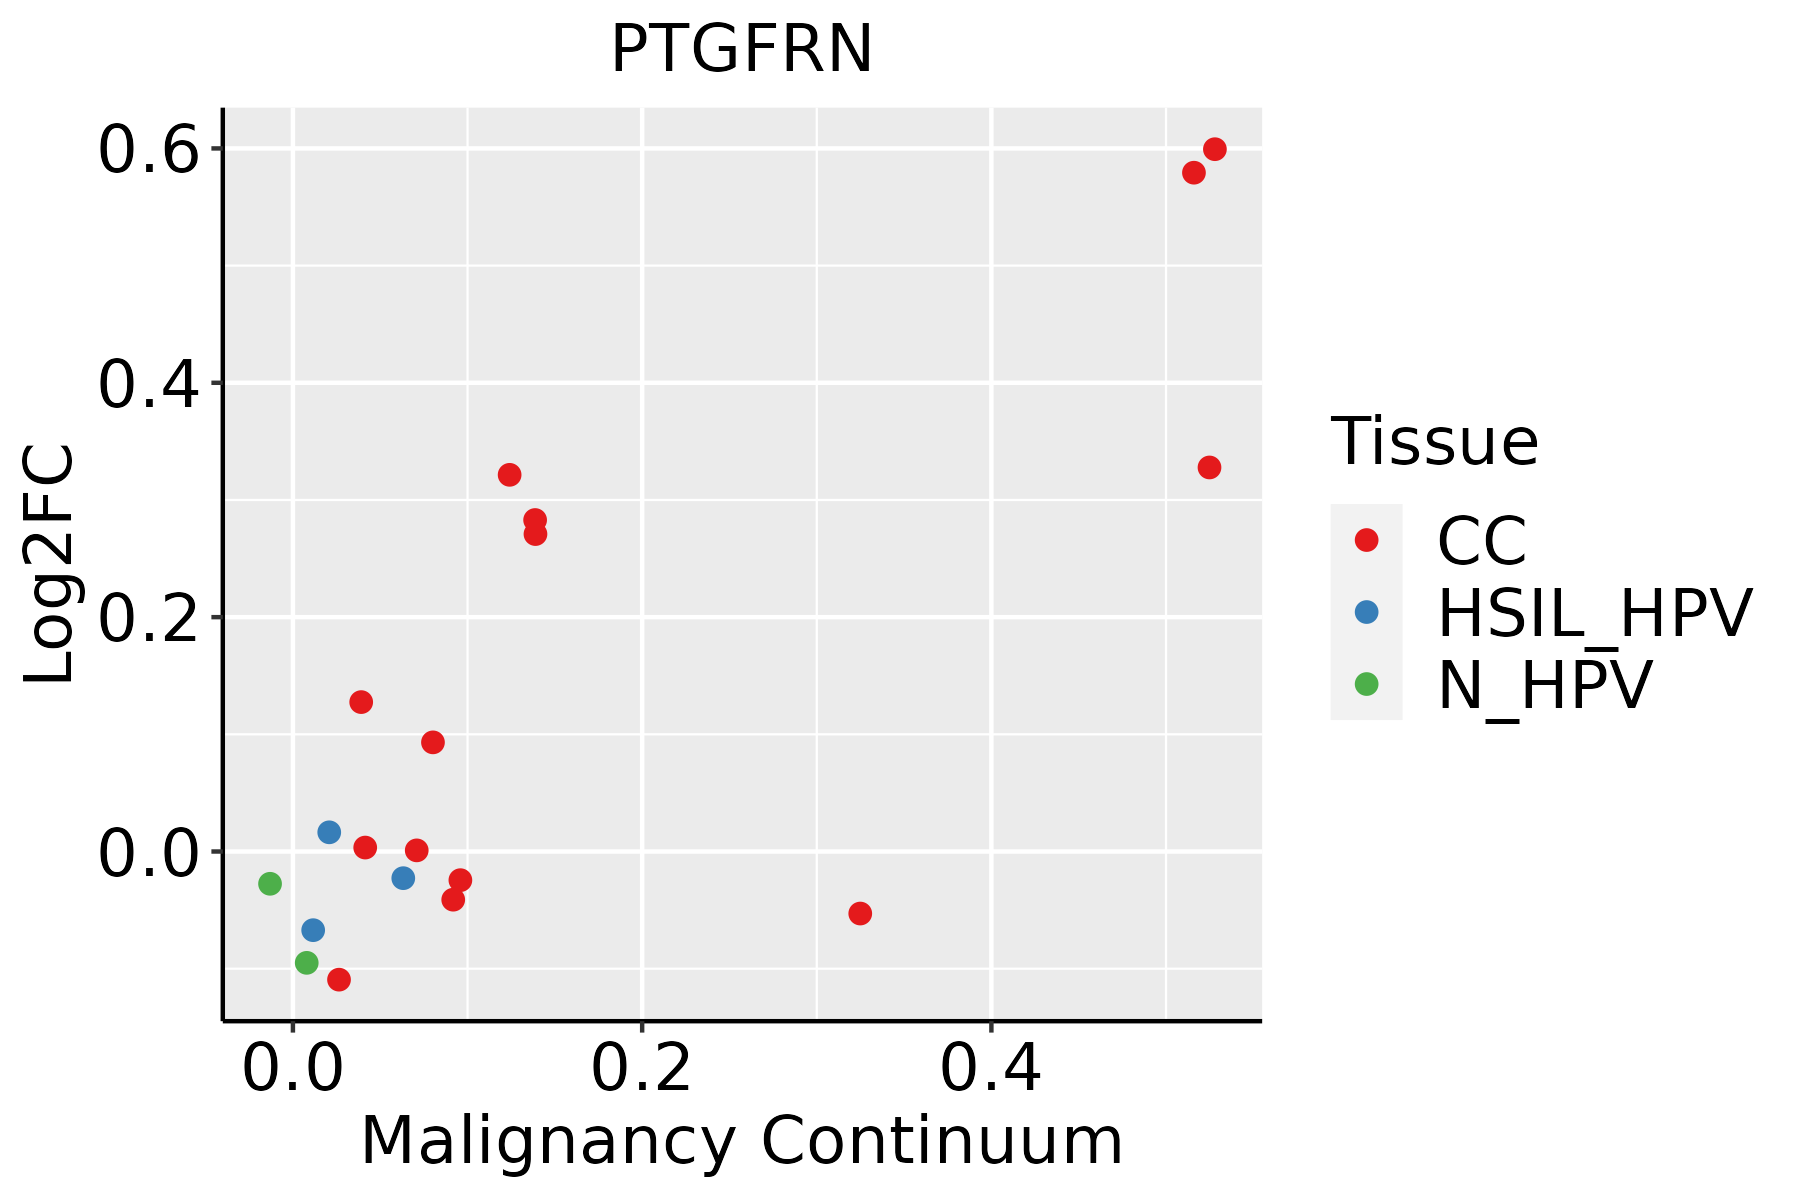 | CC: Cervix cancer |
| HSIL_HPV: HPV-infected high-grade squamous intraepithelial lesions | ||
| N_HPV: HPV-infected normal cervix | ||
| Esophagus | 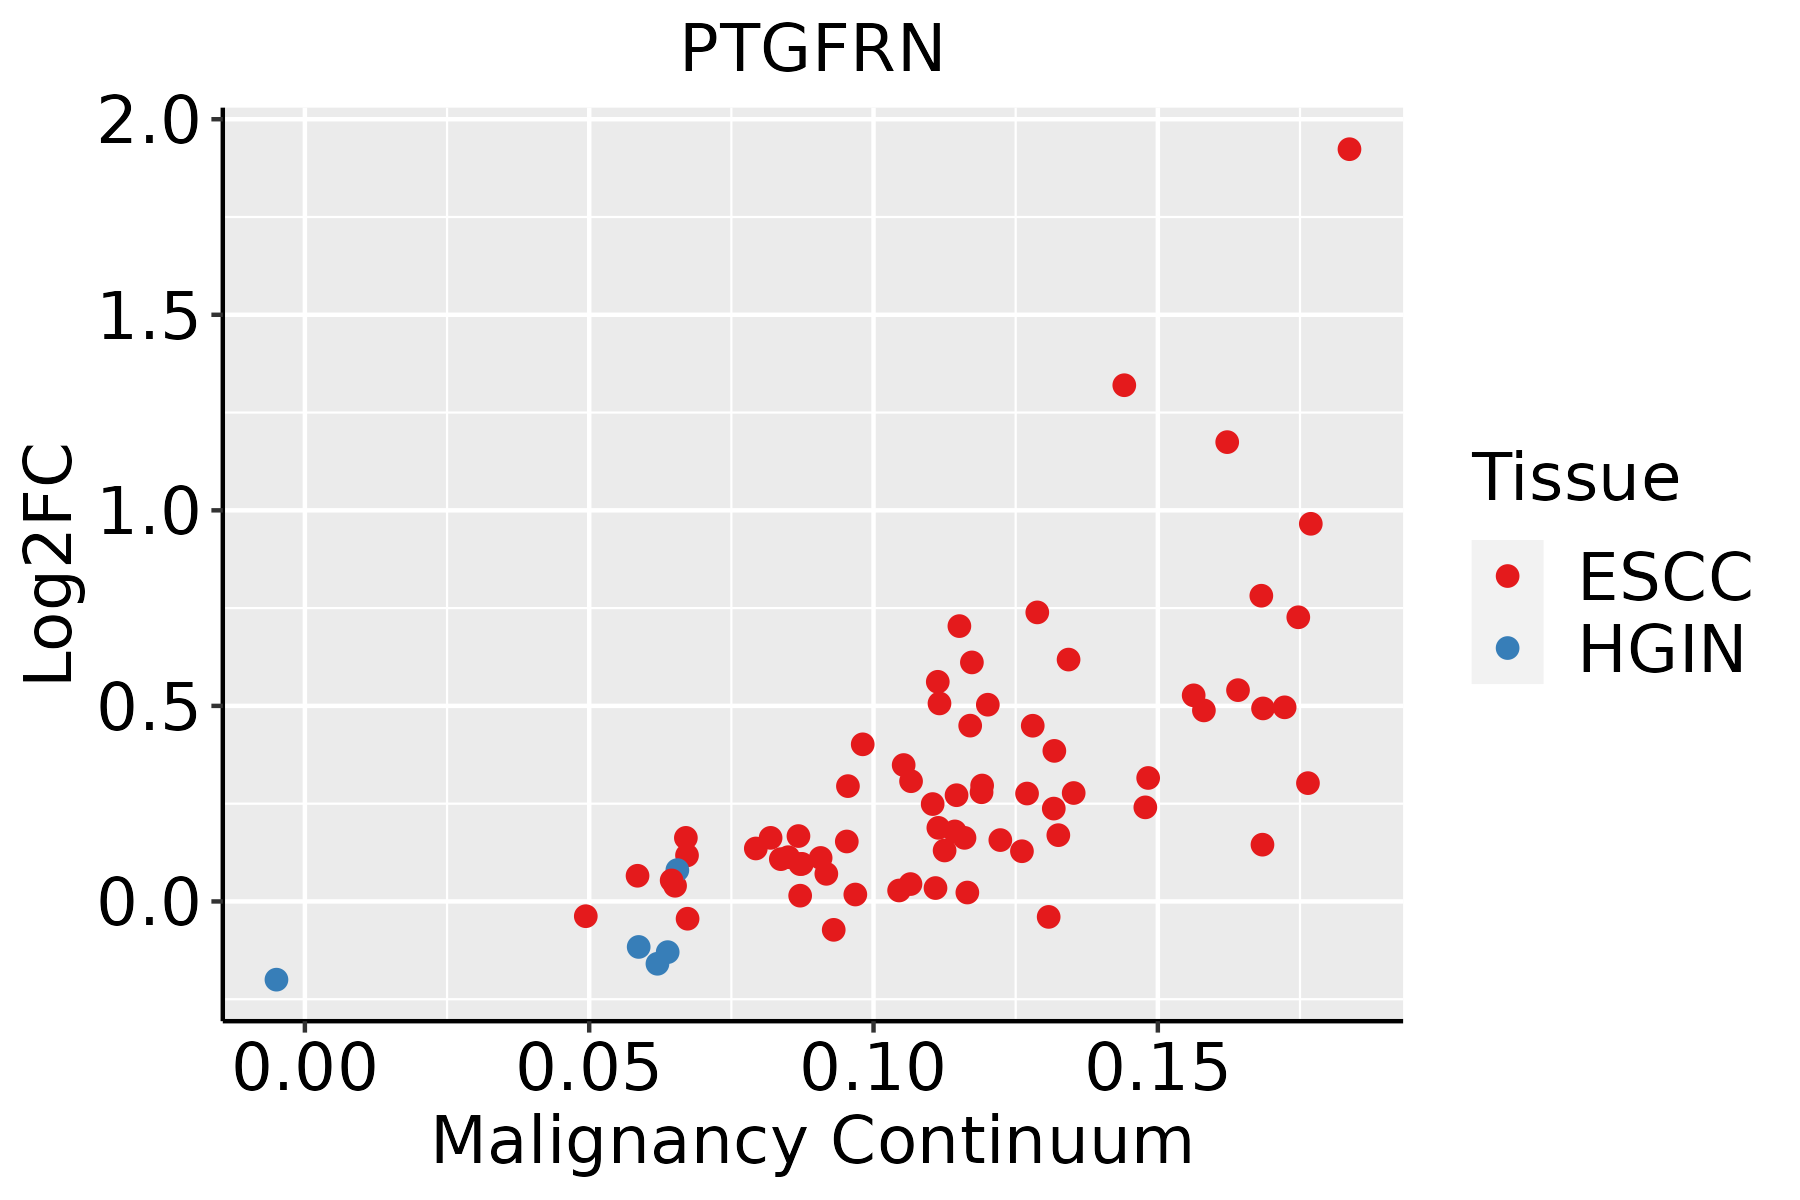 | ESCC: Esophageal squamous cell carcinoma |
| HGIN: High-grade intraepithelial neoplasias | ||
| LGIN: Low-grade intraepithelial neoplasias | ||
| Liver | 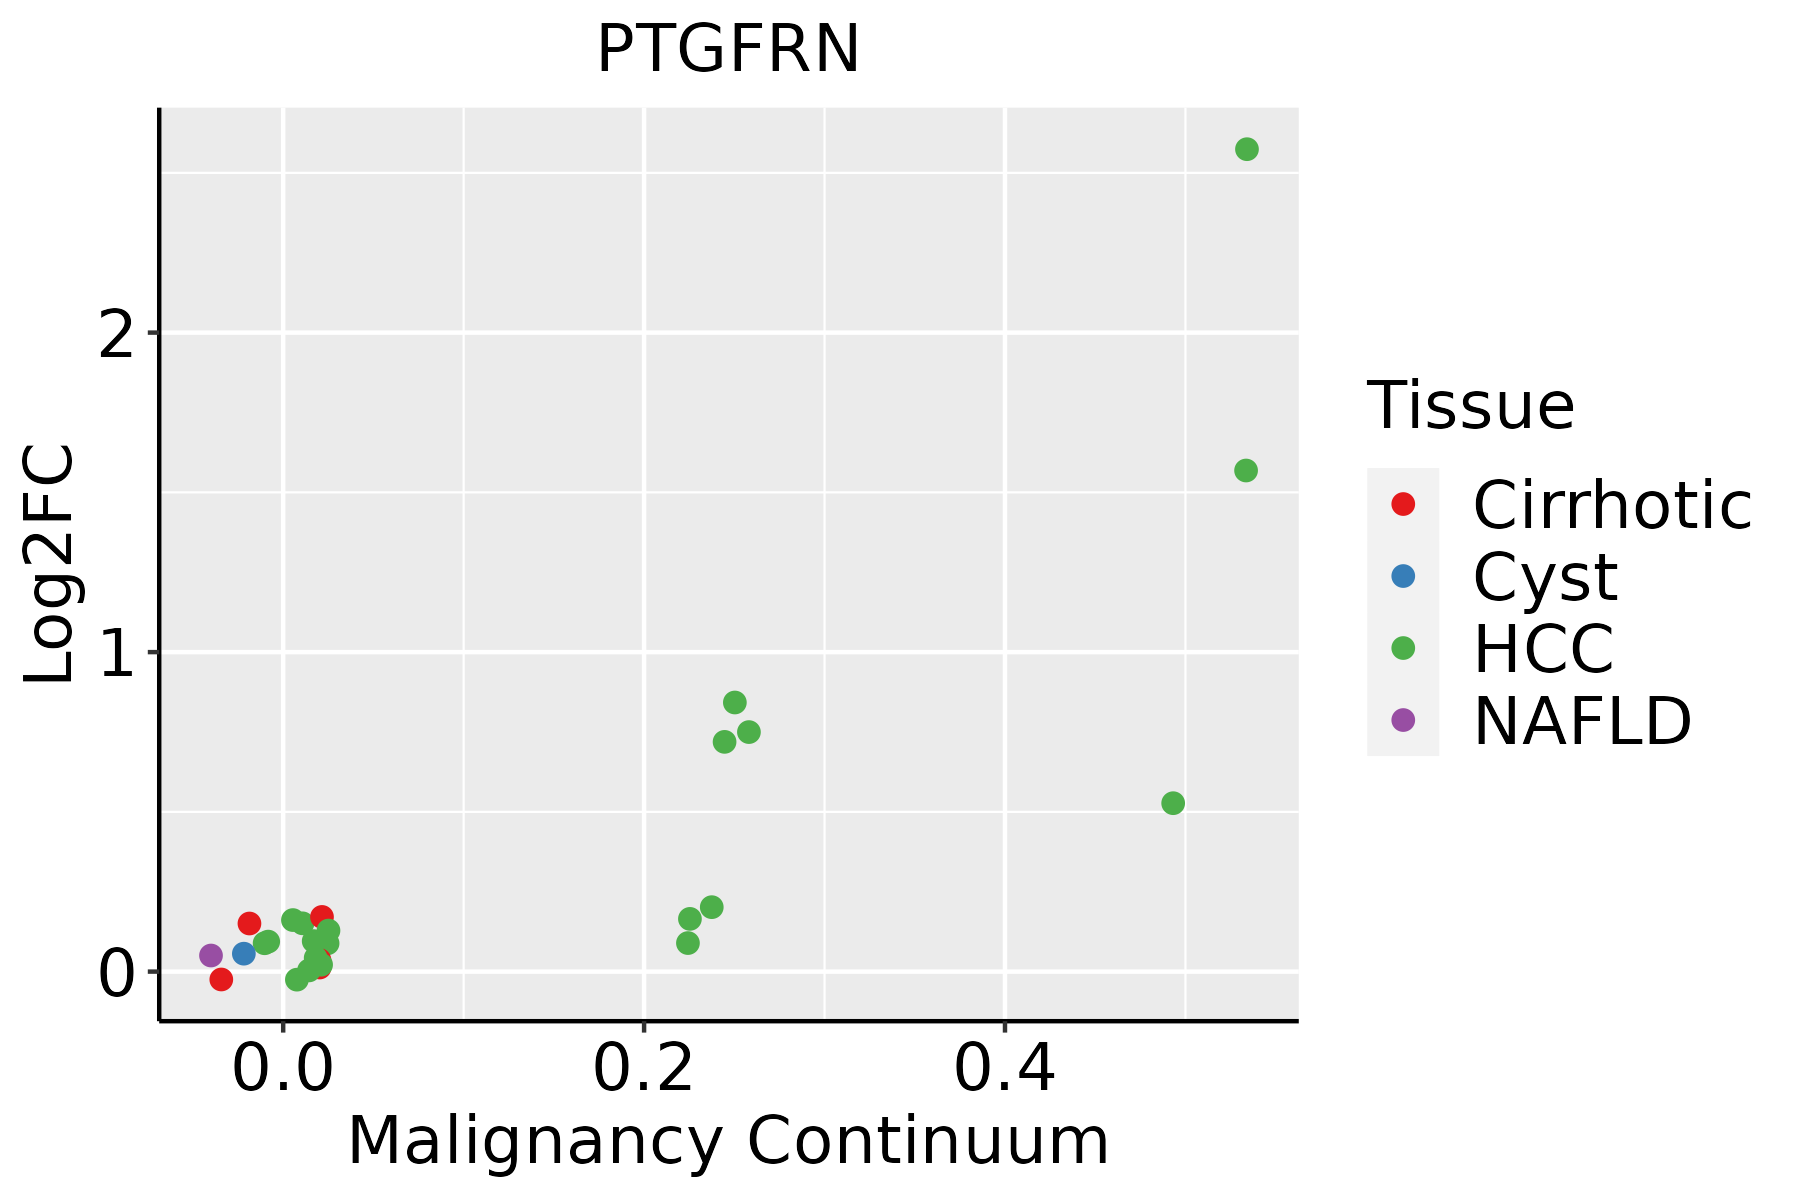 | HCC: Hepatocellular carcinoma |
| NAFLD: Non-alcoholic fatty liver disease | ||
| Oral Cavity | 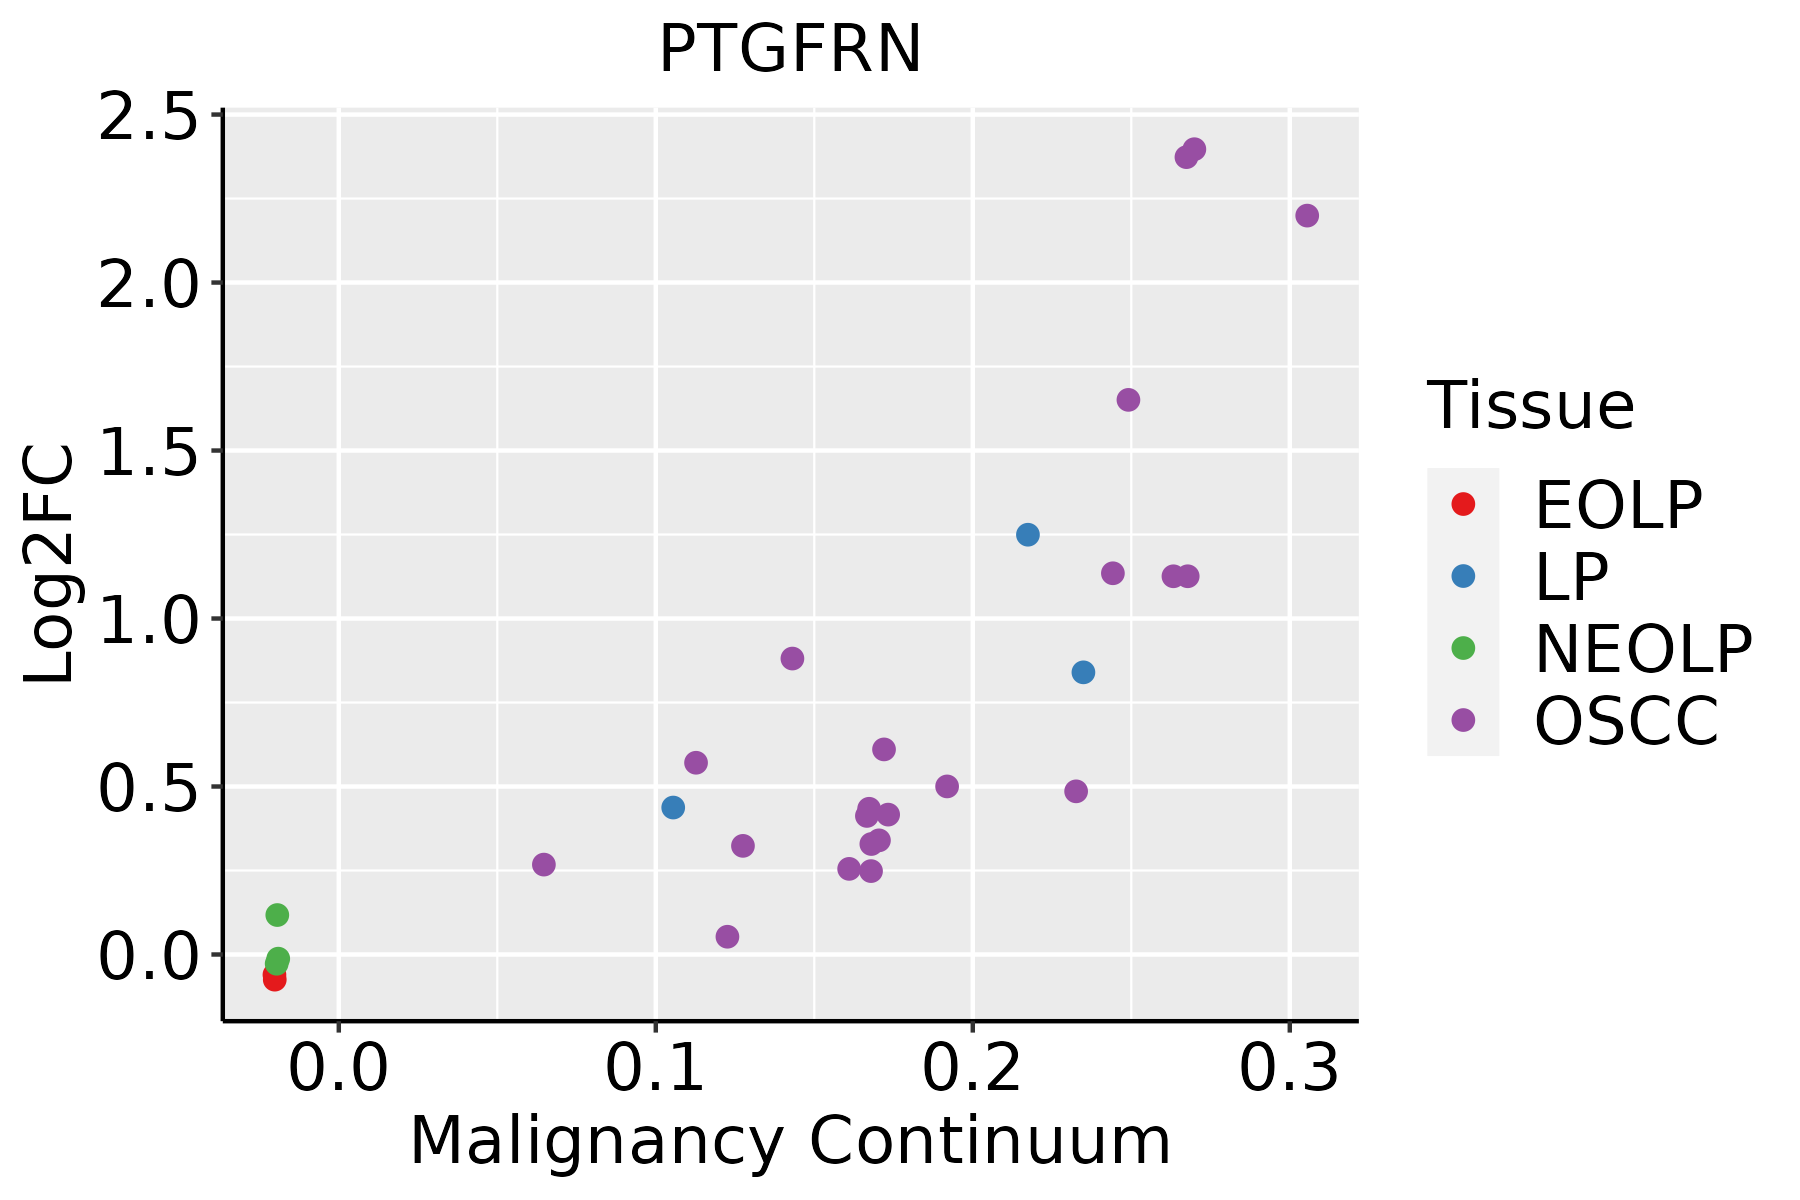 | EOLP: Erosive Oral lichen planus |
| LP: leukoplakia | ||
| NEOLP: Non-erosive oral lichen planus | ||
| OSCC: Oral squamous cell carcinoma | ||
| Prostate | 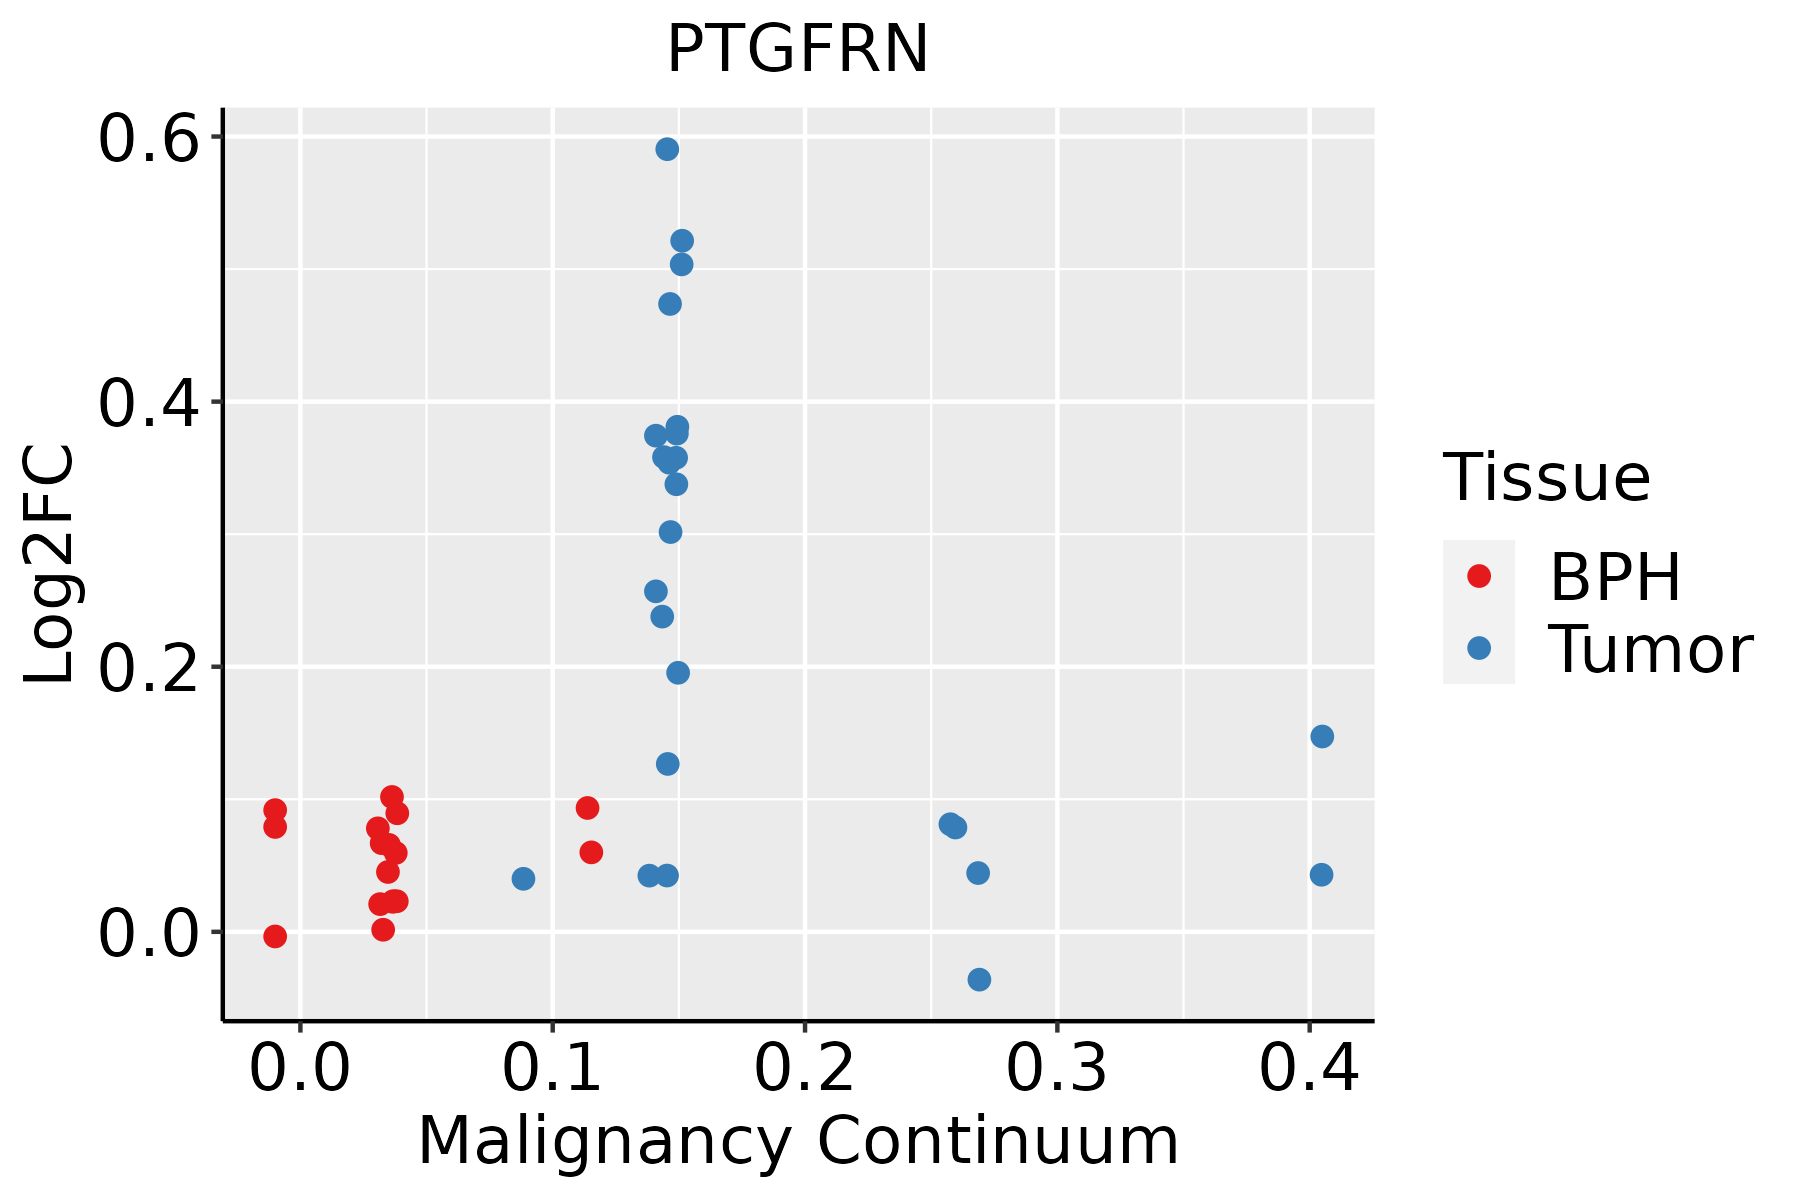 | BPH: Benign Prostatic Hyperplasia |
| Skin | 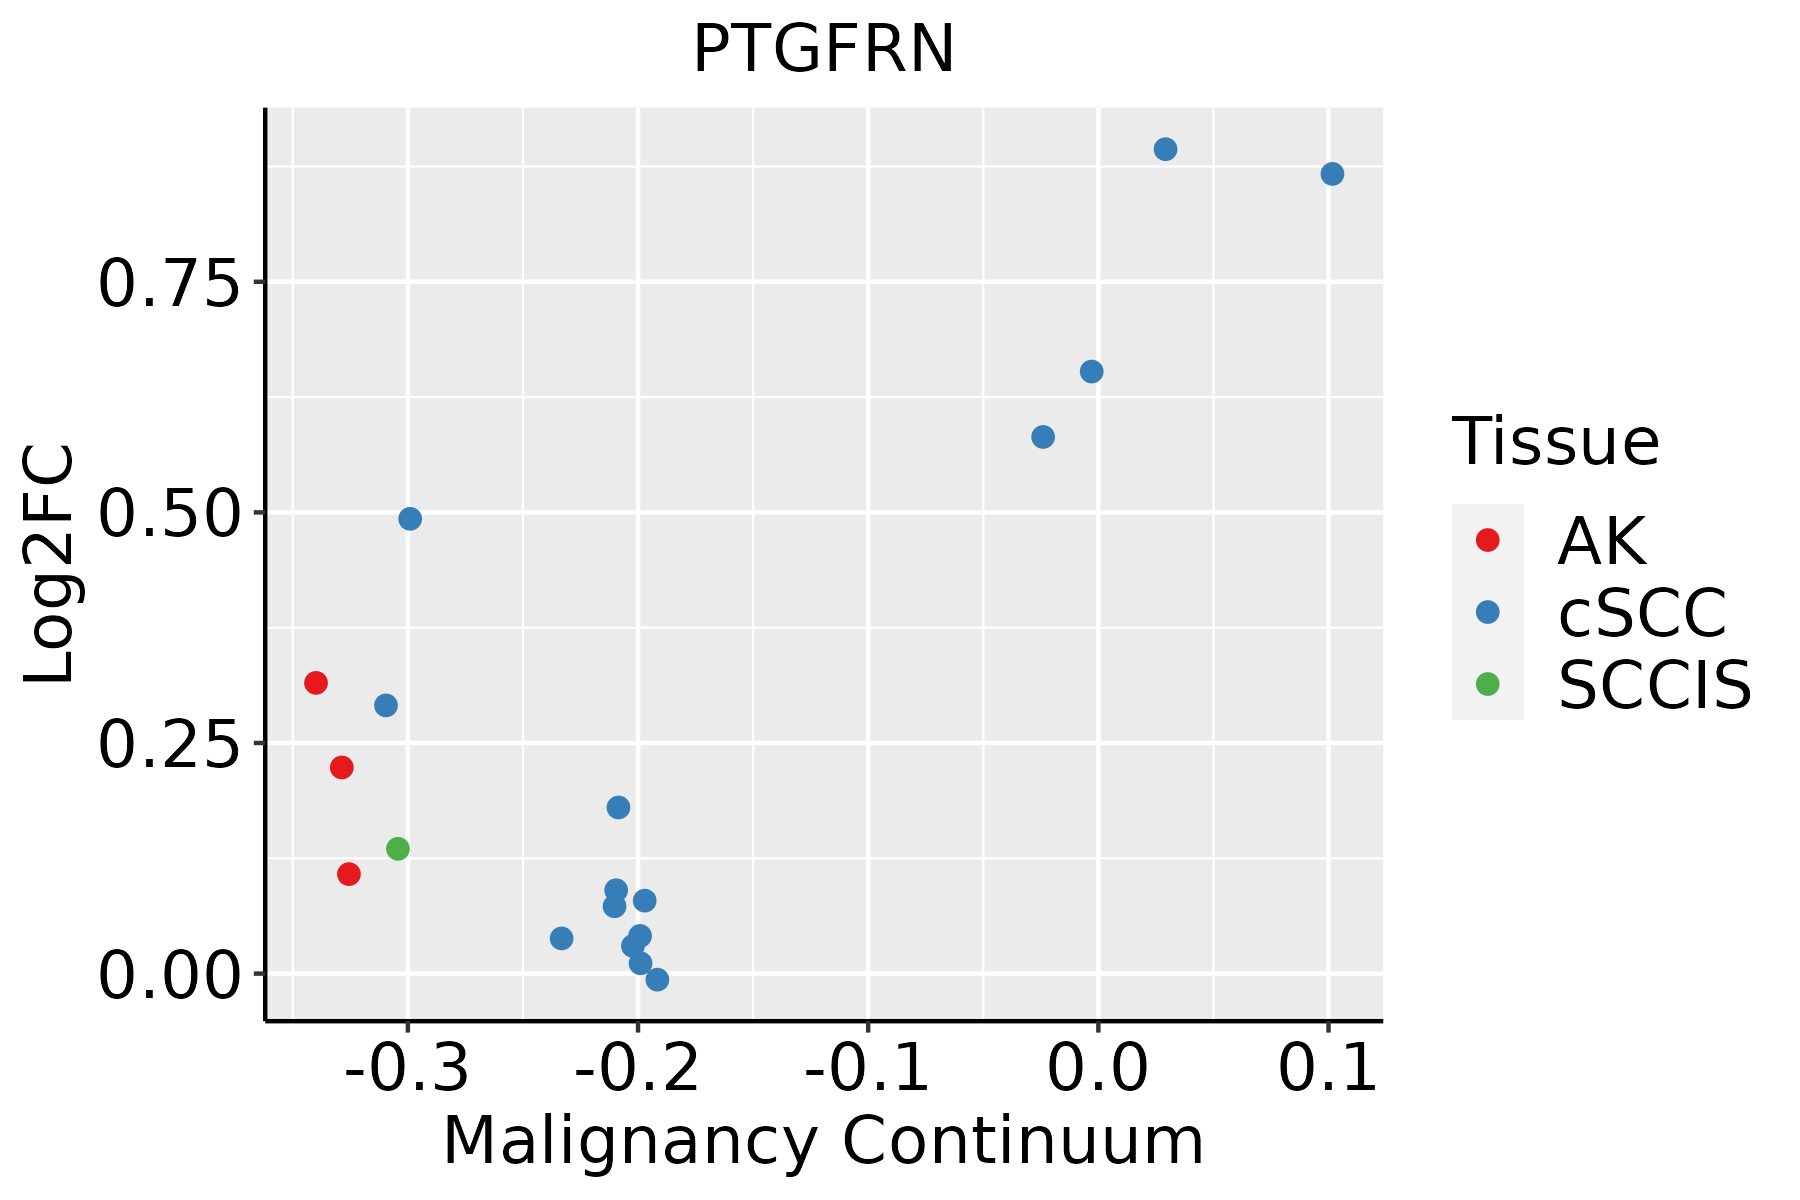 | AK: Actinic keratosis |
| cSCC: Cutaneous squamous cell carcinoma | ||
| SCCIS:squamous cell carcinoma in situ |
| ∗log2FC in expression of this searched gene in stem-like cells from each diseased tissue sample relative to stem-like cells in normal samples in each tissue plotted against the malignancy continuum. Samples are colored based on if they are from different disease stage. |
Top |
Malignant transformation related pathway analysis |
| Find out the enriched GO biological processes and KEGG pathways involved in transition from healthy to precancer to cancer |
| Tissue | Disease Stage | Enriched GO biological Processes |
| Colorectum | AD |  |
| Colorectum | SER |  |
| Colorectum | MSS |  |
| Colorectum | MSI-H |  |
| Colorectum | FAP |  |
| ∗Top 15 enriched GO BP terms are showed in the bar plot of each disease state in each tissue. Each row represents a significant GO biological process which is colored according to the -log10(p.adjust). |
| Page: 1 2 3 4 5 6 7 8 9 |
| GO ID | Tissue | Disease Stage | Description | Gene Ratio | Bg Ratio | pvalue | p.adjust | Count |
| GO:00310996 | Cervix | CC | regeneration | 46/2311 | 198/18723 | 1.43e-05 | 2.84e-04 | 46 |
| GO:00426924 | Cervix | CC | muscle cell differentiation | 69/2311 | 384/18723 | 8.12e-04 | 7.09e-03 | 69 |
| GO:0042246 | Cervix | CC | tissue regeneration | 19/2311 | 72/18723 | 9.11e-04 | 7.81e-03 | 19 |
| GO:00434032 | Cervix | CC | skeletal muscle tissue regeneration | 12/2311 | 37/18723 | 1.15e-03 | 9.39e-03 | 12 |
| GO:0000768 | Cervix | CC | syncytium formation by plasma membrane fusion | 15/2311 | 55/18723 | 2.14e-03 | 1.54e-02 | 15 |
| GO:0140253 | Cervix | CC | cell-cell fusion | 15/2311 | 55/18723 | 2.14e-03 | 1.54e-02 | 15 |
| GO:00069491 | Cervix | CC | syncytium formation | 15/2311 | 57/18723 | 3.13e-03 | 2.05e-02 | 15 |
| GO:00511464 | Cervix | CC | striated muscle cell differentiation | 50/2311 | 283/18723 | 5.53e-03 | 3.19e-02 | 50 |
| GO:003109910 | Esophagus | ESCC | regeneration | 122/8552 | 198/18723 | 4.26e-06 | 4.57e-05 | 122 |
| GO:003109911 | Liver | Cirrhotic | regeneration | 71/4634 | 198/18723 | 3.02e-04 | 2.65e-03 | 71 |
| GO:00310992 | Liver | HCC | regeneration | 107/7958 | 198/18723 | 6.67e-04 | 4.12e-03 | 107 |
| GO:00310999 | Oral cavity | OSCC | regeneration | 114/7305 | 198/18723 | 8.54e-08 | 1.50e-06 | 114 |
| GO:00422464 | Oral cavity | OSCC | tissue regeneration | 42/7305 | 72/18723 | 6.89e-04 | 3.84e-03 | 42 |
| GO:00434034 | Oral cavity | OSCC | skeletal muscle tissue regeneration | 23/7305 | 37/18723 | 3.66e-03 | 1.51e-02 | 23 |
| GO:00426927 | Oral cavity | OSCC | muscle cell differentiation | 175/7305 | 384/18723 | 4.79e-03 | 1.92e-02 | 175 |
| GO:003109916 | Oral cavity | LP | regeneration | 76/4623 | 198/18723 | 1.25e-05 | 2.24e-04 | 76 |
| GO:00422461 | Oral cavity | LP | tissue regeneration | 30/4623 | 72/18723 | 1.13e-03 | 9.27e-03 | 30 |
| GO:004340311 | Oral cavity | LP | skeletal muscle tissue regeneration | 18/4623 | 37/18723 | 1.36e-03 | 1.08e-02 | 18 |
| GO:003109915 | Prostate | Tumor | regeneration | 54/3246 | 198/18723 | 3.07e-04 | 2.47e-03 | 54 |
| GO:004269213 | Prostate | Tumor | muscle cell differentiation | 93/3246 | 384/18723 | 3.45e-04 | 2.73e-03 | 93 |
| Page: 1 2 |
| Pathway ID | Tissue | Disease Stage | Description | Gene Ratio | Bg Ratio | pvalue | p.adjust | qvalue | Count |
| Page: 1 |
Top |
Cell-cell communication analysis |
| Identification of potential cell-cell interactions between two cell types and their ligand-receptor pairs for different disease states |
| Ligand | Receptor | LRpair | Pathway | Tissue | Disease Stage |
| Page: 1 |
Top |
Single-cell gene regulatory network inference analysis |
| Find out the significant the regulons (TFs) and the target genes of each regulon across cell types for different disease states |
| TF | Cell Type | Tissue | Disease Stage | Target Gene | RSS | Regulon Activity |
| ∗The dot plots of a searched regulon are shown for all cell subpopulations in each disease state of each tissue based on the regulon specific score inferred using pySCENIC and by calculating the average expression. |
| Page: 1 |
Top |
Somatic mutation of malignant transformation related genes |
| Annotation of somatic variants for genes involved in malignant transformation |
| Hugo Symbol | Variant Class | Variant Classification | dbSNP RS | HGVSc | HGVSp | HGVSp Short | SWISSPROT | BIOTYPE | SIFT | PolyPhen | Tumor Sample Barcode | Tissue | Histology | Sex | Age | Stage | Therapy Types | Drugs | Outcome |
| PTGFRN | SNV | Missense_Mutation | novel | c.2609G>C | p.Arg870Pro | p.R870P | Q9P2B2 | protein_coding | deleterious(0) | probably_damaging(0.968) | TCGA-A2-A0CP-01 | Breast | breast invasive carcinoma | Female | <65 | I/II | Chemotherapy | cytoxan | SD |
| PTGFRN | SNV | Missense_Mutation | c.287N>A | p.Arg96Gln | p.R96Q | Q9P2B2 | protein_coding | deleterious(0) | probably_damaging(0.998) | TCGA-A2-A0EY-01 | Breast | breast invasive carcinoma | Female | <65 | I/II | Chemotherapy | adriamycin | SD | |
| PTGFRN | SNV | Missense_Mutation | novel | c.2330N>G | p.Leu777Trp | p.L777W | Q9P2B2 | protein_coding | tolerated(0.06) | probably_damaging(0.955) | TCGA-A8-A09D-01 | Breast | breast invasive carcinoma | Female | <65 | I/II | Chemotherapy | doxorubicin | CR |
| PTGFRN | SNV | Missense_Mutation | c.1744N>T | p.Arg582Cys | p.R582C | Q9P2B2 | protein_coding | deleterious(0.04) | probably_damaging(0.987) | TCGA-AO-A128-01 | Breast | breast invasive carcinoma | Female | <65 | I/II | Chemotherapy | doxorubicin | SD | |
| PTGFRN | SNV | Missense_Mutation | c.2170N>C | p.Asp724His | p.D724H | Q9P2B2 | protein_coding | deleterious(0) | possibly_damaging(0.823) | TCGA-BH-A0EE-01 | Breast | breast invasive carcinoma | Female | >=65 | I/II | Chemotherapy | docetaxel | SD | |
| PTGFRN | insertion | Frame_Shift_Ins | novel | c.2611_2612insTGAGCAGGGGACTGGGTAACACTAGCATCTGGAA | p.Arg871LeufsTer46 | p.R871Lfs*46 | Q9P2B2 | protein_coding | TCGA-A2-A0CP-01 | Breast | breast invasive carcinoma | Female | <65 | I/II | Chemotherapy | cytoxan | SD | ||
| PTGFRN | insertion | Frame_Shift_Ins | novel | c.2041_2042insCATCCTTCTGG | p.Ile681ThrfsTer5 | p.I681Tfs*5 | Q9P2B2 | protein_coding | TCGA-BH-A0EE-01 | Breast | breast invasive carcinoma | Female | >=65 | I/II | Chemotherapy | docetaxel | SD | ||
| PTGFRN | SNV | Missense_Mutation | rs140355100 | c.2599C>T | p.Arg867Trp | p.R867W | Q9P2B2 | protein_coding | deleterious(0.01) | probably_damaging(0.998) | TCGA-2W-A8YY-01 | Cervix | cervical & endocervical cancer | Female | <65 | I/II | Chemotherapy | cisplatin | CR |
| PTGFRN | SNV | Missense_Mutation | novel | c.698N>T | p.Ser233Leu | p.S233L | Q9P2B2 | protein_coding | tolerated(0.69) | benign(0.174) | TCGA-JW-A5VL-01 | Cervix | cervical & endocervical cancer | Female | <65 | I/II | Unknown | Unknown | SD |
| PTGFRN | SNV | Missense_Mutation | rs773910797 | c.934G>A | p.Glu312Lys | p.E312K | Q9P2B2 | protein_coding | deleterious(0.01) | probably_damaging(0.955) | TCGA-JW-AAVH-01 | Cervix | cervical & endocervical cancer | Female | <65 | I/II | Unknown | Unknown | SD |
| Page: 1 2 3 4 5 6 7 8 9 10 |
Top |
Related drugs of malignant transformation related genes |
| Identification of chemicals and drugs interact with genes involved in malignant transfromation |
| (DGIdb 4.0) |
| Entrez ID | Symbol | Category | Interaction Types | Drug Claim Name | Drug Name | PMIDs |
| Page: 1 |

Copyright 2023-Present -The University of Texas Health Science Center at Houston |