| GO ID | Tissue | Disease Stage | Description | Gene Ratio | Bg Ratio | pvalue | p.adjust | Count |
| GO:00310996 | Cervix | CC | regeneration | 46/2311 | 198/18723 | 1.43e-05 | 2.84e-04 | 46 |
| GO:00426924 | Cervix | CC | muscle cell differentiation | 69/2311 | 384/18723 | 8.12e-04 | 7.09e-03 | 69 |
| GO:0042246 | Cervix | CC | tissue regeneration | 19/2311 | 72/18723 | 9.11e-04 | 7.81e-03 | 19 |
| GO:00434032 | Cervix | CC | skeletal muscle tissue regeneration | 12/2311 | 37/18723 | 1.15e-03 | 9.39e-03 | 12 |
| GO:0000768 | Cervix | CC | syncytium formation by plasma membrane fusion | 15/2311 | 55/18723 | 2.14e-03 | 1.54e-02 | 15 |
| GO:0140253 | Cervix | CC | cell-cell fusion | 15/2311 | 55/18723 | 2.14e-03 | 1.54e-02 | 15 |
| GO:00069491 | Cervix | CC | syncytium formation | 15/2311 | 57/18723 | 3.13e-03 | 2.05e-02 | 15 |
| GO:00511464 | Cervix | CC | striated muscle cell differentiation | 50/2311 | 283/18723 | 5.53e-03 | 3.19e-02 | 50 |
| GO:003109910 | Esophagus | ESCC | regeneration | 122/8552 | 198/18723 | 4.26e-06 | 4.57e-05 | 122 |
| GO:003109911 | Liver | Cirrhotic | regeneration | 71/4634 | 198/18723 | 3.02e-04 | 2.65e-03 | 71 |
| GO:00310992 | Liver | HCC | regeneration | 107/7958 | 198/18723 | 6.67e-04 | 4.12e-03 | 107 |
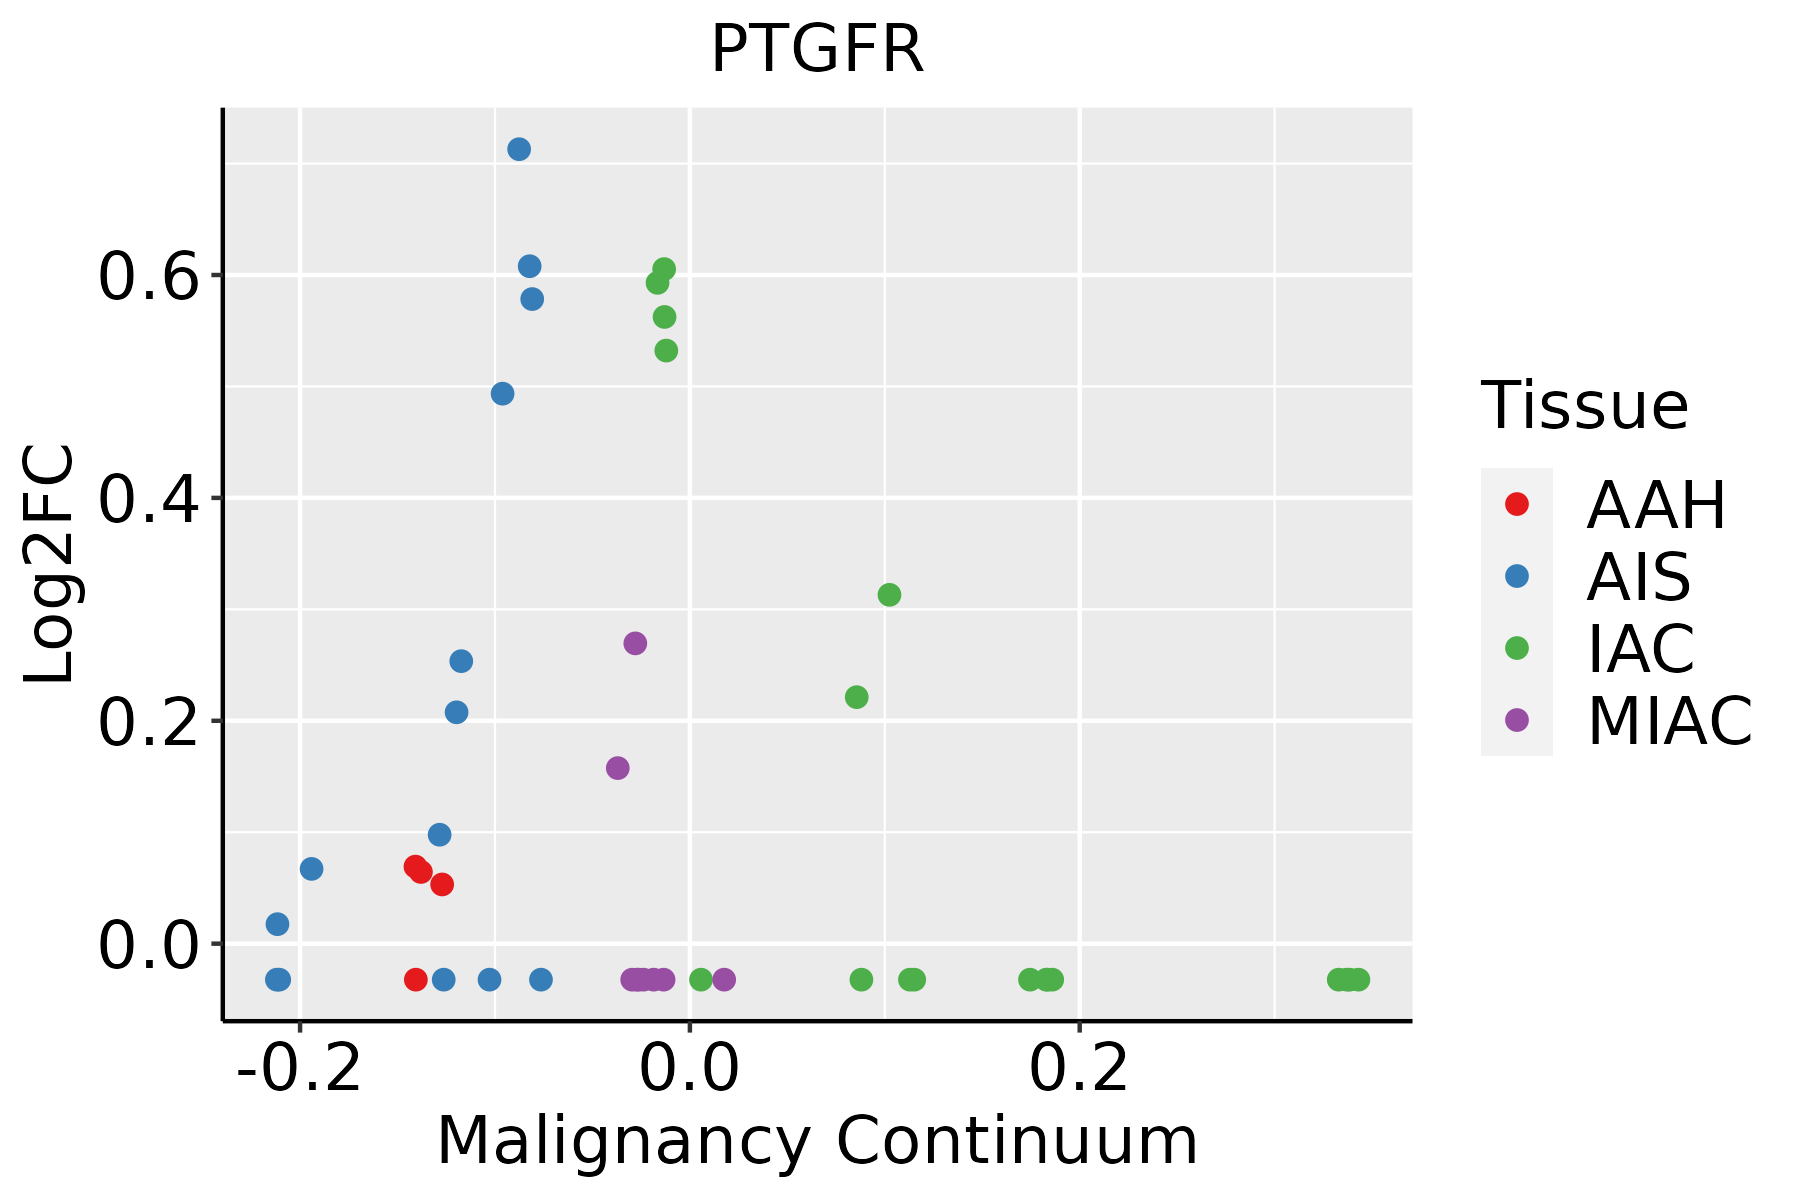
| GO:19016548 | Lung | IAC | response to ketone | 39/2061 | 194/18723 | 1.40e-04 | 2.60e-03 | 39 |
| GO:00323554 | Lung | IAC | response to estradiol | 27/2061 | 141/18723 | 2.89e-03 | 2.60e-02 | 27 |
| GO:19016553 | Lung | IAC | cellular response to ketone | 20/2061 | 96/18723 | 3.58e-03 | 3.00e-02 | 20 |
| GO:00022377 | Lung | IAC | response to molecule of bacterial origin | 56/2061 | 363/18723 | 5.78e-03 | 4.21e-02 | 56 |
| GO:00324967 | Lung | IAC | response to lipopolysaccharide | 53/2061 | 343/18723 | 6.87e-03 | 4.75e-02 | 53 |
| GO:190165413 | Lung | AIS | response to ketone | 34/1849 | 194/18723 | 6.76e-04 | 1.01e-02 | 34 |
| GO:003235511 | Lung | AIS | response to estradiol | 25/1849 | 141/18723 | 2.78e-03 | 2.77e-02 | 25 |
| GO:0019932 | Lung | AIS | second-messenger-mediated signaling | 46/1849 | 312/18723 | 3.79e-03 | 3.52e-02 | 46 |
| GO:190165511 | Lung | AIS | cellular response to ketone | 18/1849 | 96/18723 | 5.64e-03 | 4.76e-02 | 18 |
| Hugo Symbol | Variant Class | Variant Classification | dbSNP RS | HGVSc | HGVSp | HGVSp Short | SWISSPROT | BIOTYPE | SIFT | PolyPhen | Tumor Sample Barcode | Tissue | Histology | Sex | Age | Stage | Therapy Types | Drugs | Outcome |
| PTGFR | SNV | Missense_Mutation | | c.563N>C | p.Tyr188Ser | p.Y188S | P43088 | protein_coding | deleterious(0.02) | possibly_damaging(0.673) | TCGA-A8-A06U-01 | Breast | breast invasive carcinoma | Female | >=65 | I/II | Unknown | Unknown | SD |
| PTGFR | SNV | Missense_Mutation | novel | c.997N>A | p.Trp333Arg | p.W333R | P43088 | protein_coding | deleterious(0) | possibly_damaging(0.879) | TCGA-PL-A8LZ-01 | Breast | breast invasive carcinoma | Female | <65 | III/IV | Chemotherapy | paclitaxel | SD |
| PTGFR | insertion | Frame_Shift_Ins | novel | c.439_440insCACAACCTGCCAGACGGAAAACCGGCTTTCCGTATTTT | p.Ile147ThrfsTer19 | p.I147Tfs*19 | P43088 | protein_coding | | | TCGA-A8-A07J-01 | Breast | breast invasive carcinoma | Female | <65 | I/II | Chemotherapy | 5-fluorouracil | CR |
| PTGFR | insertion | Nonsense_Mutation | novel | c.631_632insGCAATCCTGCACAGTTTTGAGAGGGAGATGACTTGAGTGG | p.Leu211CysfsTer7 | p.L211Cfs*7 | P43088 | protein_coding | | | TCGA-A8-A08Z-01 | Breast | breast invasive carcinoma | Female | >=65 | III/IV | Unknown | Unknown | SD |
| PTGFR | insertion | Frame_Shift_Ins | novel | c.290_291insTTTAAAAAATCTTATTGGGTTTAAATCTAATCTTGGTAGCG | p.Glu97AspfsTer43 | p.E97Dfs*43 | P43088 | protein_coding | | | TCGA-AO-A0JB-01 | Breast | breast invasive carcinoma | Female | <65 | III/IV | Chemotherapy | cyclophosphamide | SD |
| PTGFR | insertion | Nonsense_Mutation | novel | c.202_203insATCCCTCCAGAGGCTGATCCCAATGCATCGGCTTCGC | p.Leu68HisfsTer6 | p.L68Hfs*6 | P43088 | protein_coding | | | TCGA-AO-A0JM-01 | Breast | breast invasive carcinoma | Female | <65 | I/II | Chemotherapy | doxorubicin | SD |
| PTGFR | insertion | Frame_Shift_Ins | novel | c.188_189insCTCACCACTCTGCTTTTCAT | p.Lys63AsnfsTer19 | p.K63Nfs*19 | P43088 | protein_coding | | | TCGA-BH-A0H6-01 | Breast | breast invasive carcinoma | Female | >=65 | I/II | Unknown | Unknown | SD |
| PTGFR | insertion | In_Frame_Ins | novel | c.190_191insGTT | p.Ala64delinsGlySer | p.A64delinsGS | P43088 | protein_coding | | | TCGA-BH-A0H6-01 | Breast | breast invasive carcinoma | Female | >=65 | I/II | Unknown | Unknown | SD |
| PTGFR | SNV | Missense_Mutation | novel | c.290A>G | p.Glu97Gly | p.E97G | P43088 | protein_coding | tolerated(0.29) | benign(0.158) | TCGA-EA-A3HU-01 | Cervix | cervical & endocervical cancer | Female | <65 | I/II | Unknown | Unknown | SD |
| PTGFR | SNV | Missense_Mutation | | c.617N>A | p.Ser206Tyr | p.S206Y | P43088 | protein_coding | deleterious(0) | probably_damaging(0.967) | TCGA-A6-6649-01 | Colorectum | colon adenocarcinoma | Male | >=65 | III/IV | Chemotherapy | fluorouracil | SD |
| Entrez ID | Symbol | Category | Interaction Types | Drug Claim Name | Drug Name | PMIDs |
| 5737 | PTGFR | DRUGGABLE GENOME, G PROTEIN COUPLED RECEPTOR | agonist | 135651094 | SULPROSTONE | |
| 5737 | PTGFR | DRUGGABLE GENOME, G PROTEIN COUPLED RECEPTOR | | LAROPIPRANT | LAROPIPRANT | |
| 5737 | PTGFR | DRUGGABLE GENOME, G PROTEIN COUPLED RECEPTOR | agonist | 135650568 | | |
| 5737 | PTGFR | DRUGGABLE GENOME, G PROTEIN COUPLED RECEPTOR | agonist | 135649995 | BIMATOPROST | |
| 5737 | PTGFR | DRUGGABLE GENOME, G PROTEIN COUPLED RECEPTOR | agonist | 135650113 | CLOPROSTENOL | |
| 5737 | PTGFR | DRUGGABLE GENOME, G PROTEIN COUPLED RECEPTOR | agonist | 178100403 | | |
| 5737 | PTGFR | DRUGGABLE GENOME, G PROTEIN COUPLED RECEPTOR | agonist | 135651570 | | |
| 5737 | PTGFR | DRUGGABLE GENOME, G PROTEIN COUPLED RECEPTOR | agonist | 135649649 | | |
| 5737 | PTGFR | DRUGGABLE GENOME, G PROTEIN COUPLED RECEPTOR | agonist | 187051754 | TAFLUPROST | |
| 5737 | PTGFR | DRUGGABLE GENOME, G PROTEIN COUPLED RECEPTOR | agonist | CHEMBL1237105 | CARBOPROST TROMETHAMINE | |