
|
|||||
|
 | |
| |
| |
| |
| |
| |
|
Gene: PTGES3 |
Gene summary for PTGES3 |
| Gene information | Species | Human | Gene symbol | PTGES3 | Gene ID | 10728 |
| Gene name | prostaglandin E synthase 3 | |
| Gene Alias | P23 | |
| Cytomap | 12q13.3 | |
| Gene Type | protein-coding | GO ID | GO:0000271 | UniProtAcc | Q15185 |
Top |
Malignant transformation analysis |
| Identification of the aberrant gene expression in precancerous and cancerous lesions by comparing the gene expression of stem-like cells in diseased tissues with normal stem cells |
| Entrez ID | Symbol | Replicates | Species | Organ | Tissue | Adj P-value | Log2FC | Malignancy |
| 10728 | PTGES3 | GSM4909285 | Human | Breast | IDC | 3.31e-13 | 4.66e-01 | 0.21 |
| 10728 | PTGES3 | GSM4909286 | Human | Breast | IDC | 1.09e-07 | -1.84e-01 | 0.1081 |
| 10728 | PTGES3 | GSM4909288 | Human | Breast | IDC | 1.15e-03 | 4.81e-02 | 0.0988 |
| 10728 | PTGES3 | GSM4909293 | Human | Breast | IDC | 8.33e-06 | 2.24e-01 | 0.1581 |
| 10728 | PTGES3 | GSM4909294 | Human | Breast | IDC | 3.17e-22 | 2.98e-01 | 0.2022 |
| 10728 | PTGES3 | GSM4909296 | Human | Breast | IDC | 2.32e-23 | -4.90e-01 | 0.1524 |
| 10728 | PTGES3 | GSM4909297 | Human | Breast | IDC | 5.46e-23 | 1.75e-02 | 0.1517 |
| 10728 | PTGES3 | GSM4909301 | Human | Breast | IDC | 2.23e-02 | -2.27e-01 | 0.1577 |
| 10728 | PTGES3 | GSM4909302 | Human | Breast | IDC | 4.52e-04 | -2.84e-01 | 0.1545 |
| 10728 | PTGES3 | GSM4909311 | Human | Breast | IDC | 1.24e-52 | -6.49e-01 | 0.1534 |
| 10728 | PTGES3 | GSM4909312 | Human | Breast | IDC | 3.05e-14 | -2.09e-01 | 0.1552 |
| 10728 | PTGES3 | GSM4909313 | Human | Breast | IDC | 2.55e-07 | -2.76e-01 | 0.0391 |
| 10728 | PTGES3 | GSM4909315 | Human | Breast | IDC | 2.19e-28 | 5.13e-01 | 0.21 |
| 10728 | PTGES3 | GSM4909316 | Human | Breast | IDC | 6.81e-03 | 8.40e-02 | 0.21 |
| 10728 | PTGES3 | GSM4909317 | Human | Breast | IDC | 2.79e-05 | 3.30e-01 | 0.1355 |
| 10728 | PTGES3 | GSM4909318 | Human | Breast | IDC | 4.14e-09 | 4.08e-01 | 0.2031 |
| 10728 | PTGES3 | GSM4909319 | Human | Breast | IDC | 1.12e-53 | -5.35e-01 | 0.1563 |
| 10728 | PTGES3 | GSM4909320 | Human | Breast | IDC | 4.61e-09 | -5.48e-01 | 0.1575 |
| 10728 | PTGES3 | GSM4909321 | Human | Breast | IDC | 3.61e-36 | 3.98e-01 | 0.1559 |
| 10728 | PTGES3 | brca1 | Human | Breast | Precancer | 3.64e-05 | 2.84e-01 | -0.0338 |
| Page: 1 2 3 4 5 6 7 8 9 10 11 12 13 14 15 |
| Tissue | Expression Dynamics | Abbreviation |
| Breast | 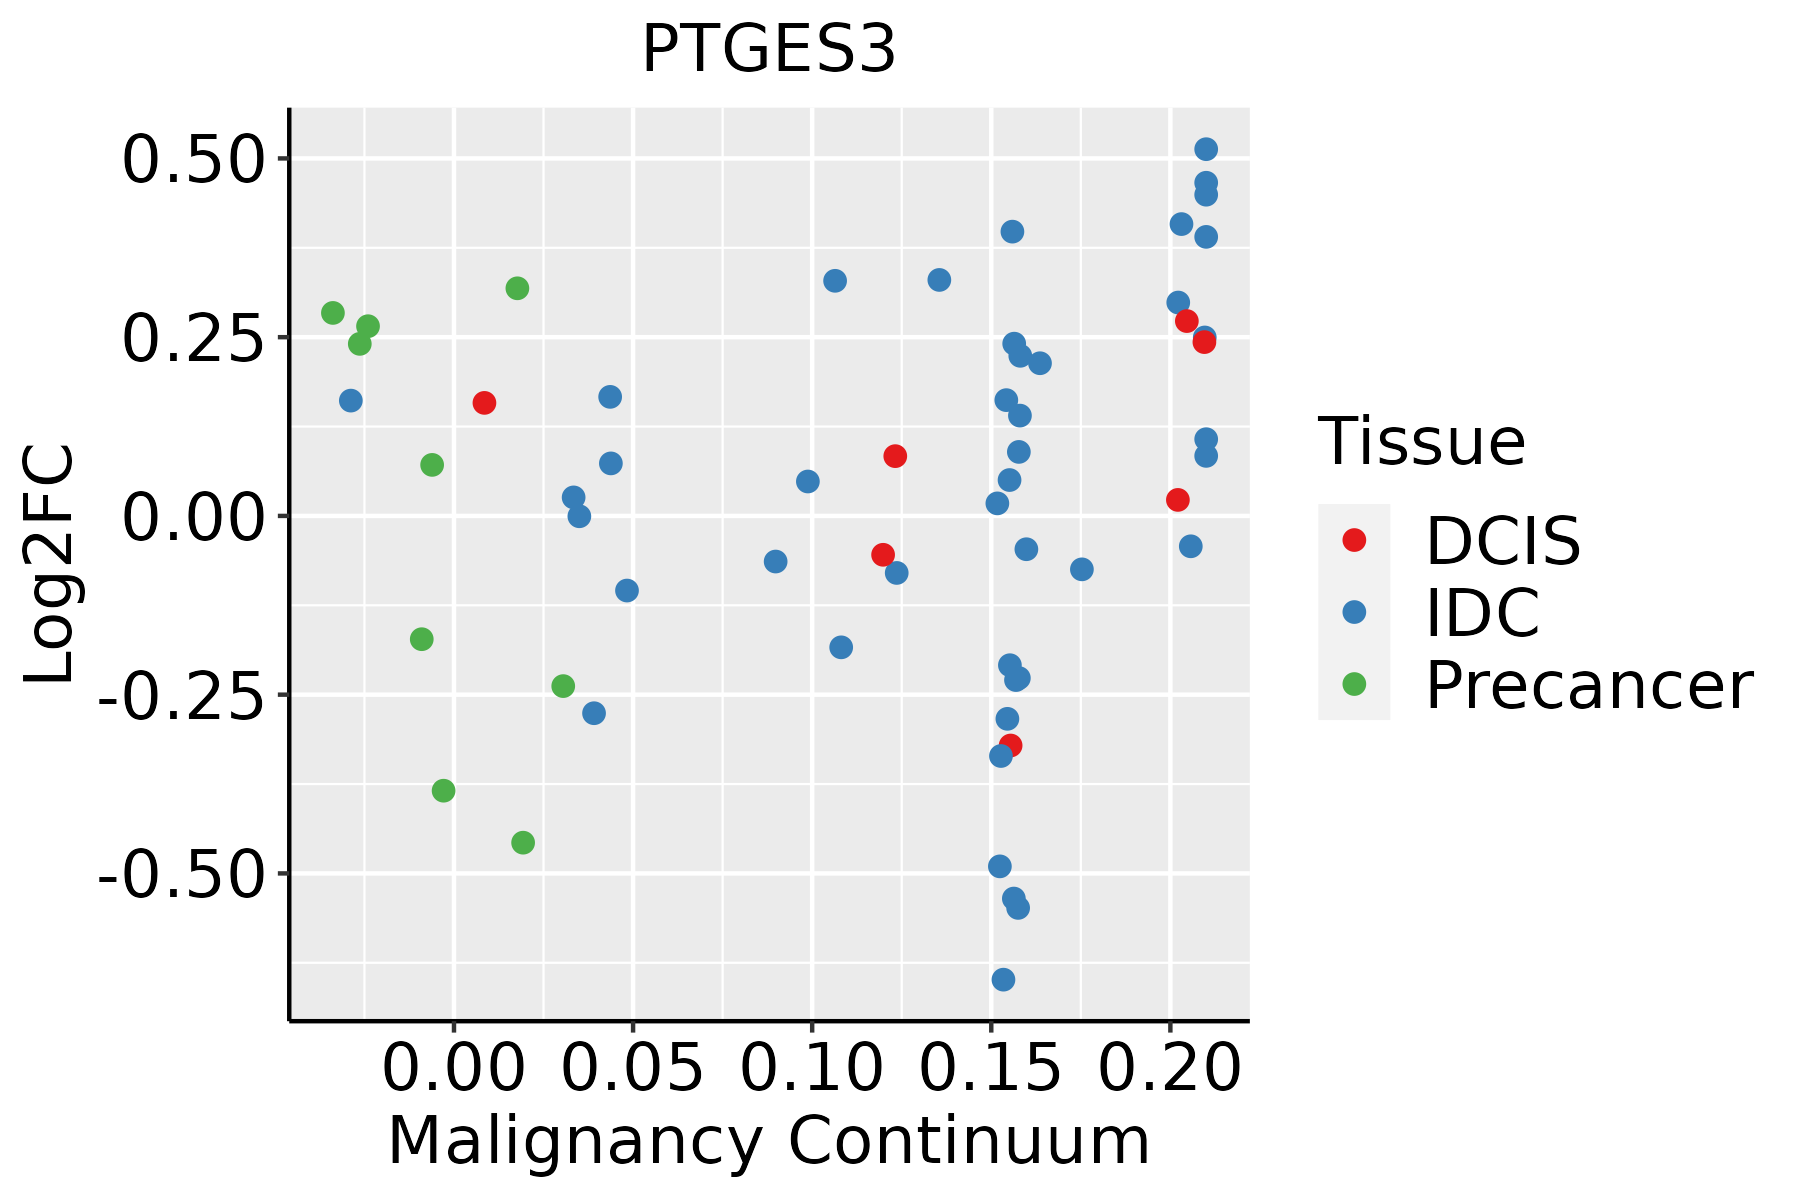 | IDC: Invasive ductal carcinoma |
| DCIS: Ductal carcinoma in situ | ||
| Precancer(BRCA1-mut): Precancerous lesion from BRCA1 mutation carriers | ||
| Colorectum (GSE201348) |  | FAP: Familial adenomatous polyposis |
| CRC: Colorectal cancer | ||
| Colorectum (HTA11) |  | AD: Adenomas |
| SER: Sessile serrated lesions | ||
| MSI-H: Microsatellite-high colorectal cancer | ||
| MSS: Microsatellite stable colorectal cancer | ||
| Endometrium |  | AEH: Atypical endometrial hyperplasia |
| EEC: Endometrioid Cancer | ||
| Esophagus | 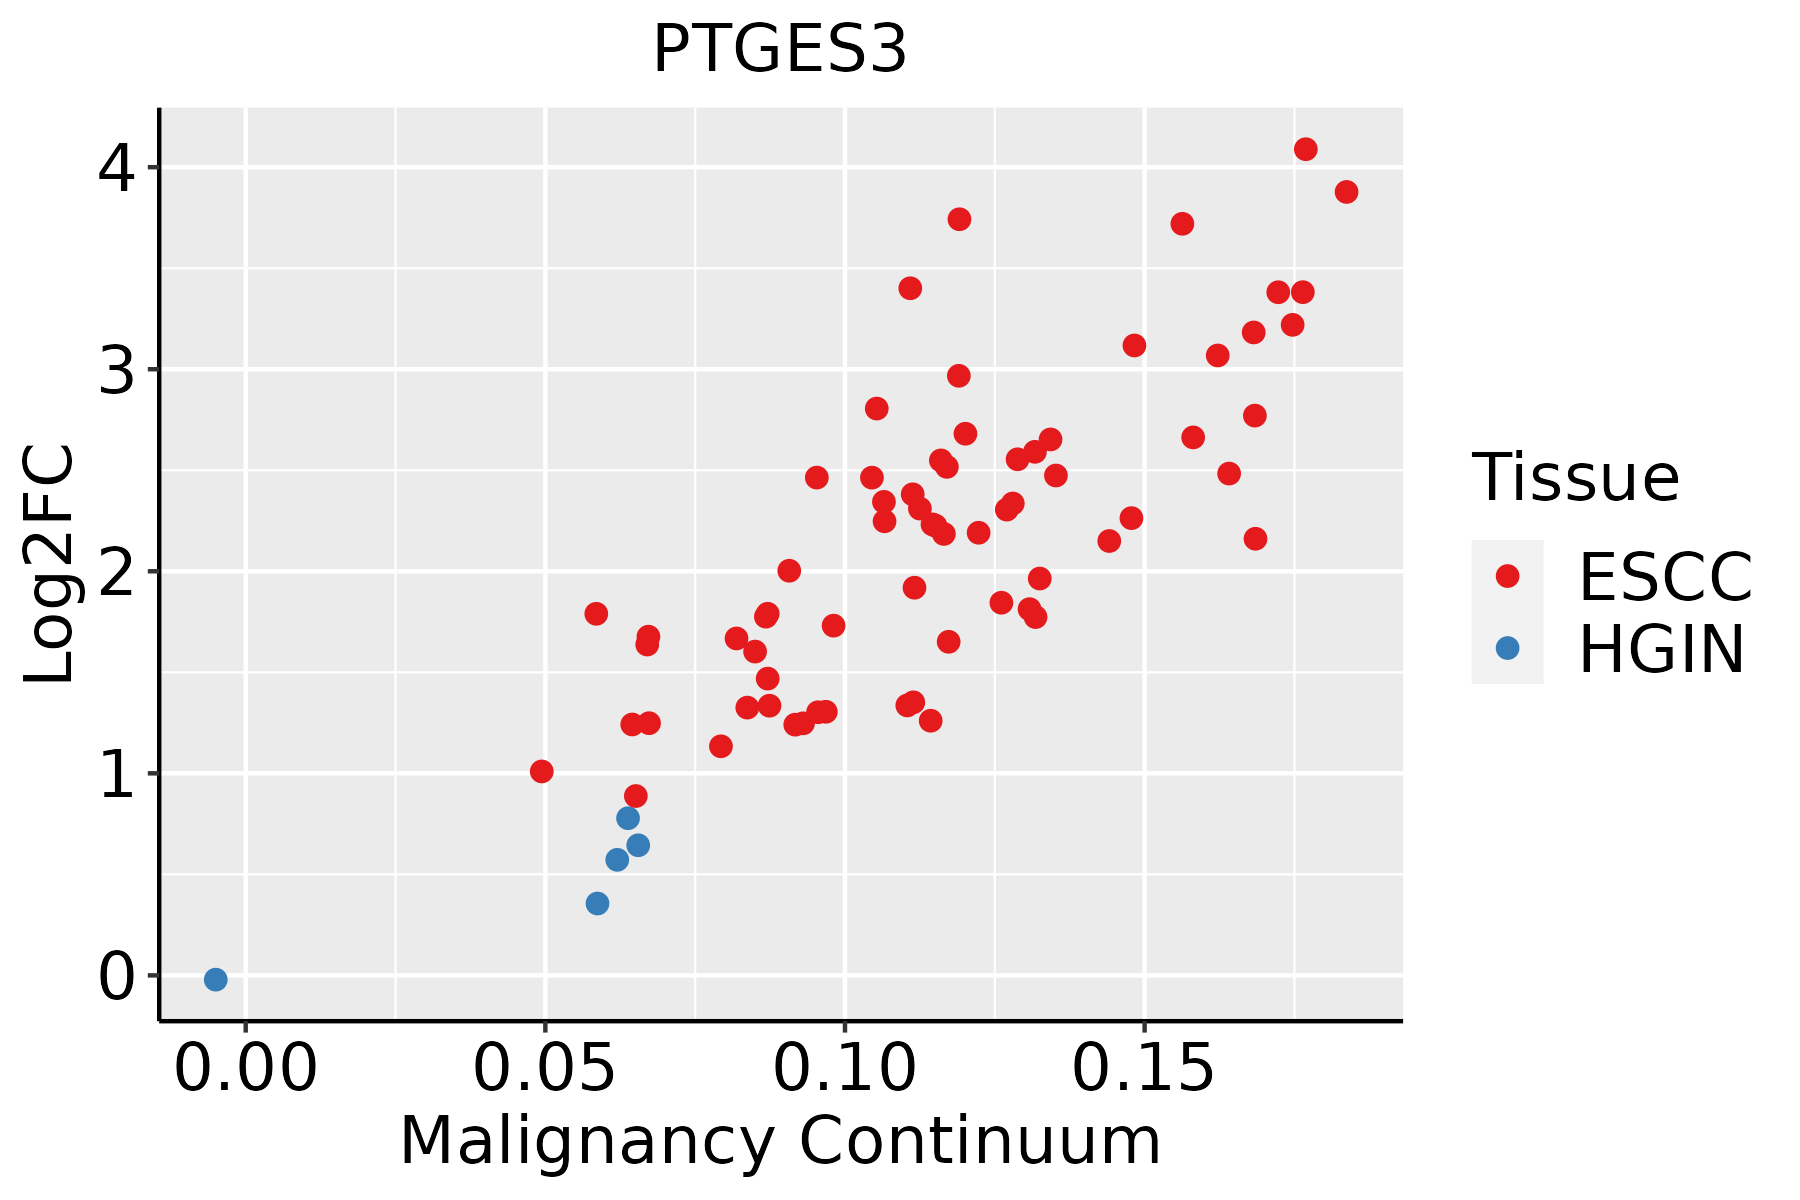 | ESCC: Esophageal squamous cell carcinoma |
| HGIN: High-grade intraepithelial neoplasias | ||
| LGIN: Low-grade intraepithelial neoplasias | ||
| GC |  | CAG: Chronic atrophic gastritis |
| CAG with IM: Chronic atrophic gastritis with intestinal metaplasia | ||
| CSG: Chronic superficial gastritis | ||
| GC: Gastric cancer | ||
| SIM: Severe intestinal metaplasia | ||
| WIM: Wild intestinal metaplasia | ||
| Liver | 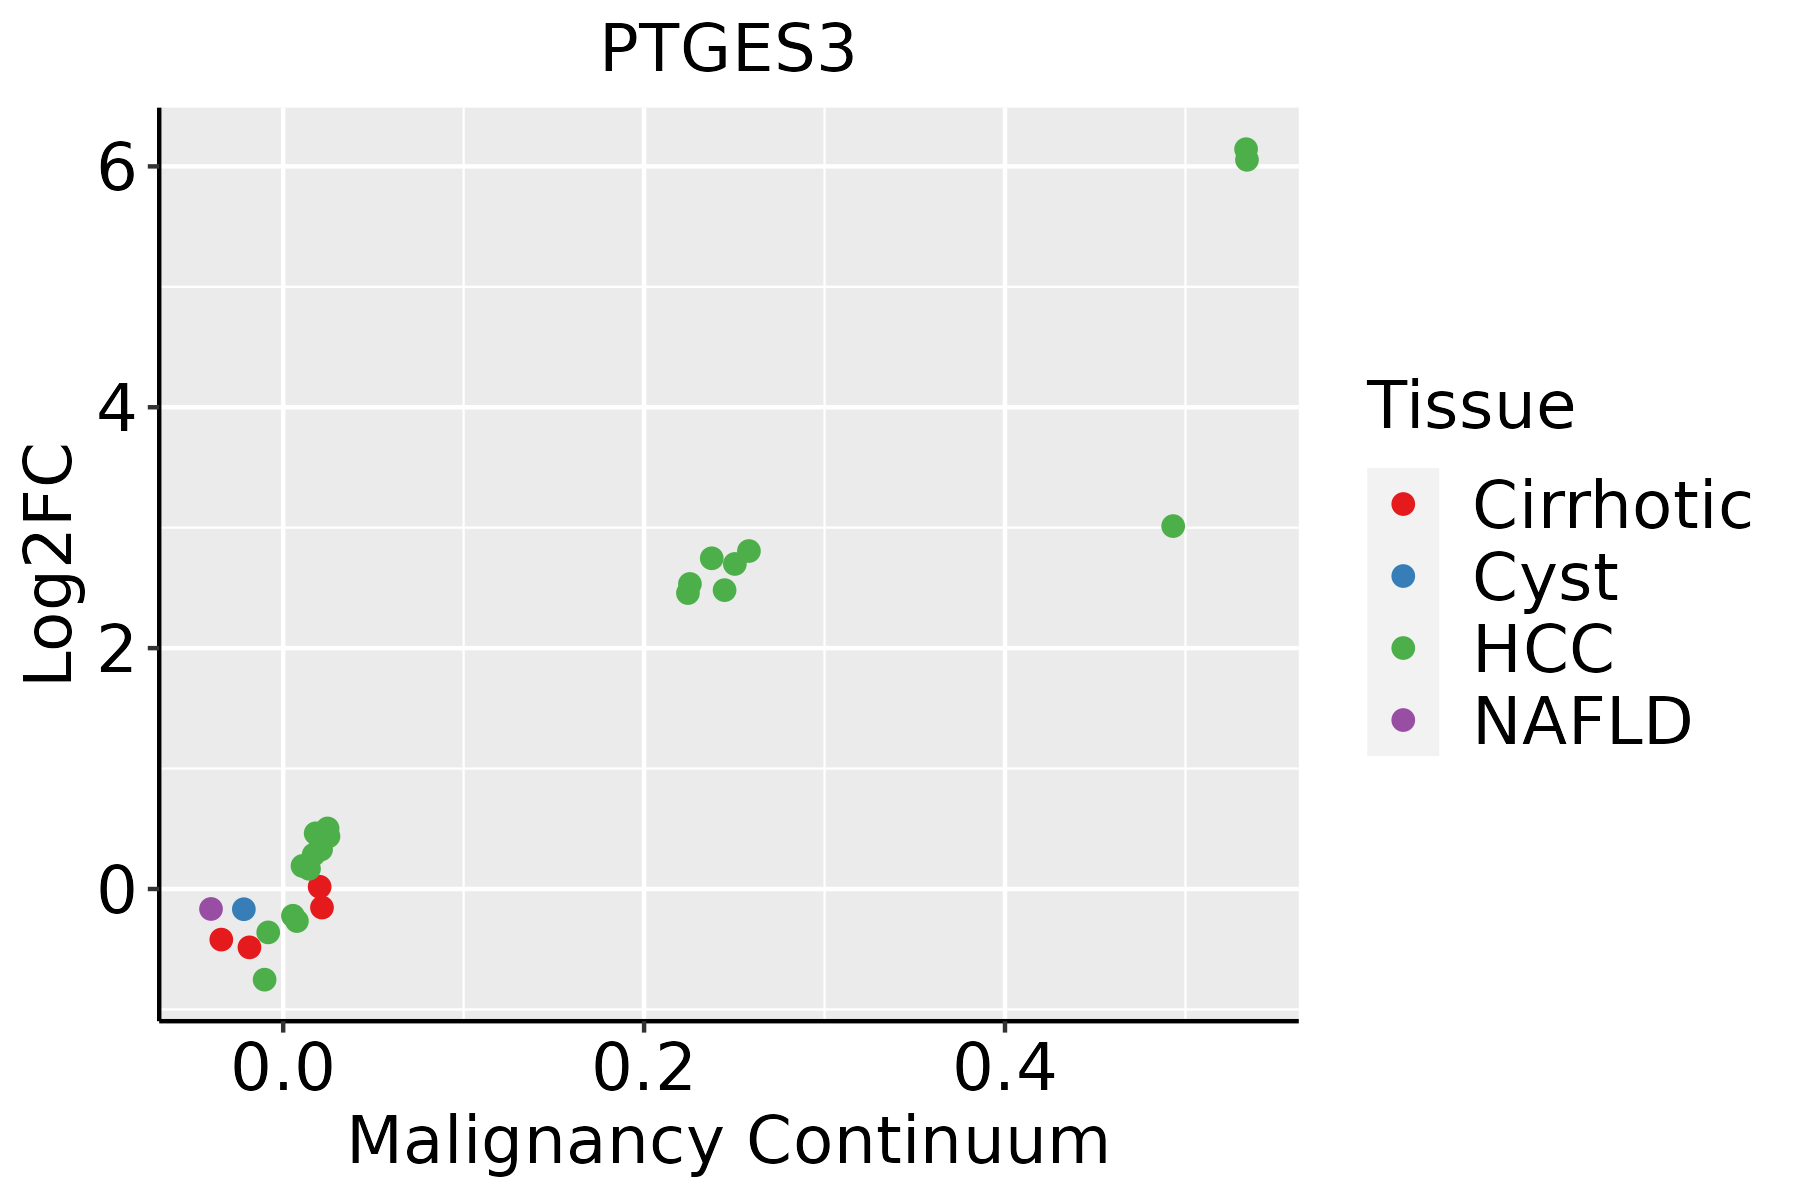 | HCC: Hepatocellular carcinoma |
| NAFLD: Non-alcoholic fatty liver disease | ||
| Oral Cavity | 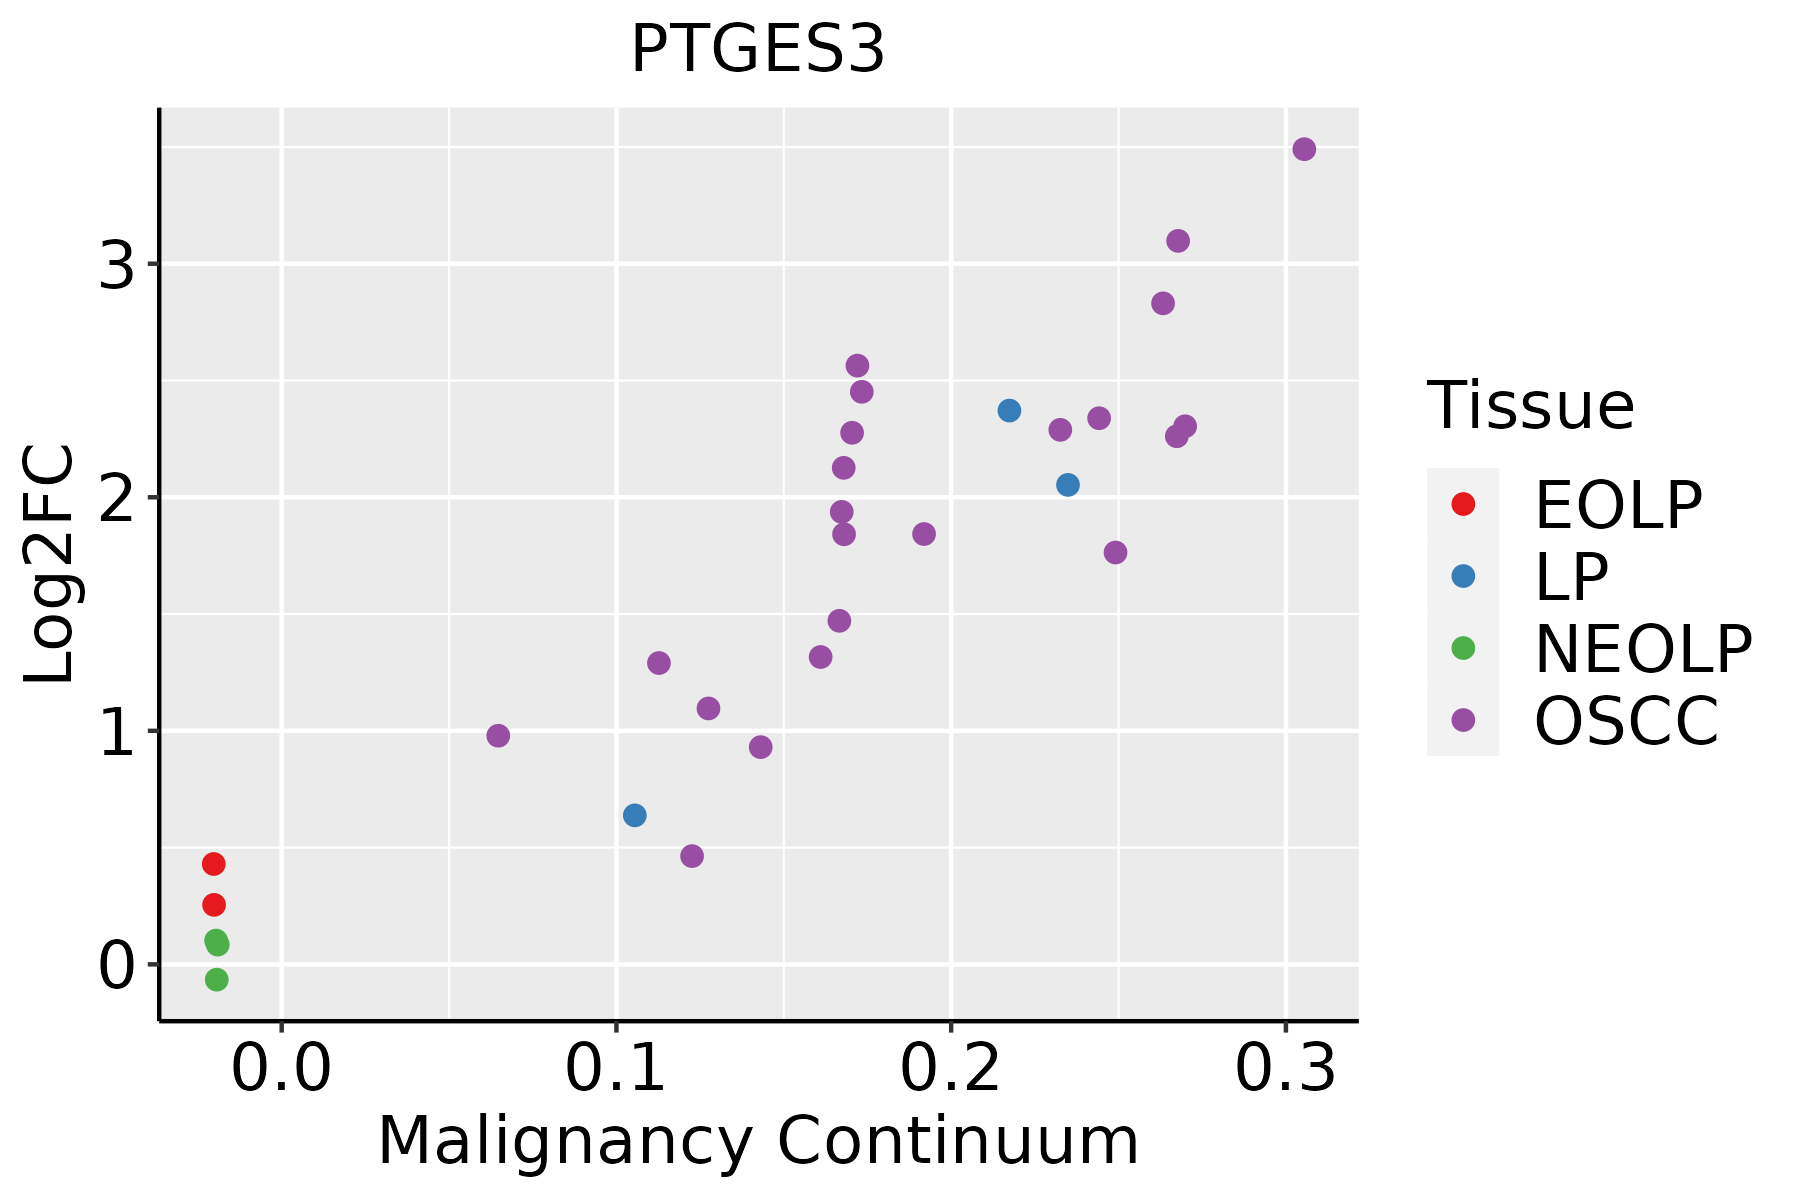 | EOLP: Erosive Oral lichen planus |
| LP: leukoplakia | ||
| NEOLP: Non-erosive oral lichen planus | ||
| OSCC: Oral squamous cell carcinoma | ||
| Prostate | 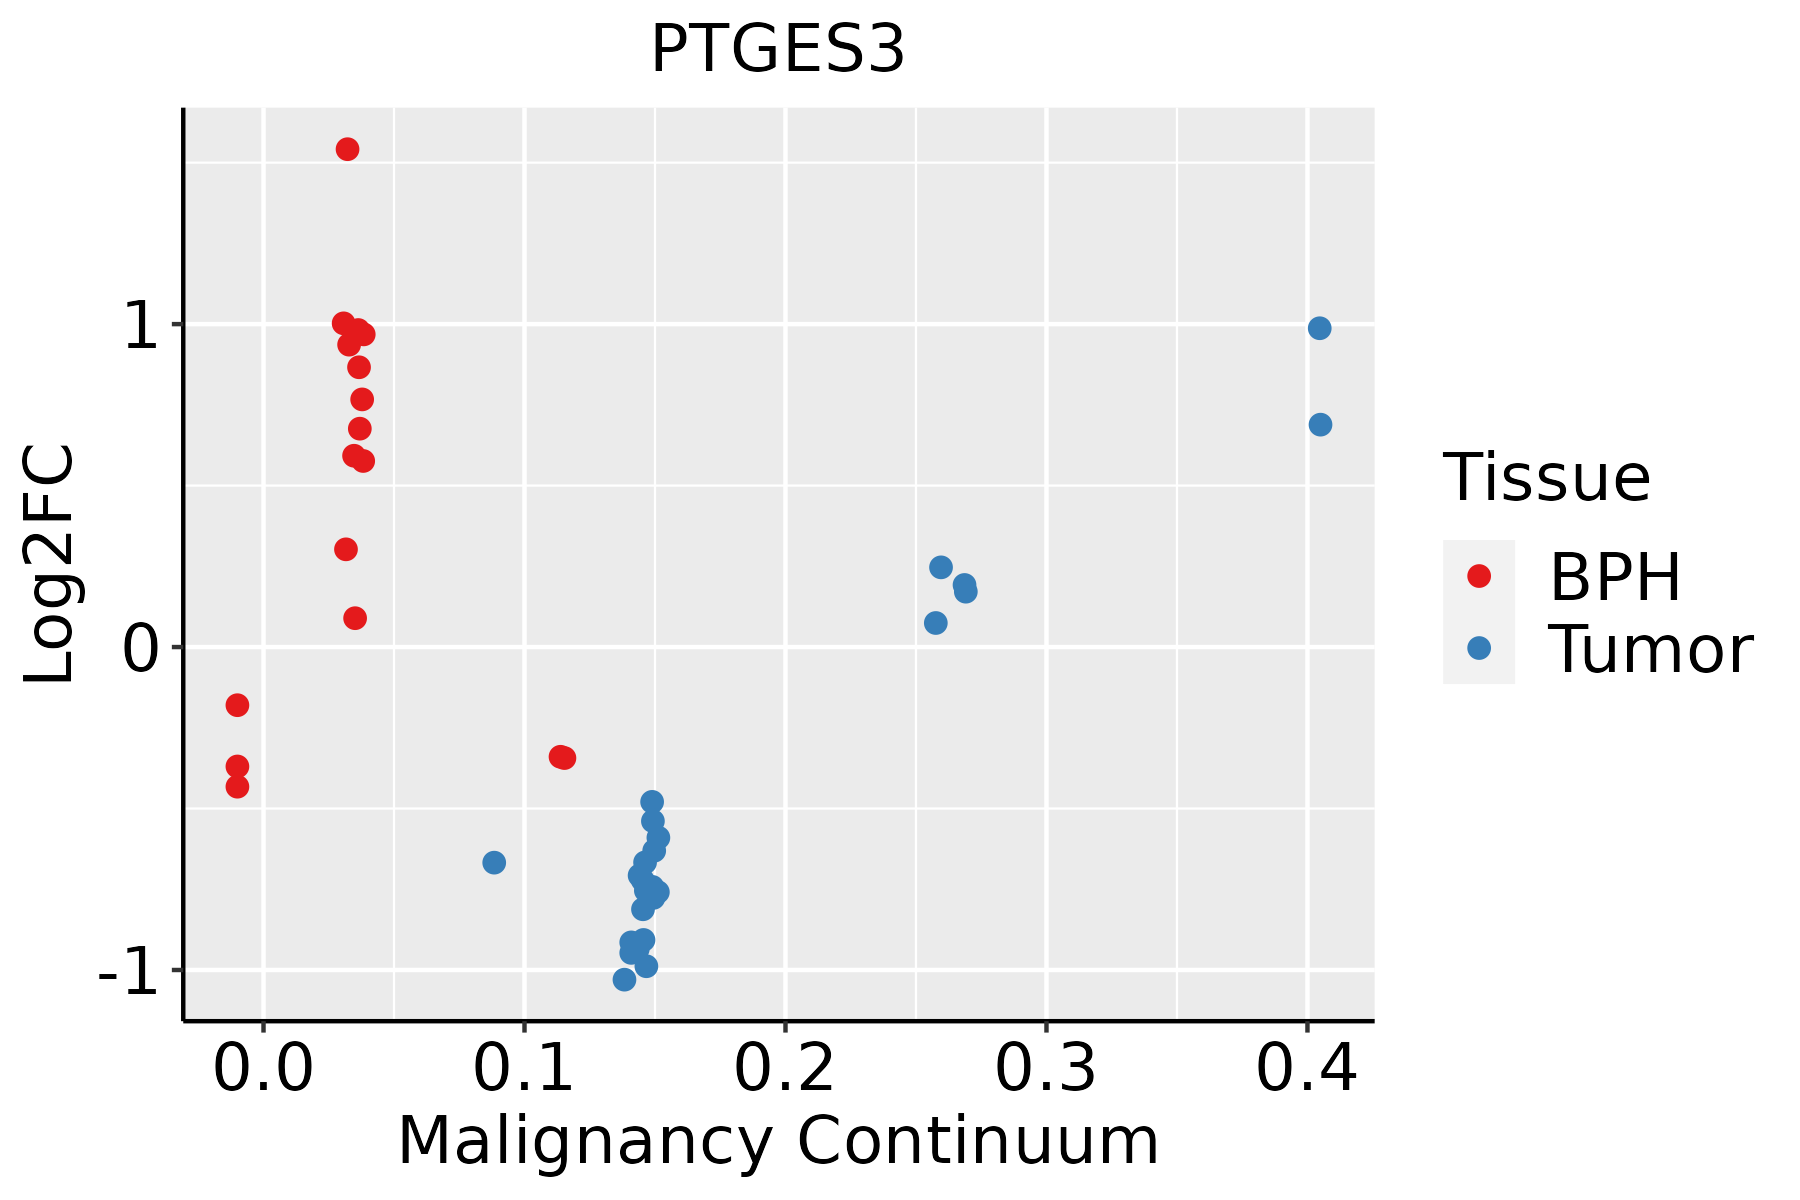 | BPH: Benign Prostatic Hyperplasia |
| Skin |  | AK: Actinic keratosis |
| cSCC: Cutaneous squamous cell carcinoma | ||
| SCCIS:squamous cell carcinoma in situ | ||
| Thyroid | 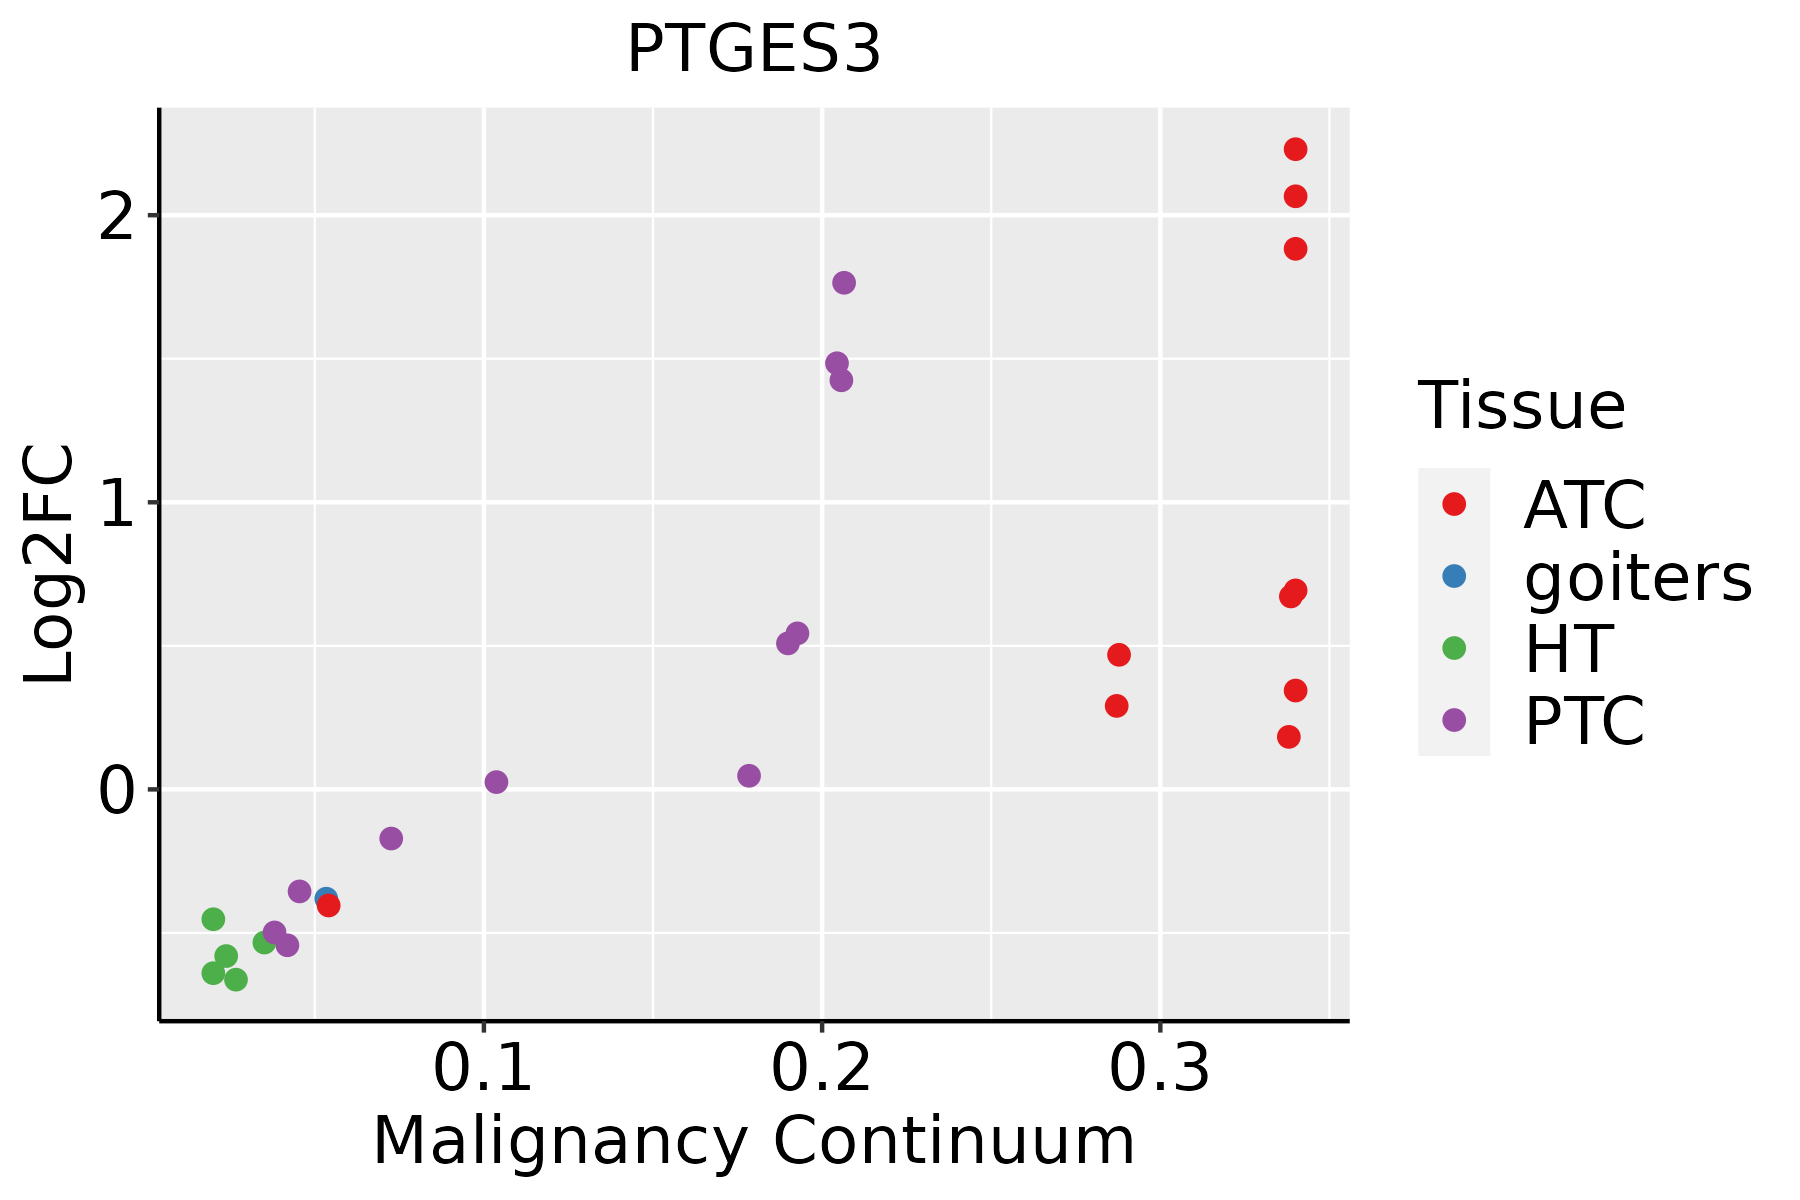 | ATC: Anaplastic thyroid cancer |
| HT: Hashimoto's thyroiditis | ||
| PTC: Papillary thyroid cancer |
| ∗log2FC in expression of this searched gene in stem-like cells from each diseased tissue sample relative to stem-like cells in normal samples in each tissue plotted against the malignancy continuum. Samples are colored based on if they are from different disease stage. |
Top |
Malignant transformation related pathway analysis |
| Find out the enriched GO biological processes and KEGG pathways involved in transition from healthy to precancer to cancer |
| Tissue | Disease Stage | Enriched GO biological Processes |
| Colorectum | AD |  |
| Colorectum | SER |  |
| Colorectum | MSS |  |
| Colorectum | MSI-H |  |
| Colorectum | FAP |  |
| ∗Top 15 enriched GO BP terms are showed in the bar plot of each disease state in each tissue. Each row represents a significant GO biological process which is colored according to the -log10(p.adjust). |
| Page: 1 2 3 4 5 6 7 8 9 |
| GO ID | Tissue | Disease Stage | Description | Gene Ratio | Bg Ratio | pvalue | p.adjust | Count |
| GO:00060918 | Breast | Precancer | generation of precursor metabolites and energy | 94/1080 | 490/18723 | 1.54e-25 | 1.64e-22 | 94 |
| GO:00159808 | Breast | Precancer | energy derivation by oxidation of organic compounds | 70/1080 | 318/18723 | 8.33e-23 | 6.37e-20 | 70 |
| GO:00226139 | Breast | Precancer | ribonucleoprotein complex biogenesis | 79/1080 | 463/18723 | 2.11e-18 | 1.03e-15 | 79 |
| GO:00718269 | Breast | Precancer | ribonucleoprotein complex subunit organization | 48/1080 | 227/18723 | 2.68e-15 | 8.45e-13 | 48 |
| GO:00226189 | Breast | Precancer | ribonucleoprotein complex assembly | 47/1080 | 220/18723 | 3.47e-15 | 1.03e-12 | 47 |
| GO:00064578 | Breast | Precancer | protein folding | 43/1080 | 212/18723 | 3.48e-13 | 7.45e-11 | 43 |
| GO:00485459 | Breast | Precancer | response to steroid hormone | 53/1080 | 339/18723 | 3.07e-11 | 3.66e-09 | 53 |
| GO:00064588 | Breast | Precancer | 'de novo' protein folding | 16/1080 | 43/18723 | 8.14e-10 | 6.92e-08 | 16 |
| GO:00610778 | Breast | Precancer | chaperone-mediated protein folding | 19/1080 | 67/18723 | 4.22e-09 | 3.28e-07 | 19 |
| GO:00510848 | Breast | Precancer | 'de novo' posttranslational protein folding | 14/1080 | 39/18723 | 1.61e-08 | 1.12e-06 | 14 |
| GO:00510858 | Breast | Precancer | chaperone cofactor-dependent protein refolding | 13/1080 | 34/18723 | 2.17e-08 | 1.47e-06 | 13 |
| GO:00508219 | Breast | Precancer | protein stabilization | 29/1080 | 191/18723 | 1.67e-06 | 6.08e-05 | 29 |
| GO:00316479 | Breast | Precancer | regulation of protein stability | 38/1080 | 298/18723 | 3.73e-06 | 1.19e-04 | 38 |
| GO:00713838 | Breast | Precancer | cellular response to steroid hormone stimulus | 28/1080 | 204/18723 | 1.78e-05 | 4.26e-04 | 28 |
| GO:00108338 | Breast | Precancer | telomere maintenance via telomere lengthening | 15/1080 | 81/18723 | 5.31e-05 | 1.11e-03 | 15 |
| GO:00007238 | Breast | Precancer | telomere maintenance | 20/1080 | 131/18723 | 6.10e-05 | 1.25e-03 | 20 |
| GO:20005738 | Breast | Precancer | positive regulation of DNA biosynthetic process | 13/1080 | 66/18723 | 8.54e-05 | 1.63e-03 | 13 |
| GO:00070047 | Breast | Precancer | telomere maintenance via telomerase | 13/1080 | 69/18723 | 1.37e-04 | 2.38e-03 | 13 |
| GO:00062786 | Breast | Precancer | RNA-dependent DNA biosynthetic process | 13/1080 | 75/18723 | 3.27e-04 | 4.64e-03 | 13 |
| GO:20002788 | Breast | Precancer | regulation of DNA biosynthetic process | 16/1080 | 106/18723 | 3.68e-04 | 5.03e-03 | 16 |
| Page: 1 2 3 4 5 6 7 8 9 10 11 12 13 14 15 16 17 18 19 20 21 22 23 24 25 26 27 28 29 30 31 32 33 34 35 36 37 38 39 40 41 42 43 44 45 46 47 48 49 50 51 52 53 |
| Pathway ID | Tissue | Disease Stage | Description | Gene Ratio | Bg Ratio | pvalue | p.adjust | qvalue | Count |
| hsa05207 | Colorectum | CRC | Chemical carcinogenesis - receptor activation | 42/1091 | 212/8465 | 2.62e-03 | 1.75e-02 | 1.19e-02 | 42 |
| hsa052071 | Colorectum | CRC | Chemical carcinogenesis - receptor activation | 42/1091 | 212/8465 | 2.62e-03 | 1.75e-02 | 1.19e-02 | 42 |
| Page: 1 |
Top |
Cell-cell communication analysis |
| Identification of potential cell-cell interactions between two cell types and their ligand-receptor pairs for different disease states |
| Ligand | Receptor | LRpair | Pathway | Tissue | Disease Stage |
| Page: 1 |
Top |
Single-cell gene regulatory network inference analysis |
| Find out the significant the regulons (TFs) and the target genes of each regulon across cell types for different disease states |
| TF | Cell Type | Tissue | Disease Stage | Target Gene | RSS | Regulon Activity |
| ∗The dot plots of a searched regulon are shown for all cell subpopulations in each disease state of each tissue based on the regulon specific score inferred using pySCENIC and by calculating the average expression. |
| Page: 1 |
Top |
Somatic mutation of malignant transformation related genes |
| Annotation of somatic variants for genes involved in malignant transformation |
| Hugo Symbol | Variant Class | Variant Classification | dbSNP RS | HGVSc | HGVSp | HGVSp Short | SWISSPROT | BIOTYPE | SIFT | PolyPhen | Tumor Sample Barcode | Tissue | Histology | Sex | Age | Stage | Therapy Types | Drugs | Outcome |
| PTGES3 | SNV | Missense_Mutation | novel | c.44N>A | p.Arg15Gln | p.R15Q | protein_coding | tolerated(0.06) | possibly_damaging(0.479) | TCGA-AN-A046-01 | Breast | breast invasive carcinoma | Female | >=65 | I/II | Unknown | Unknown | SD | |
| PTGES3 | SNV | Missense_Mutation | c.215G>C | p.Arg72Thr | p.R72T | protein_coding | deleterious(0.02) | probably_damaging(0.958) | TCGA-D8-A27N-01 | Breast | breast invasive carcinoma | Female | <65 | III/IV | Chemotherapy | taxol+adriamycin+cyclophosphamide+herceptin | SD | ||
| PTGES3 | SNV | Missense_Mutation | c.127A>G | p.Ser43Gly | p.S43G | protein_coding | deleterious(0.03) | benign(0.007) | TCGA-AA-3710-01 | Colorectum | colon adenocarcinoma | Female | >=65 | I/II | Unknown | Unknown | SD | ||
| PTGES3 | SNV | Missense_Mutation | novel | c.112N>C | p.Ser38Pro | p.S38P | protein_coding | tolerated(0.08) | possibly_damaging(0.631) | TCGA-CA-6717-01 | Colorectum | colon adenocarcinoma | Male | <65 | I/II | Chemotherapy | oxaliplatin | CR | |
| PTGES3 | SNV | Missense_Mutation | c.365N>G | p.Ser122Cys | p.S122C | protein_coding | deleterious(0) | probably_damaging(0.94) | TCGA-DM-A1D7-01 | Colorectum | colon adenocarcinoma | Male | >=65 | I/II | Unknown | Unknown | PD | ||
| PTGES3 | SNV | Missense_Mutation | novel | c.398A>G | p.Asn133Ser | p.N133S | protein_coding | tolerated(0.25) | benign(0.02) | TCGA-A5-A0G2-01 | Endometrium | uterine corpus endometrioid carcinoma | Female | <65 | III/IV | Unknown | Unknown | SD | |
| PTGES3 | SNV | Missense_Mutation | c.28G>A | p.Ala10Thr | p.A10T | protein_coding | tolerated(0.53) | benign(0.343) | TCGA-AX-A063-01 | Endometrium | uterine corpus endometrioid carcinoma | Female | <65 | I/II | Unknown | Unknown | SD | ||
| PTGES3 | SNV | Missense_Mutation | novel | c.232T>G | p.Leu78Val | p.L78V | protein_coding | tolerated(0.38) | benign(0.143) | TCGA-EO-A3B0-01 | Endometrium | uterine corpus endometrioid carcinoma | Female | <65 | III/IV | Unknown | Unknown | SD | |
| PTGES3 | SNV | Missense_Mutation | novel | c.403N>T | p.Gly135Cys | p.G135C | protein_coding | deleterious(0) | probably_damaging(0.999) | TCGA-EO-A3KX-01 | Endometrium | uterine corpus endometrioid carcinoma | Female | >=65 | I/II | Unknown | Unknown | SD | |
| PTGES3 | SNV | Missense_Mutation | novel | c.20N>A | p.Pro7His | p.P7H | protein_coding | tolerated(0.24) | benign(0.108) | TCGA-EO-A3KX-01 | Endometrium | uterine corpus endometrioid carcinoma | Female | >=65 | I/II | Unknown | Unknown | SD |
| Page: 1 2 |
Top |
Related drugs of malignant transformation related genes |
| Identification of chemicals and drugs interact with genes involved in malignant transfromation |
| (DGIdb 4.0) |
| Entrez ID | Symbol | Category | Interaction Types | Drug Claim Name | Drug Name | PMIDs |
| 10728 | PTGES3 | ENZYME | GENISTEIN | GENISTEIN | 15229138 | |
| 10728 | PTGES3 | ENZYME | DIETHYLSTILBESTROL | DIETHYLSTILBESTROL | 15229138 | |
| 10728 | PTGES3 | ENZYME | GEDUNIN | GEDUNIN | 25756299 |
| Page: 1 |

Copyright 2023-Present -The University of Texas Health Science Center at Houston |