
|
|||||
|
 | |
| |
| |
| |
| |
| |
|
Gene: PTGES2 |
Gene summary for PTGES2 |
| Gene information | Species | Human | Gene symbol | PTGES2 | Gene ID | 80142 |
| Gene name | prostaglandin E synthase 2 | |
| Gene Alias | C9orf15 | |
| Cytomap | 9q34.11 | |
| Gene Type | protein-coding | GO ID | GO:0001516 | UniProtAcc | A6NHH0 |
Top |
Malignant transformation analysis |
| Identification of the aberrant gene expression in precancerous and cancerous lesions by comparing the gene expression of stem-like cells in diseased tissues with normal stem cells |
| Entrez ID | Symbol | Replicates | Species | Organ | Tissue | Adj P-value | Log2FC | Malignancy |
| 80142 | PTGES2 | HTA11_347_2000001011 | Human | Colorectum | AD | 1.71e-05 | 2.74e-01 | -0.1954 |
| 80142 | PTGES2 | HTA11_1391_2000001011 | Human | Colorectum | AD | 8.21e-08 | 3.95e-01 | -0.059 |
| 80142 | PTGES2 | HTA11_99999965062_69753 | Human | Colorectum | MSI-H | 2.76e-03 | 6.58e-01 | 0.3487 |
| 80142 | PTGES2 | HTA11_99999965104_69814 | Human | Colorectum | MSS | 4.15e-07 | 4.14e-01 | 0.281 |
| 80142 | PTGES2 | HTA11_99999971662_82457 | Human | Colorectum | MSS | 6.29e-04 | 3.16e-01 | 0.3859 |
| 80142 | PTGES2 | A002-C-116 | Human | Colorectum | FAP | 5.33e-03 | -1.17e-01 | -0.0452 |
| 80142 | PTGES2 | LZE2T | Human | Esophagus | ESCC | 1.60e-04 | 7.07e-01 | 0.082 |
| 80142 | PTGES2 | LZE5T | Human | Esophagus | ESCC | 1.58e-03 | 1.92e-01 | 0.0514 |
| 80142 | PTGES2 | LZE7T | Human | Esophagus | ESCC | 1.64e-02 | 1.09e-01 | 0.0667 |
| 80142 | PTGES2 | LZE20T | Human | Esophagus | ESCC | 9.43e-21 | 6.12e-01 | 0.0662 |
| 80142 | PTGES2 | LZE21D1 | Human | Esophagus | HGIN | 1.14e-02 | 3.32e-01 | 0.0632 |
| 80142 | PTGES2 | LZE22T | Human | Esophagus | ESCC | 5.19e-03 | 3.85e-01 | 0.068 |
| 80142 | PTGES2 | LZE24T | Human | Esophagus | ESCC | 1.56e-21 | 4.99e-01 | 0.0596 |
| 80142 | PTGES2 | LZE21T | Human | Esophagus | ESCC | 4.89e-11 | 8.24e-01 | 0.0655 |
| 80142 | PTGES2 | P1T-E | Human | Esophagus | ESCC | 7.13e-22 | 6.80e-01 | 0.0875 |
| 80142 | PTGES2 | P2T-E | Human | Esophagus | ESCC | 1.55e-47 | 8.75e-01 | 0.1177 |
| 80142 | PTGES2 | P4T-E | Human | Esophagus | ESCC | 1.02e-51 | 1.04e+00 | 0.1323 |
| 80142 | PTGES2 | P5T-E | Human | Esophagus | ESCC | 8.23e-34 | 6.21e-01 | 0.1327 |
| 80142 | PTGES2 | P8T-E | Human | Esophagus | ESCC | 4.76e-41 | 8.53e-01 | 0.0889 |
| 80142 | PTGES2 | P9T-E | Human | Esophagus | ESCC | 6.91e-39 | 8.73e-01 | 0.1131 |
| Page: 1 2 3 4 5 6 7 |
| Tissue | Expression Dynamics | Abbreviation |
| Colorectum (GSE201348) | 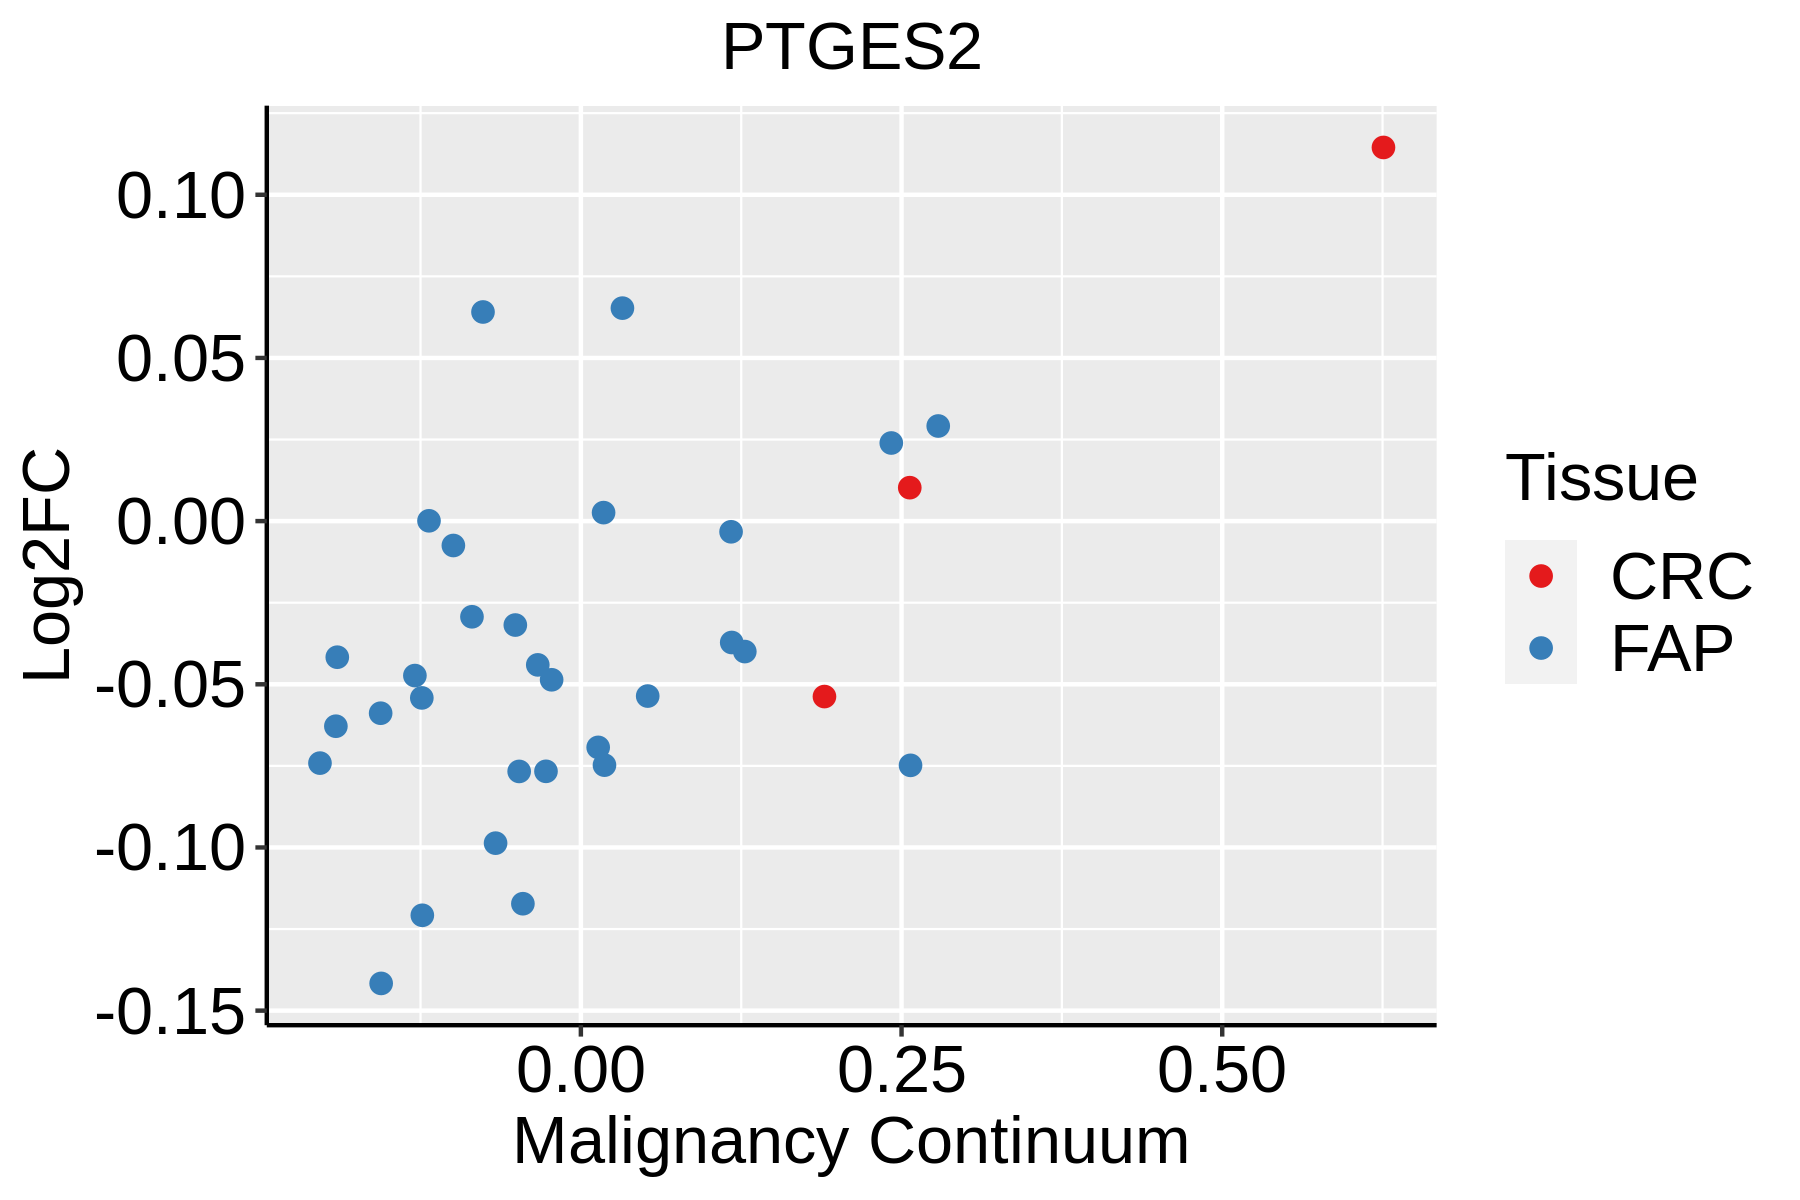 | FAP: Familial adenomatous polyposis |
| CRC: Colorectal cancer | ||
| Colorectum (HTA11) |  | AD: Adenomas |
| SER: Sessile serrated lesions | ||
| MSI-H: Microsatellite-high colorectal cancer | ||
| MSS: Microsatellite stable colorectal cancer | ||
| Esophagus | 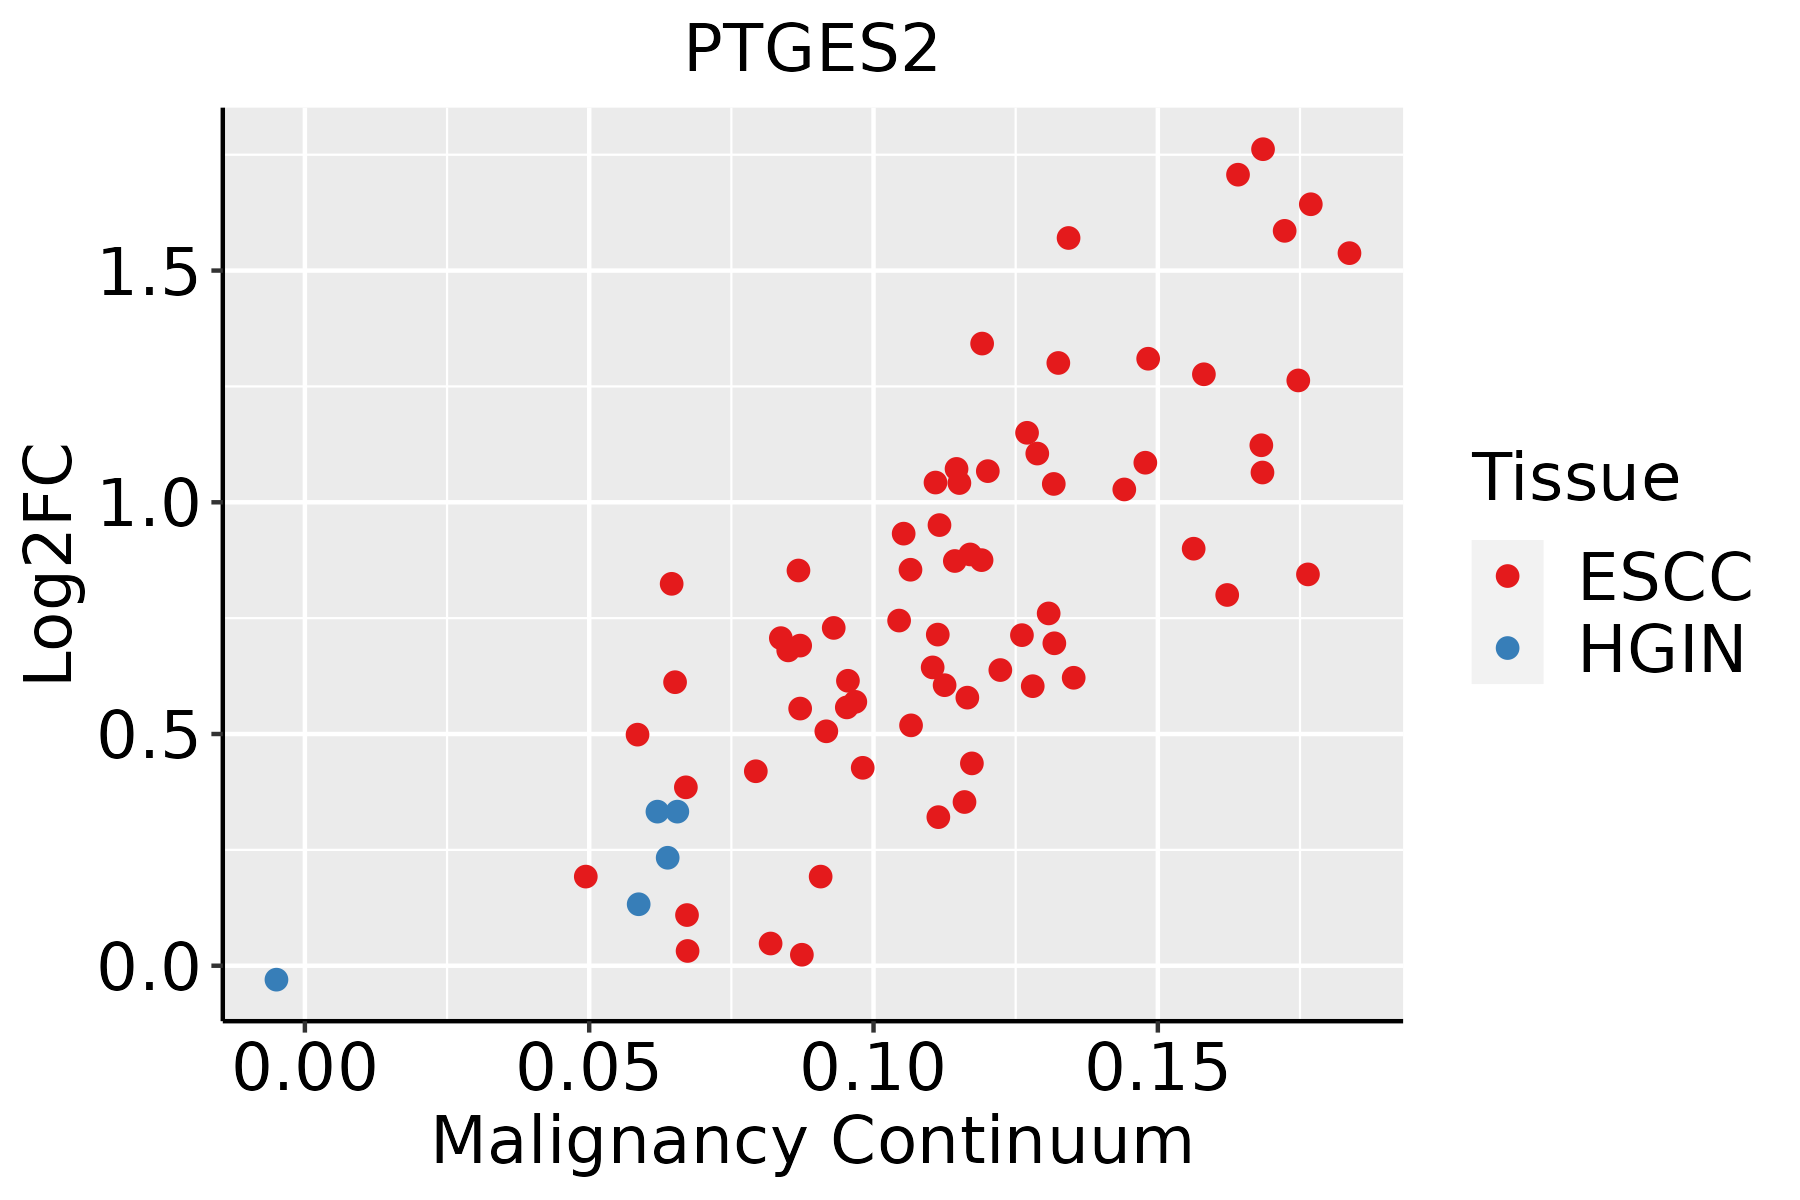 | ESCC: Esophageal squamous cell carcinoma |
| HGIN: High-grade intraepithelial neoplasias | ||
| LGIN: Low-grade intraepithelial neoplasias | ||
| Liver | 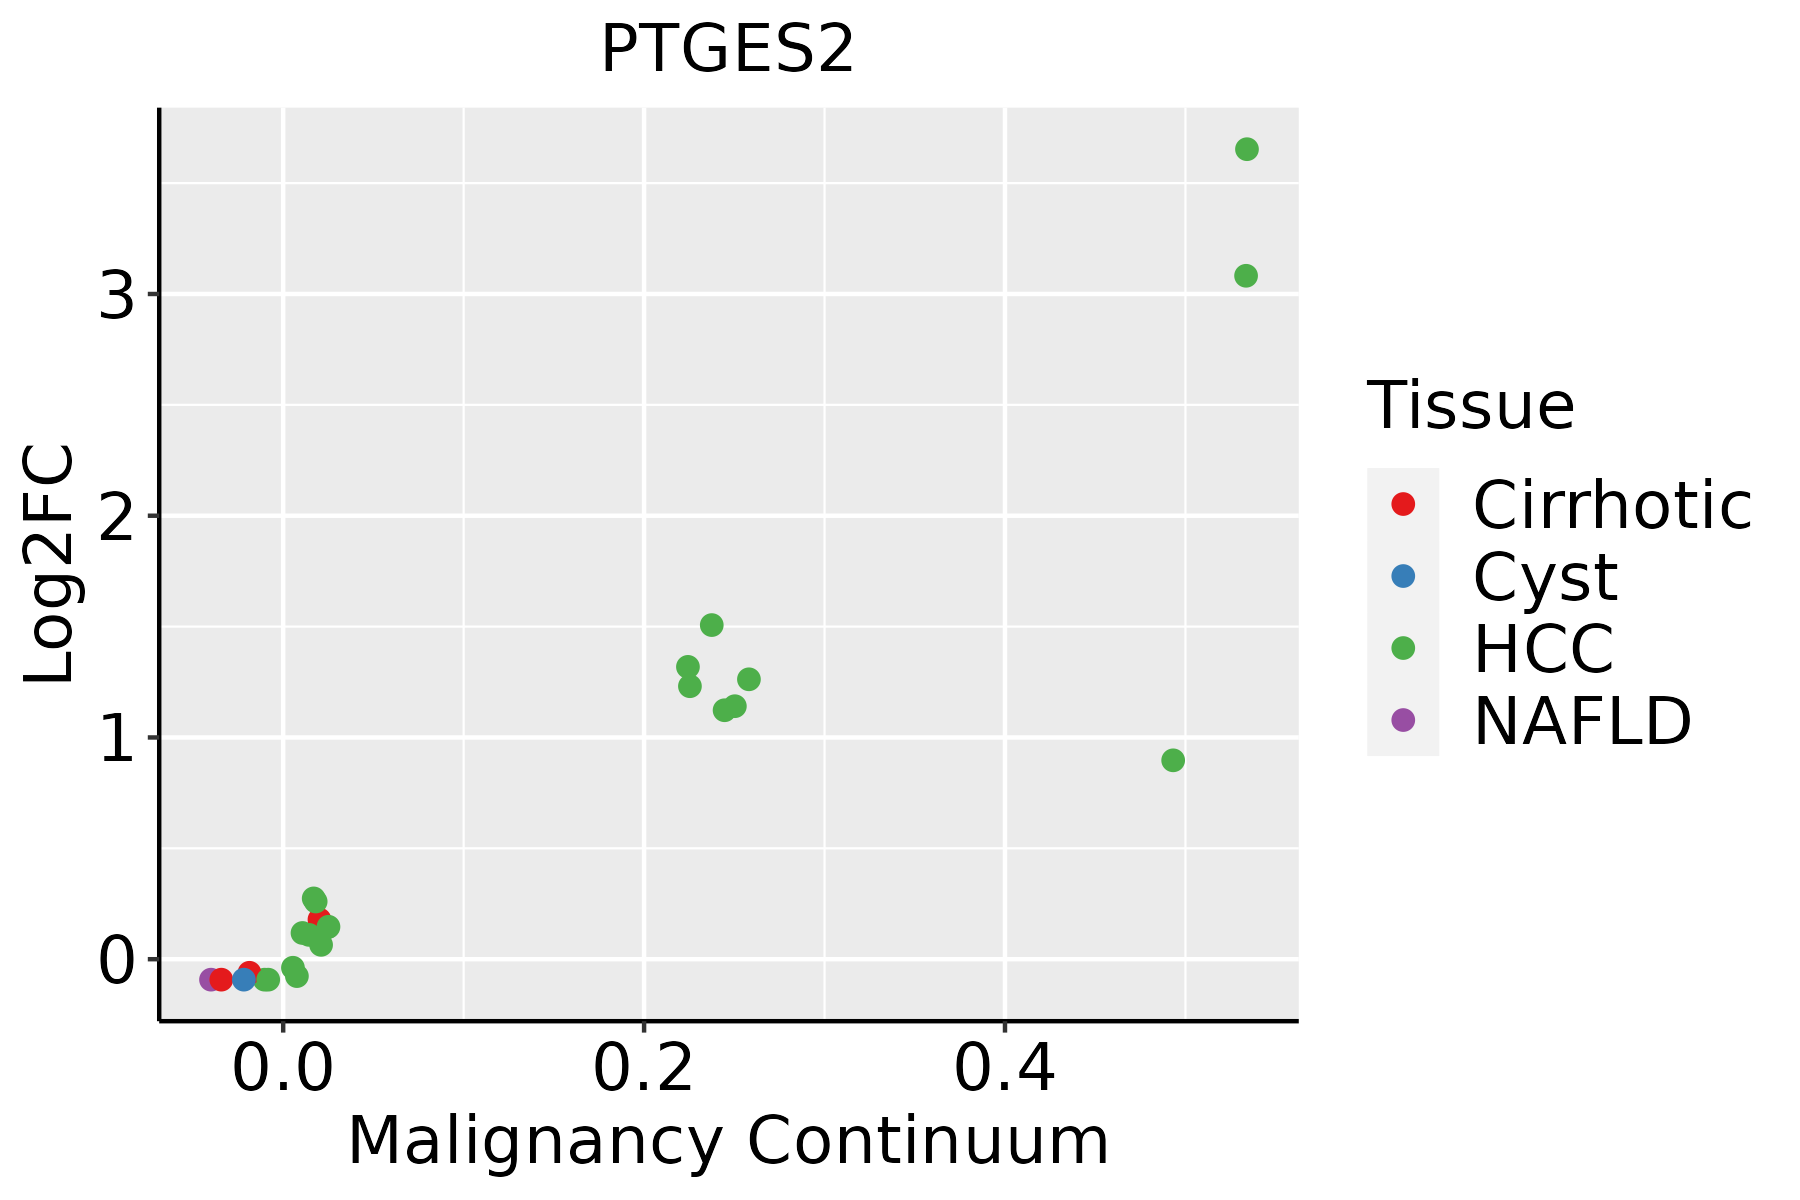 | HCC: Hepatocellular carcinoma |
| NAFLD: Non-alcoholic fatty liver disease | ||
| Oral Cavity |  | EOLP: Erosive Oral lichen planus |
| LP: leukoplakia | ||
| NEOLP: Non-erosive oral lichen planus | ||
| OSCC: Oral squamous cell carcinoma | ||
| Skin | 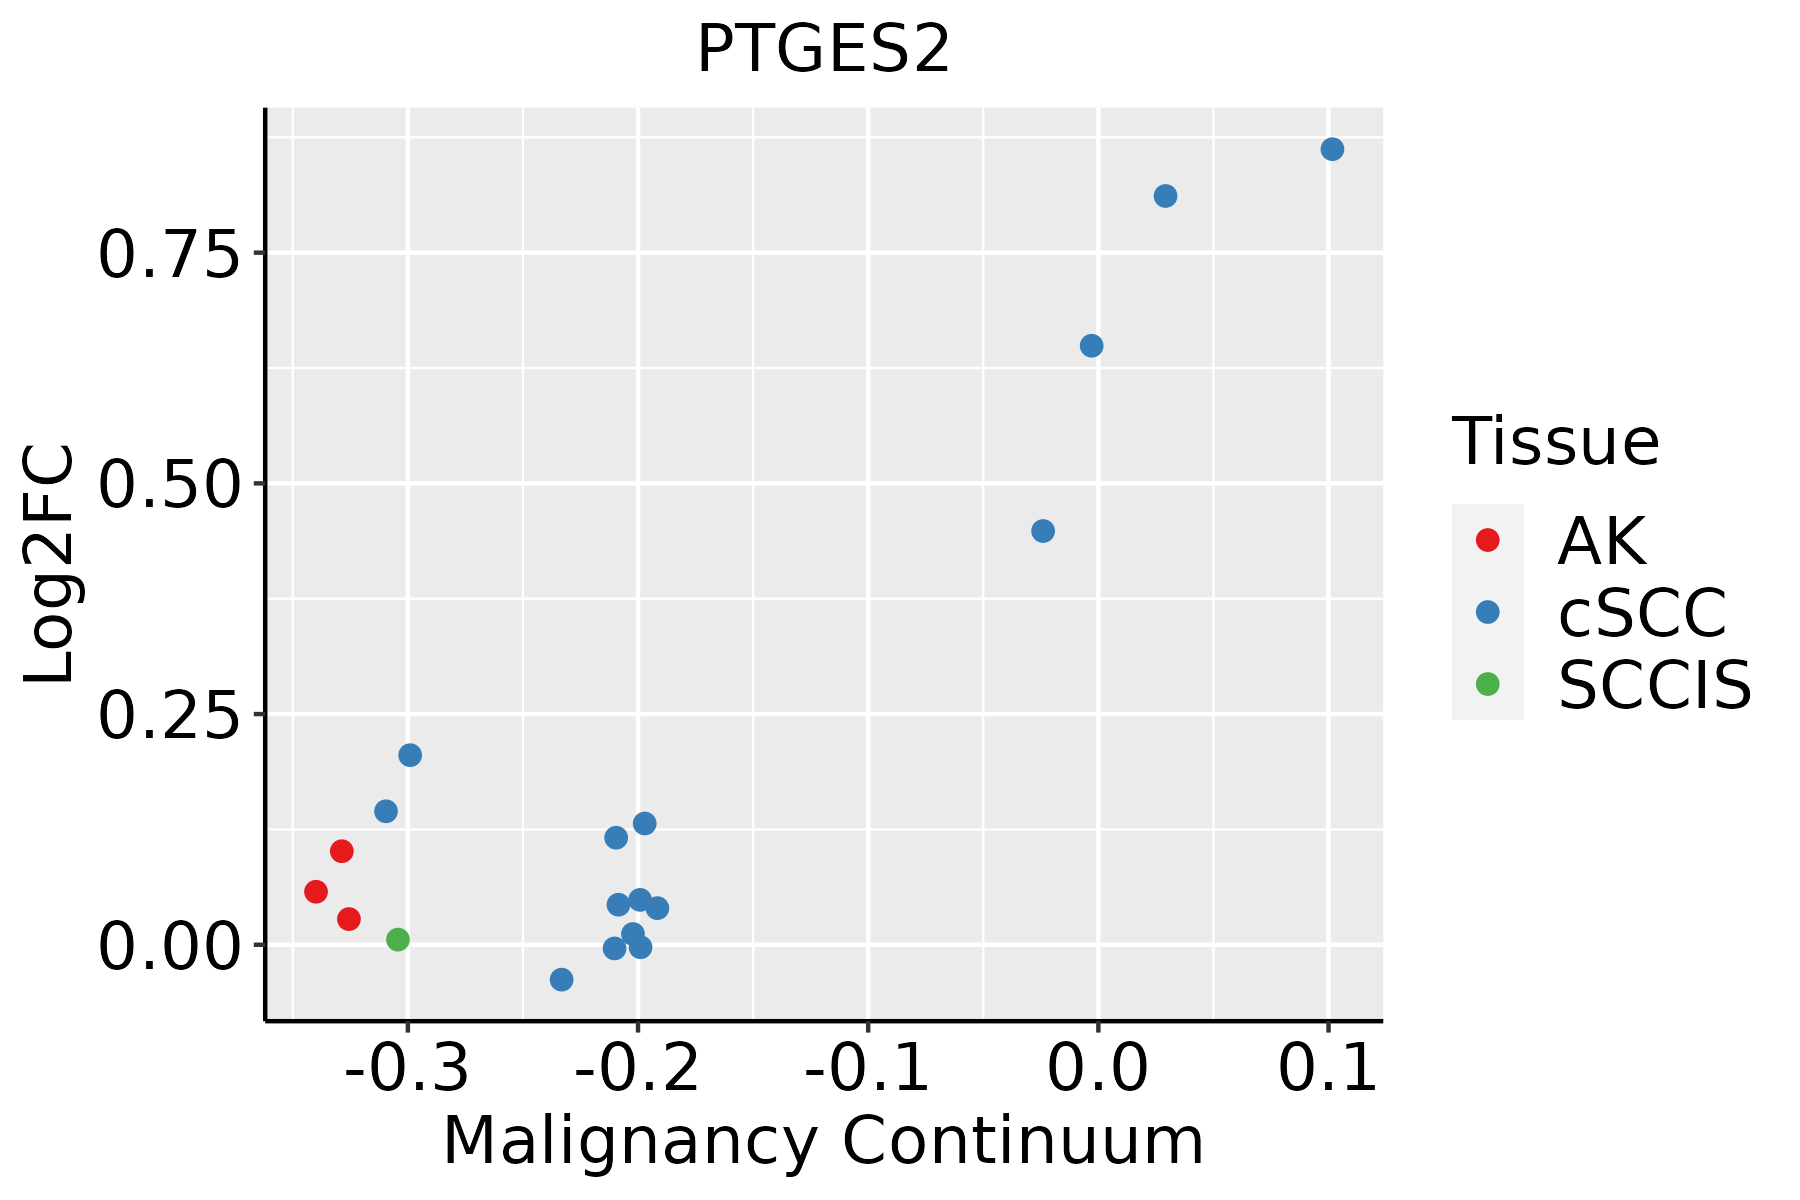 | AK: Actinic keratosis |
| cSCC: Cutaneous squamous cell carcinoma | ||
| SCCIS:squamous cell carcinoma in situ | ||
| Thyroid | 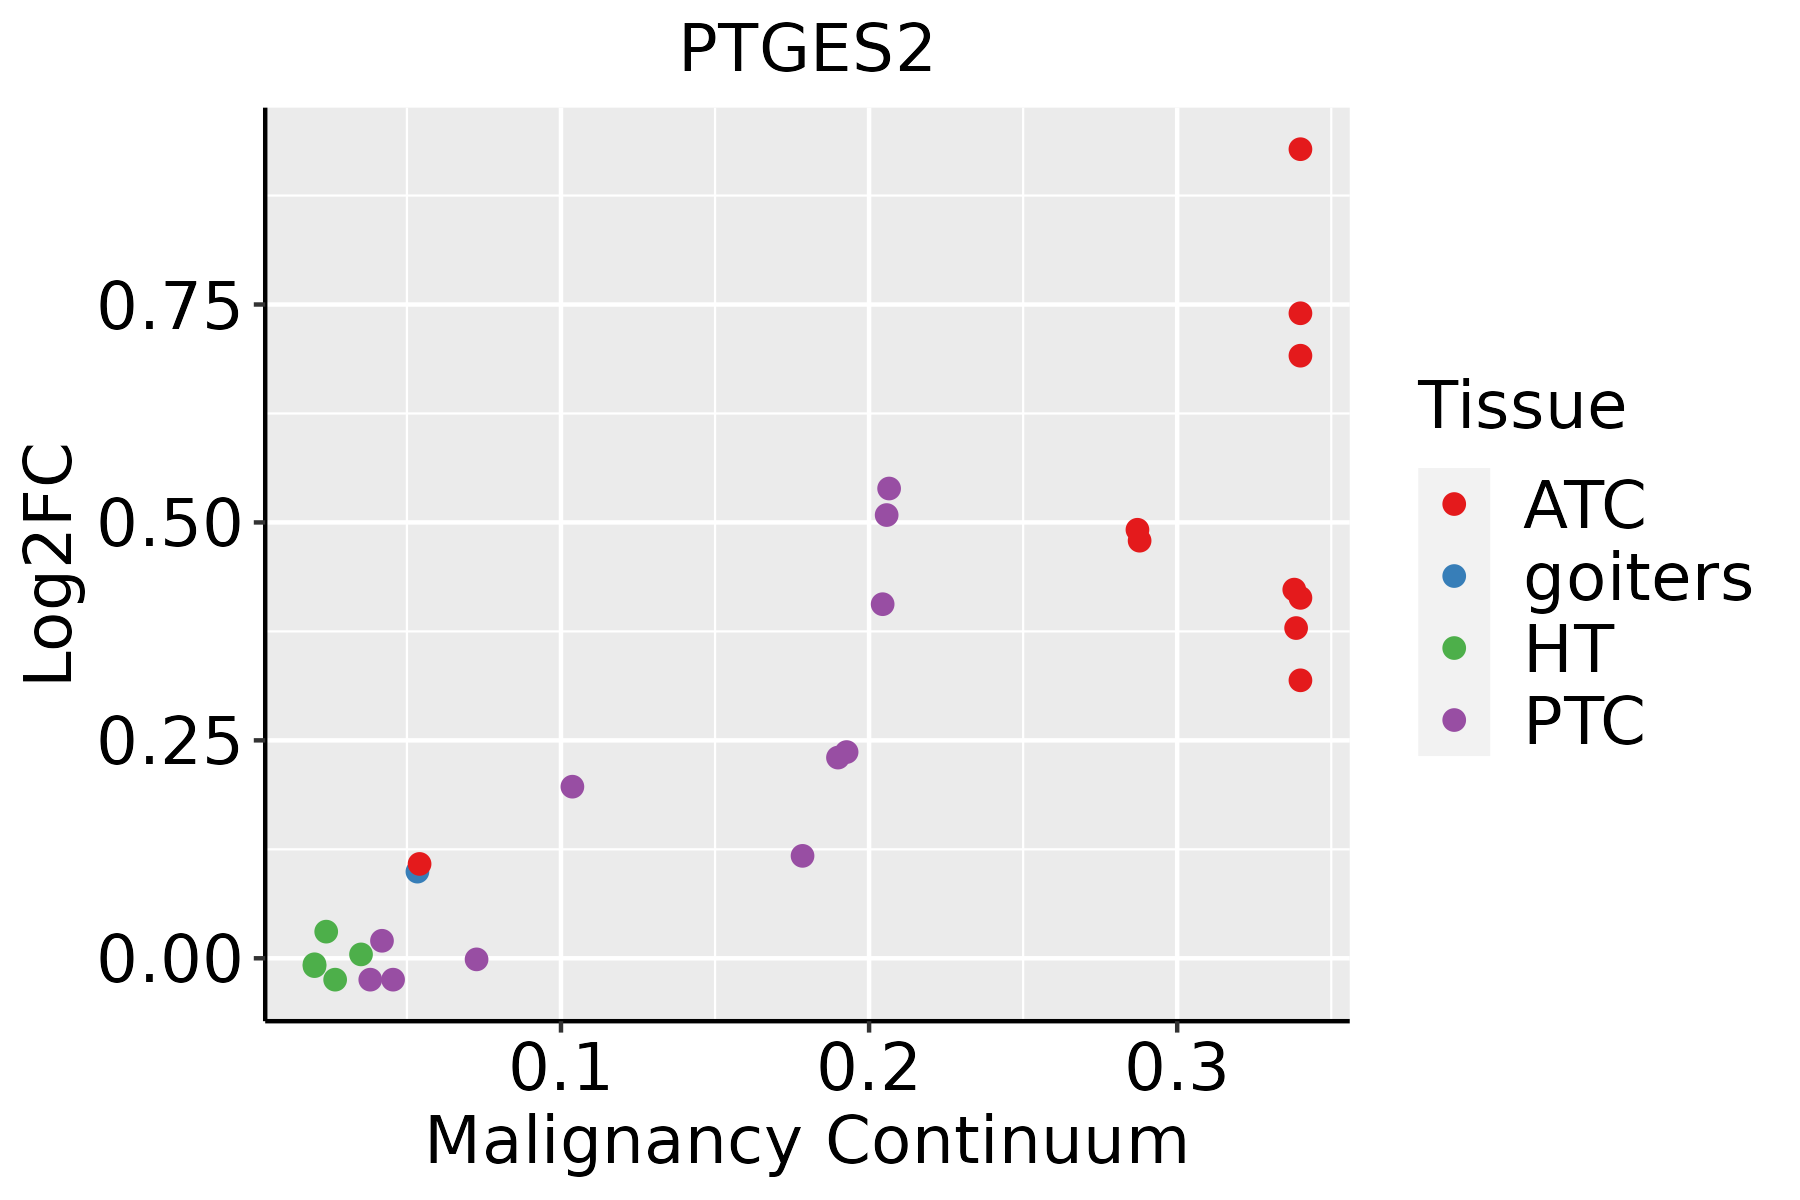 | ATC: Anaplastic thyroid cancer |
| HT: Hashimoto's thyroiditis | ||
| PTC: Papillary thyroid cancer |
| ∗log2FC in expression of this searched gene in stem-like cells from each diseased tissue sample relative to stem-like cells in normal samples in each tissue plotted against the malignancy continuum. Samples are colored based on if they are from different disease stage. |
Top |
Malignant transformation related pathway analysis |
| Find out the enriched GO biological processes and KEGG pathways involved in transition from healthy to precancer to cancer |
| Tissue | Disease Stage | Enriched GO biological Processes |
| Colorectum | AD |  |
| Colorectum | SER |  |
| Colorectum | MSS |  |
| Colorectum | MSI-H |  |
| Colorectum | FAP |  |
| ∗Top 15 enriched GO BP terms are showed in the bar plot of each disease state in each tissue. Each row represents a significant GO biological process which is colored according to the -log10(p.adjust). |
| Page: 1 2 3 4 5 6 7 8 9 |
| GO ID | Tissue | Disease Stage | Description | Gene Ratio | Bg Ratio | pvalue | p.adjust | Count |
| GO:0006631 | Colorectum | AD | fatty acid metabolic process | 114/3918 | 390/18723 | 5.58e-05 | 9.44e-04 | 114 |
| GO:0006790 | Colorectum | AD | sulfur compound metabolic process | 101/3918 | 339/18723 | 6.46e-05 | 1.07e-03 | 101 |
| GO:0006575 | Colorectum | AD | cellular modified amino acid metabolic process | 59/3918 | 188/18723 | 4.80e-04 | 5.27e-03 | 59 |
| GO:00065751 | Colorectum | MSS | cellular modified amino acid metabolic process | 55/3467 | 188/18723 | 2.16e-04 | 3.01e-03 | 55 |
| GO:00067902 | Colorectum | MSS | sulfur compound metabolic process | 85/3467 | 339/18723 | 1.52e-03 | 1.39e-02 | 85 |
| GO:00066312 | Colorectum | MSS | fatty acid metabolic process | 95/3467 | 390/18723 | 2.20e-03 | 1.84e-02 | 95 |
| GO:0046394 | Colorectum | MSS | carboxylic acid biosynthetic process | 76/3467 | 314/18723 | 6.71e-03 | 4.38e-02 | 76 |
| GO:0016053 | Colorectum | MSS | organic acid biosynthetic process | 76/3467 | 316/18723 | 7.88e-03 | 4.84e-02 | 76 |
| GO:00065752 | Colorectum | MSI-H | cellular modified amino acid metabolic process | 25/1319 | 188/18723 | 1.61e-03 | 2.39e-02 | 25 |
| GO:00463941 | Colorectum | MSI-H | carboxylic acid biosynthetic process | 36/1319 | 314/18723 | 2.68e-03 | 3.48e-02 | 36 |
| GO:00160531 | Colorectum | MSI-H | organic acid biosynthetic process | 36/1319 | 316/18723 | 2.98e-03 | 3.78e-02 | 36 |
| GO:00066313 | Colorectum | FAP | fatty acid metabolic process | 81/2622 | 390/18723 | 1.43e-04 | 2.24e-03 | 81 |
| GO:00066929 | Esophagus | HGIN | prostanoid metabolic process | 17/2587 | 49/18723 | 1.84e-04 | 3.48e-03 | 17 |
| GO:00066939 | Esophagus | HGIN | prostaglandin metabolic process | 17/2587 | 49/18723 | 1.84e-04 | 3.48e-03 | 17 |
| GO:00067497 | Esophagus | HGIN | glutathione metabolic process | 20/2587 | 64/18723 | 2.63e-04 | 4.58e-03 | 20 |
| GO:00067906 | Esophagus | ESCC | sulfur compound metabolic process | 201/8552 | 339/18723 | 2.64e-07 | 3.94e-06 | 201 |
| GO:00066318 | Esophagus | ESCC | fatty acid metabolic process | 217/8552 | 390/18723 | 4.21e-05 | 3.39e-04 | 217 |
| GO:00065757 | Esophagus | ESCC | cellular modified amino acid metabolic process | 112/8552 | 188/18723 | 8.31e-05 | 6.06e-04 | 112 |
| GO:00463948 | Esophagus | ESCC | carboxylic acid biosynthetic process | 175/8552 | 314/18723 | 1.98e-04 | 1.26e-03 | 175 |
| GO:00160538 | Esophagus | ESCC | organic acid biosynthetic process | 175/8552 | 316/18723 | 3.04e-04 | 1.82e-03 | 175 |
| Page: 1 2 3 |
| Pathway ID | Tissue | Disease Stage | Description | Gene Ratio | Bg Ratio | pvalue | p.adjust | qvalue | Count |
| Page: 1 |
Top |
Cell-cell communication analysis |
| Identification of potential cell-cell interactions between two cell types and their ligand-receptor pairs for different disease states |
| Ligand | Receptor | LRpair | Pathway | Tissue | Disease Stage |
| Page: 1 |
Top |
Single-cell gene regulatory network inference analysis |
| Find out the significant the regulons (TFs) and the target genes of each regulon across cell types for different disease states |
| TF | Cell Type | Tissue | Disease Stage | Target Gene | RSS | Regulon Activity |
| ∗The dot plots of a searched regulon are shown for all cell subpopulations in each disease state of each tissue based on the regulon specific score inferred using pySCENIC and by calculating the average expression. |
| Page: 1 |
Top |
Somatic mutation of malignant transformation related genes |
| Annotation of somatic variants for genes involved in malignant transformation |
| Hugo Symbol | Variant Class | Variant Classification | dbSNP RS | HGVSc | HGVSp | HGVSp Short | SWISSPROT | BIOTYPE | SIFT | PolyPhen | Tumor Sample Barcode | Tissue | Histology | Sex | Age | Stage | Therapy Types | Drugs | Outcome |
| PTGES2 | SNV | Missense_Mutation | rs770175597 | c.350G>A | p.Arg117Gln | p.R117Q | Q9H7Z7 | protein_coding | deleterious(0) | probably_damaging(1) | TCGA-AC-A5XS-01 | Breast | breast invasive carcinoma | Female | >=65 | I/II | Hormone Therapy | femara | SD |
| PTGES2 | SNV | Missense_Mutation | c.1099G>C | p.Glu367Gln | p.E367Q | Q9H7Z7 | protein_coding | tolerated(0.11) | benign(0.07) | TCGA-E9-A3HO-01 | Breast | breast invasive carcinoma | Female | <65 | I/II | Chemotherapy | cyclophosphamide | CR | |
| PTGES2 | deletion | Frame_Shift_Del | novel | c.378delN | p.Tyr127ThrfsTer6 | p.Y127Tfs*6 | Q9H7Z7 | protein_coding | TCGA-D8-A27V-01 | Breast | breast invasive carcinoma | Female | <65 | I/II | Hormone Therapy | tamoxiphen | SD | ||
| PTGES2 | SNV | Missense_Mutation | novel | c.301N>A | p.Gln101Lys | p.Q101K | Q9H7Z7 | protein_coding | tolerated(1) | benign(0.001) | TCGA-C5-A8YR-01 | Cervix | cervical & endocervical cancer | Female | <65 | I/II | Unknown | Unknown | PD |
| PTGES2 | SNV | Missense_Mutation | c.848N>T | p.Ala283Val | p.A283V | Q9H7Z7 | protein_coding | deleterious(0) | probably_damaging(0.992) | TCGA-AA-3815-01 | Colorectum | colon adenocarcinoma | Female | >=65 | I/II | Unknown | Unknown | SD | |
| PTGES2 | SNV | Missense_Mutation | rs199848207 | c.296G>A | p.Arg99His | p.R99H | Q9H7Z7 | protein_coding | tolerated(0.27) | benign(0) | TCGA-AA-3984-01 | Colorectum | colon adenocarcinoma | Female | <65 | I/II | Unknown | Unknown | SD |
| PTGES2 | SNV | Missense_Mutation | c.955G>T | p.Gly319Cys | p.G319C | Q9H7Z7 | protein_coding | deleterious(0) | probably_damaging(1) | TCGA-AM-5821-01 | Colorectum | colon adenocarcinoma | Female | >=65 | I/II | Unknown | Unknown | SD | |
| PTGES2 | SNV | Missense_Mutation | rs368606962 | c.796N>T | p.Arg266Cys | p.R266C | Q9H7Z7 | protein_coding | deleterious(0) | benign(0.38) | TCGA-AJ-A3OJ-01 | Endometrium | uterine corpus endometrioid carcinoma | Female | <65 | I/II | Chemotherapy | carboplatin | CR |
| PTGES2 | SNV | Missense_Mutation | novel | c.520A>G | p.Thr174Ala | p.T174A | Q9H7Z7 | protein_coding | deleterious(0) | benign(0.094) | TCGA-AX-A2HJ-01 | Endometrium | uterine corpus endometrioid carcinoma | Female | <65 | I/II | Unknown | Unknown | SD |
| PTGES2 | SNV | Missense_Mutation | rs745728595 | c.1024N>T | p.Arg342Cys | p.R342C | Q9H7Z7 | protein_coding | deleterious(0.03) | probably_damaging(0.979) | TCGA-B5-A0JV-01 | Endometrium | uterine corpus endometrioid carcinoma | Female | <65 | I/II | Unknown | Unknown | PD |
| Page: 1 2 |
Top |
Related drugs of malignant transformation related genes |
| Identification of chemicals and drugs interact with genes involved in malignant transfromation |
| (DGIdb 4.0) |
| Entrez ID | Symbol | Category | Interaction Types | Drug Claim Name | Drug Name | PMIDs |
| 80142 | PTGES2 | ENZYME | inhibitor | 252827470 |
| Page: 1 |

Copyright 2023-Present -The University of Texas Health Science Center at Houston |