
|
|||||
|
 | |
| |
| |
| |
| |
| |
|
Gene: PTGER4 |
Gene summary for PTGER4 |
| Gene information | Species | Human | Gene symbol | PTGER4 | Gene ID | 5734 |
| Gene name | prostaglandin E receptor 4 | |
| Gene Alias | EP4 | |
| Cytomap | 5p13.1 | |
| Gene Type | protein-coding | GO ID | GO:0000165 | UniProtAcc | A0PJF5 |
Top |
Malignant transformation analysis |
| Identification of the aberrant gene expression in precancerous and cancerous lesions by comparing the gene expression of stem-like cells in diseased tissues with normal stem cells |
| Entrez ID | Symbol | Replicates | Species | Organ | Tissue | Adj P-value | Log2FC | Malignancy |
| 5734 | PTGER4 | LZE4T | Human | Esophagus | ESCC | 1.65e-07 | 4.05e-01 | 0.0811 |
| 5734 | PTGER4 | LZE7T | Human | Esophagus | ESCC | 6.49e-03 | 9.76e-02 | 0.0667 |
| 5734 | PTGER4 | LZE20T | Human | Esophagus | ESCC | 1.90e-04 | 2.81e-01 | 0.0662 |
| 5734 | PTGER4 | LZE21D1 | Human | Esophagus | HGIN | 6.81e-04 | 2.69e-01 | 0.0632 |
| 5734 | PTGER4 | LZE22D1 | Human | Esophagus | HGIN | 1.54e-03 | 1.59e-01 | 0.0595 |
| 5734 | PTGER4 | LZE24T | Human | Esophagus | ESCC | 1.39e-09 | 4.95e-01 | 0.0596 |
| 5734 | PTGER4 | LZE21T | Human | Esophagus | ESCC | 7.75e-03 | 3.47e-01 | 0.0655 |
| 5734 | PTGER4 | P2T-E | Human | Esophagus | ESCC | 7.42e-24 | 5.05e-01 | 0.1177 |
| 5734 | PTGER4 | P4T-E | Human | Esophagus | ESCC | 1.02e-16 | 5.24e-01 | 0.1323 |
| 5734 | PTGER4 | P5T-E | Human | Esophagus | ESCC | 5.10e-49 | 9.43e-01 | 0.1327 |
| 5734 | PTGER4 | P8T-E | Human | Esophagus | ESCC | 2.68e-15 | 4.18e-01 | 0.0889 |
| 5734 | PTGER4 | P9T-E | Human | Esophagus | ESCC | 9.65e-03 | 1.41e-01 | 0.1131 |
| 5734 | PTGER4 | P10T-E | Human | Esophagus | ESCC | 5.37e-30 | 6.24e-01 | 0.116 |
| 5734 | PTGER4 | P11T-E | Human | Esophagus | ESCC | 1.31e-07 | 5.01e-01 | 0.1426 |
| 5734 | PTGER4 | P12T-E | Human | Esophagus | ESCC | 2.62e-20 | 5.08e-01 | 0.1122 |
| 5734 | PTGER4 | P15T-E | Human | Esophagus | ESCC | 5.59e-06 | 3.45e-01 | 0.1149 |
| 5734 | PTGER4 | P16T-E | Human | Esophagus | ESCC | 8.84e-05 | 2.49e-01 | 0.1153 |
| 5734 | PTGER4 | P17T-E | Human | Esophagus | ESCC | 1.64e-04 | 1.46e-01 | 0.1278 |
| 5734 | PTGER4 | P20T-E | Human | Esophagus | ESCC | 9.78e-09 | 4.03e-01 | 0.1124 |
| 5734 | PTGER4 | P21T-E | Human | Esophagus | ESCC | 3.21e-14 | 2.98e-01 | 0.1617 |
| Page: 1 2 3 |
| Tissue | Expression Dynamics | Abbreviation |
| Esophagus | 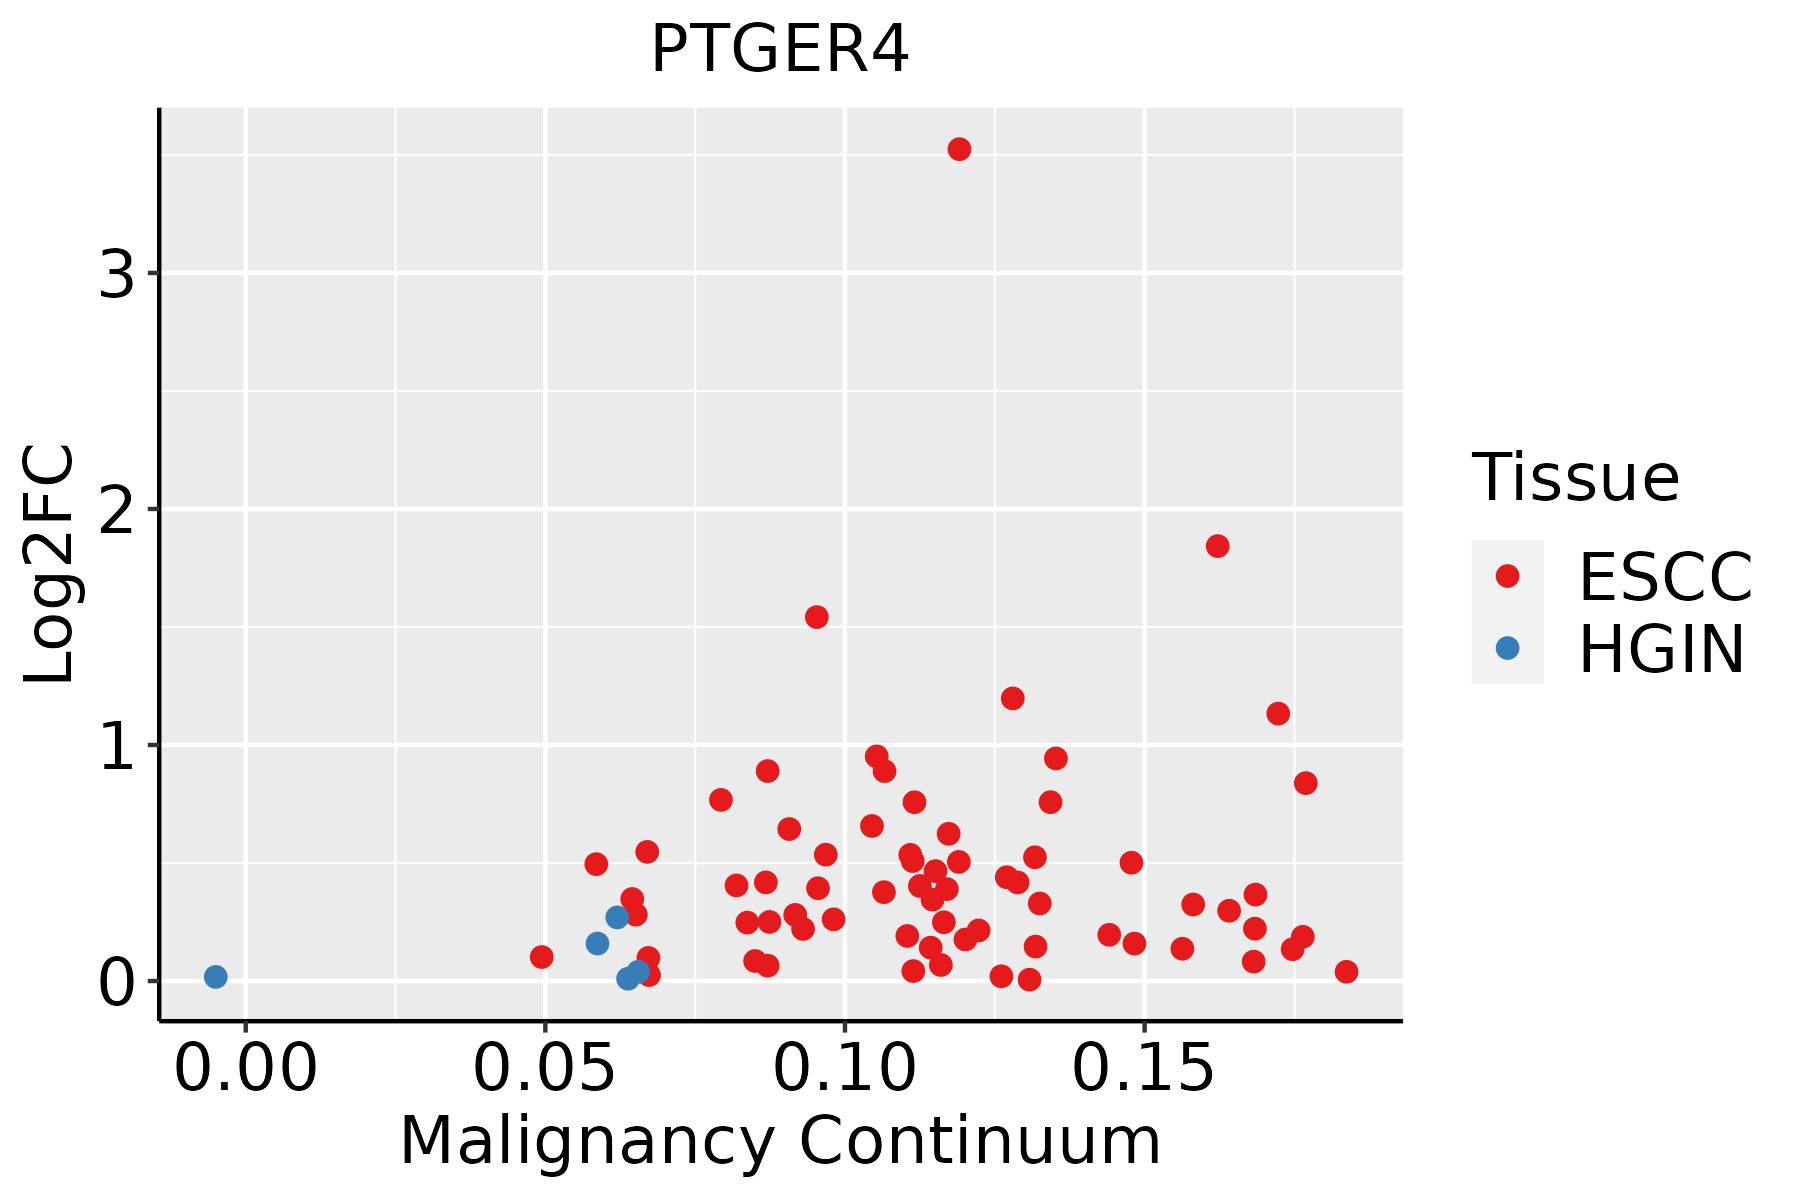 | ESCC: Esophageal squamous cell carcinoma |
| HGIN: High-grade intraepithelial neoplasias | ||
| LGIN: Low-grade intraepithelial neoplasias | ||
| Thyroid | 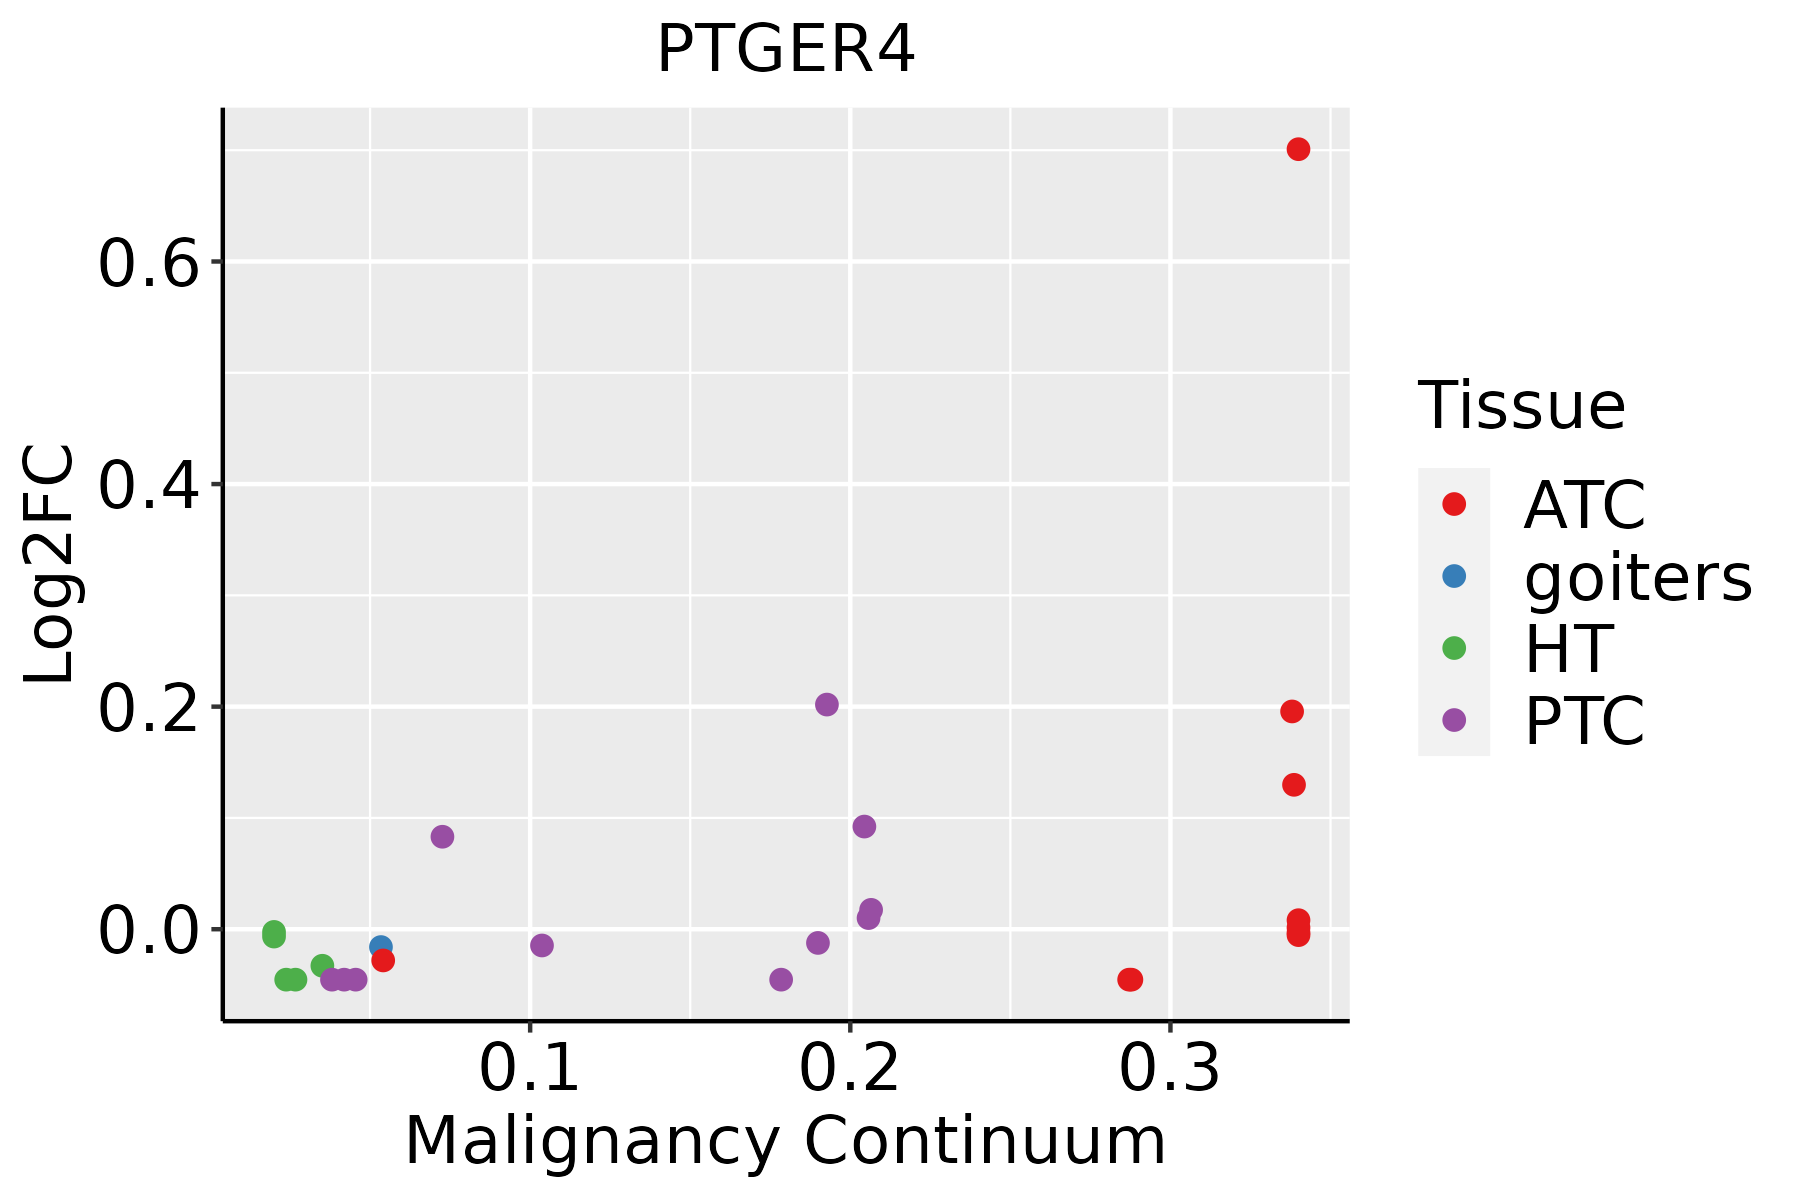 | ATC: Anaplastic thyroid cancer |
| HT: Hashimoto's thyroiditis | ||
| PTC: Papillary thyroid cancer |
| ∗log2FC in expression of this searched gene in stem-like cells from each diseased tissue sample relative to stem-like cells in normal samples in each tissue plotted against the malignancy continuum. Samples are colored based on if they are from different disease stage. |
Top |
Malignant transformation related pathway analysis |
| Find out the enriched GO biological processes and KEGG pathways involved in transition from healthy to precancer to cancer |
| Tissue | Disease Stage | Enriched GO biological Processes |
| Colorectum | AD |  |
| Colorectum | SER |  |
| Colorectum | MSS |  |
| Colorectum | MSI-H |  |
| Colorectum | FAP |  |
| ∗Top 15 enriched GO BP terms are showed in the bar plot of each disease state in each tissue. Each row represents a significant GO biological process which is colored according to the -log10(p.adjust). |
| Page: 1 2 3 4 5 6 7 8 9 |
| GO ID | Tissue | Disease Stage | Description | Gene Ratio | Bg Ratio | pvalue | p.adjust | Count |
| GO:004325427 | Esophagus | HGIN | regulation of protein-containing complex assembly | 94/2587 | 428/18723 | 2.39e-06 | 8.55e-05 | 94 |
| GO:007149626 | Esophagus | HGIN | cellular response to external stimulus | 71/2587 | 320/18723 | 2.77e-05 | 7.19e-04 | 71 |
| GO:190165420 | Esophagus | HGIN | response to ketone | 48/2587 | 194/18723 | 3.17e-05 | 8.12e-04 | 48 |
| GO:190290327 | Esophagus | HGIN | regulation of supramolecular fiber organization | 79/2587 | 383/18723 | 1.40e-04 | 2.81e-03 | 79 |
| GO:009730520 | Esophagus | HGIN | response to alcohol | 54/2587 | 253/18723 | 6.46e-04 | 8.87e-03 | 54 |
| GO:003297027 | Esophagus | HGIN | regulation of actin filament-based process | 77/2587 | 397/18723 | 1.14e-03 | 1.39e-02 | 77 |
| GO:007121418 | Esophagus | HGIN | cellular response to abiotic stimulus | 66/2587 | 331/18723 | 1.21e-03 | 1.45e-02 | 66 |
| GO:010400418 | Esophagus | HGIN | cellular response to environmental stimulus | 66/2587 | 331/18723 | 1.21e-03 | 1.45e-02 | 66 |
| GO:003295627 | Esophagus | HGIN | regulation of actin cytoskeleton organization | 69/2587 | 358/18723 | 2.35e-03 | 2.39e-02 | 69 |
| GO:003133320 | Esophagus | HGIN | negative regulation of protein-containing complex assembly | 32/2587 | 141/18723 | 2.80e-03 | 2.74e-02 | 32 |
| GO:000150316 | Esophagus | HGIN | ossification | 75/2587 | 408/18723 | 5.49e-03 | 4.49e-02 | 75 |
| GO:0043254111 | Esophagus | ESCC | regulation of protein-containing complex assembly | 278/8552 | 428/18723 | 3.81e-16 | 2.77e-14 | 278 |
| GO:0071496111 | Esophagus | ESCC | cellular response to external stimulus | 215/8552 | 320/18723 | 4.29e-15 | 2.43e-13 | 215 |
| GO:1902903111 | Esophagus | ESCC | regulation of supramolecular fiber organization | 237/8552 | 383/18723 | 9.06e-11 | 2.75e-09 | 237 |
| GO:007121419 | Esophagus | ESCC | cellular response to abiotic stimulus | 206/8552 | 331/18723 | 7.52e-10 | 1.88e-08 | 206 |
| GO:010400419 | Esophagus | ESCC | cellular response to environmental stimulus | 206/8552 | 331/18723 | 7.52e-10 | 1.88e-08 | 206 |
| GO:000701527 | Esophagus | ESCC | actin filament organization | 259/8552 | 442/18723 | 2.37e-08 | 4.50e-07 | 259 |
| GO:003109818 | Esophagus | ESCC | stress-activated protein kinase signaling cascade | 154/8552 | 247/18723 | 8.53e-08 | 1.44e-06 | 154 |
| GO:0032970111 | Esophagus | ESCC | regulation of actin filament-based process | 231/8552 | 397/18723 | 2.91e-07 | 4.20e-06 | 231 |
| GO:0032956111 | Esophagus | ESCC | regulation of actin cytoskeleton organization | 210/8552 | 358/18723 | 4.40e-07 | 6.00e-06 | 210 |
| Page: 1 2 3 4 5 6 |
| Pathway ID | Tissue | Disease Stage | Description | Gene Ratio | Bg Ratio | pvalue | p.adjust | qvalue | Count |
| hsa0516330 | Esophagus | HGIN | Human cytomegalovirus infection | 51/1383 | 225/8465 | 7.67e-03 | 4.63e-02 | 3.68e-02 | 51 |
| hsa05163113 | Esophagus | HGIN | Human cytomegalovirus infection | 51/1383 | 225/8465 | 7.67e-03 | 4.63e-02 | 3.68e-02 | 51 |
| hsa0516510 | Esophagus | ESCC | Human papillomavirus infection | 215/4205 | 331/8465 | 7.86e-09 | 7.12e-08 | 3.65e-08 | 215 |
| hsa05163210 | Esophagus | ESCC | Human cytomegalovirus infection | 148/4205 | 225/8465 | 5.73e-07 | 4.00e-06 | 2.05e-06 | 148 |
| hsa0516515 | Esophagus | ESCC | Human papillomavirus infection | 215/4205 | 331/8465 | 7.86e-09 | 7.12e-08 | 3.65e-08 | 215 |
| hsa0516338 | Esophagus | ESCC | Human cytomegalovirus infection | 148/4205 | 225/8465 | 5.73e-07 | 4.00e-06 | 2.05e-06 | 148 |
| Page: 1 |
Top |
Cell-cell communication analysis |
| Identification of potential cell-cell interactions between two cell types and their ligand-receptor pairs for different disease states |
| Ligand | Receptor | LRpair | Pathway | Tissue | Disease Stage |
| Page: 1 |
Top |
Single-cell gene regulatory network inference analysis |
| Find out the significant the regulons (TFs) and the target genes of each regulon across cell types for different disease states |
| TF | Cell Type | Tissue | Disease Stage | Target Gene | RSS | Regulon Activity |
| ∗The dot plots of a searched regulon are shown for all cell subpopulations in each disease state of each tissue based on the regulon specific score inferred using pySCENIC and by calculating the average expression. |
| Page: 1 |
Top |
Somatic mutation of malignant transformation related genes |
| Annotation of somatic variants for genes involved in malignant transformation |
| Hugo Symbol | Variant Class | Variant Classification | dbSNP RS | HGVSc | HGVSp | HGVSp Short | SWISSPROT | BIOTYPE | SIFT | PolyPhen | Tumor Sample Barcode | Tissue | Histology | Sex | Age | Stage | Therapy Types | Drugs | Outcome |
| PTGER4 | SNV | Missense_Mutation | novel | c.157N>T | p.Thr53Ser | p.T53S | P35408 | protein_coding | deleterious(0.01) | possibly_damaging(0.72) | TCGA-A7-A0CE-01 | Breast | breast invasive carcinoma | Female | <65 | I/II | Chemotherapy | adriamycin | SD |
| PTGER4 | SNV | Missense_Mutation | rs755244149 | c.1073N>A | p.Arg358His | p.R358H | P35408 | protein_coding | tolerated(0.33) | benign(0) | TCGA-A8-A09M-01 | Breast | breast invasive carcinoma | Female | >=65 | III/IV | Chemotherapy | paclitaxel | CR |
| PTGER4 | SNV | Missense_Mutation | novel | c.1093N>T | p.Asp365Tyr | p.D365Y | P35408 | protein_coding | deleterious(0) | benign(0.112) | TCGA-AC-A5XS-01 | Breast | breast invasive carcinoma | Female | >=65 | I/II | Hormone Therapy | femara | SD |
| PTGER4 | insertion | Nonsense_Mutation | novel | c.155_156insAGTTTATAAATATTAAT | p.Thr53ValfsTer5 | p.T53Vfs*5 | P35408 | protein_coding | TCGA-A7-A0CE-01 | Breast | breast invasive carcinoma | Female | <65 | I/II | Chemotherapy | adriamycin | SD | ||
| PTGER4 | SNV | Missense_Mutation | novel | c.1349G>A | p.Ser450Asn | p.S450N | P35408 | protein_coding | tolerated_low_confidence(0.32) | benign(0) | TCGA-2W-A8YY-01 | Cervix | cervical & endocervical cancer | Female | <65 | I/II | Chemotherapy | cisplatin | CR |
| PTGER4 | SNV | Missense_Mutation | c.956N>T | p.Ser319Phe | p.S319F | P35408 | protein_coding | deleterious(0) | benign(0.209) | TCGA-C5-A7CO-01 | Cervix | cervical & endocervical cancer | Female | >=65 | I/II | Chemotherapy | cisplatin | SD | |
| PTGER4 | SNV | Missense_Mutation | rs371545658 | c.23N>T | p.Ser8Leu | p.S8L | P35408 | protein_coding | tolerated(0.14) | benign(0.003) | TCGA-FU-A3HZ-01 | Cervix | cervical & endocervical cancer | Female | <65 | I/II | Chemotherapy | cisplatin | CR |
| PTGER4 | SNV | Missense_Mutation | c.1010N>G | p.Leu337Arg | p.L337R | P35408 | protein_coding | deleterious(0) | benign(0.052) | TCGA-A6-2686-01 | Colorectum | colon adenocarcinoma | Female | >=65 | I/II | Unknown | Unknown | SD | |
| PTGER4 | SNV | Missense_Mutation | c.947N>A | p.Arg316Gln | p.R316Q | P35408 | protein_coding | deleterious(0) | probably_damaging(0.995) | TCGA-AA-3510-01 | Colorectum | colon adenocarcinoma | Male | >=65 | I/II | Unknown | Unknown | SD | |
| PTGER4 | SNV | Missense_Mutation | novel | c.317N>A | p.Gly106Asp | p.G106D | P35408 | protein_coding | deleterious(0.01) | probably_damaging(0.933) | TCGA-AA-3949-01 | Colorectum | colon adenocarcinoma | Female | >=65 | III/IV | Unknown | Unknown | SD |
| Page: 1 2 3 4 5 6 7 8 |
Top |
Related drugs of malignant transformation related genes |
| Identification of chemicals and drugs interact with genes involved in malignant transfromation |
| (DGIdb 4.0) |
| Entrez ID | Symbol | Category | Interaction Types | Drug Claim Name | Drug Name | PMIDs |
| 5734 | PTGER4 | DRUGGABLE GENOME, G PROTEIN COUPLED RECEPTOR, KINASE | DINOPROSTONE | DINOPROSTONE | ||
| 5734 | PTGER4 | DRUGGABLE GENOME, G PROTEIN COUPLED RECEPTOR, KINASE | agonist | 178102483 | ||
| 5734 | PTGER4 | DRUGGABLE GENOME, G PROTEIN COUPLED RECEPTOR, KINASE | agonist | 135650038 | ||
| 5734 | PTGER4 | DRUGGABLE GENOME, G PROTEIN COUPLED RECEPTOR, KINASE | agonist | 178102476 | ||
| 5734 | PTGER4 | DRUGGABLE GENOME, G PROTEIN COUPLED RECEPTOR, KINASE | agonist | 135650056 | CARBACYCLIN | |
| 5734 | PTGER4 | DRUGGABLE GENOME, G PROTEIN COUPLED RECEPTOR, KINASE | antagonist | 178100865 | CHEMBL597997 | |
| 5734 | PTGER4 | DRUGGABLE GENOME, G PROTEIN COUPLED RECEPTOR, KINASE | agonist | 135650094 | CICAPROST | |
| 5734 | PTGER4 | DRUGGABLE GENOME, G PROTEIN COUPLED RECEPTOR, KINASE | agonist | 135650378 | ILOPROST | |
| 5734 | PTGER4 | DRUGGABLE GENOME, G PROTEIN COUPLED RECEPTOR, KINASE | antagonist | 178102482 | GRAPIPRANT | |
| 5734 | PTGER4 | DRUGGABLE GENOME, G PROTEIN COUPLED RECEPTOR, KINASE | BETAMETHASONE | BETAMETHASONE | 17515865 |
| Page: 1 2 3 4 5 6 |

Copyright 2023-Present -The University of Texas Health Science Center at Houston |