
|
|||||
|
 | |
| |
| |
| |
| |
| |
|
Gene: PTGDS |
Gene summary for PTGDS |
| Gene information | Species | Human | Gene symbol | PTGDS | Gene ID | 5730 |
| Gene name | prostaglandin D2 synthase | |
| Gene Alias | L-PGDS | |
| Cytomap | 9q34.3 | |
| Gene Type | protein-coding | GO ID | GO:0001516 | UniProtAcc | A0A024R8G3 |
Top |
Malignant transformation analysis |
| Identification of the aberrant gene expression in precancerous and cancerous lesions by comparing the gene expression of stem-like cells in diseased tissues with normal stem cells |
| Entrez ID | Symbol | Replicates | Species | Organ | Tissue | Adj P-value | Log2FC | Malignancy |
| 5730 | PTGDS | N_HPV_2 | Human | Cervix | N_HPV | 8.39e-04 | 3.18e-01 | -0.0131 |
| 5730 | PTGDS | H2 | Human | Cervix | HSIL_HPV | 1.87e-05 | 2.38e-01 | 0.0632 |
| 5730 | PTGDS | AEH-subject1 | Human | Endometrium | AEH | 3.22e-42 | -9.45e-01 | -0.3059 |
| 5730 | PTGDS | AEH-subject2 | Human | Endometrium | AEH | 2.35e-23 | -8.39e-01 | -0.2525 |
| 5730 | PTGDS | AEH-subject3 | Human | Endometrium | AEH | 2.19e-27 | -8.41e-01 | -0.2576 |
| 5730 | PTGDS | AEH-subject4 | Human | Endometrium | AEH | 1.64e-03 | -5.18e-01 | -0.2657 |
| 5730 | PTGDS | AEH-subject5 | Human | Endometrium | AEH | 6.46e-28 | -8.74e-01 | -0.2953 |
| 5730 | PTGDS | EEC-subject1 | Human | Endometrium | EEC | 5.75e-25 | -8.42e-01 | -0.2682 |
| 5730 | PTGDS | EEC-subject2 | Human | Endometrium | EEC | 3.04e-39 | -9.38e-01 | -0.2607 |
| 5730 | PTGDS | EEC-subject3 | Human | Endometrium | EEC | 6.05e-38 | -8.84e-01 | -0.2525 |
| 5730 | PTGDS | EEC-subject4 | Human | Endometrium | EEC | 1.29e-20 | -7.29e-01 | -0.2571 |
| 5730 | PTGDS | EEC-subject5 | Human | Endometrium | EEC | 1.80e-20 | -7.77e-01 | -0.249 |
| 5730 | PTGDS | GSM5276935 | Human | Endometrium | EEC | 2.52e-35 | -9.15e-01 | -0.123 |
| 5730 | PTGDS | GSM6177620_NYU_UCEC1_lib1_lib1 | Human | Endometrium | EEC | 4.13e-31 | -9.56e-01 | -0.1869 |
| 5730 | PTGDS | GSM6177620_NYU_UCEC1_lib2_lib2 | Human | Endometrium | EEC | 1.66e-24 | -9.25e-01 | -0.1875 |
| 5730 | PTGDS | GSM6177620_NYU_UCEC1_lib3_lib3 | Human | Endometrium | EEC | 2.92e-32 | -9.55e-01 | -0.1883 |
| 5730 | PTGDS | GSM6177621_NYU_UCEC2_lib1_lib1 | Human | Endometrium | EEC | 3.83e-22 | -7.17e-01 | -0.1934 |
| 5730 | PTGDS | GSM6177622_NYU_UCEC3_lib1_lib1 | Human | Endometrium | EEC | 2.12e-50 | -9.71e-01 | -0.1917 |
| 5730 | PTGDS | GSM6177622_NYU_UCEC3_lib2_lib2 | Human | Endometrium | EEC | 2.87e-45 | -9.71e-01 | -0.1916 |
| 5730 | PTGDS | GSM6177623_NYU_UCEC3_Vis | Human | Endometrium | EEC | 3.43e-23 | -7.91e-01 | -0.1269 |
| Page: 1 2 3 4 5 |
| Tissue | Expression Dynamics | Abbreviation |
| Cervix |  | CC: Cervix cancer |
| HSIL_HPV: HPV-infected high-grade squamous intraepithelial lesions | ||
| N_HPV: HPV-infected normal cervix | ||
| Endometrium | 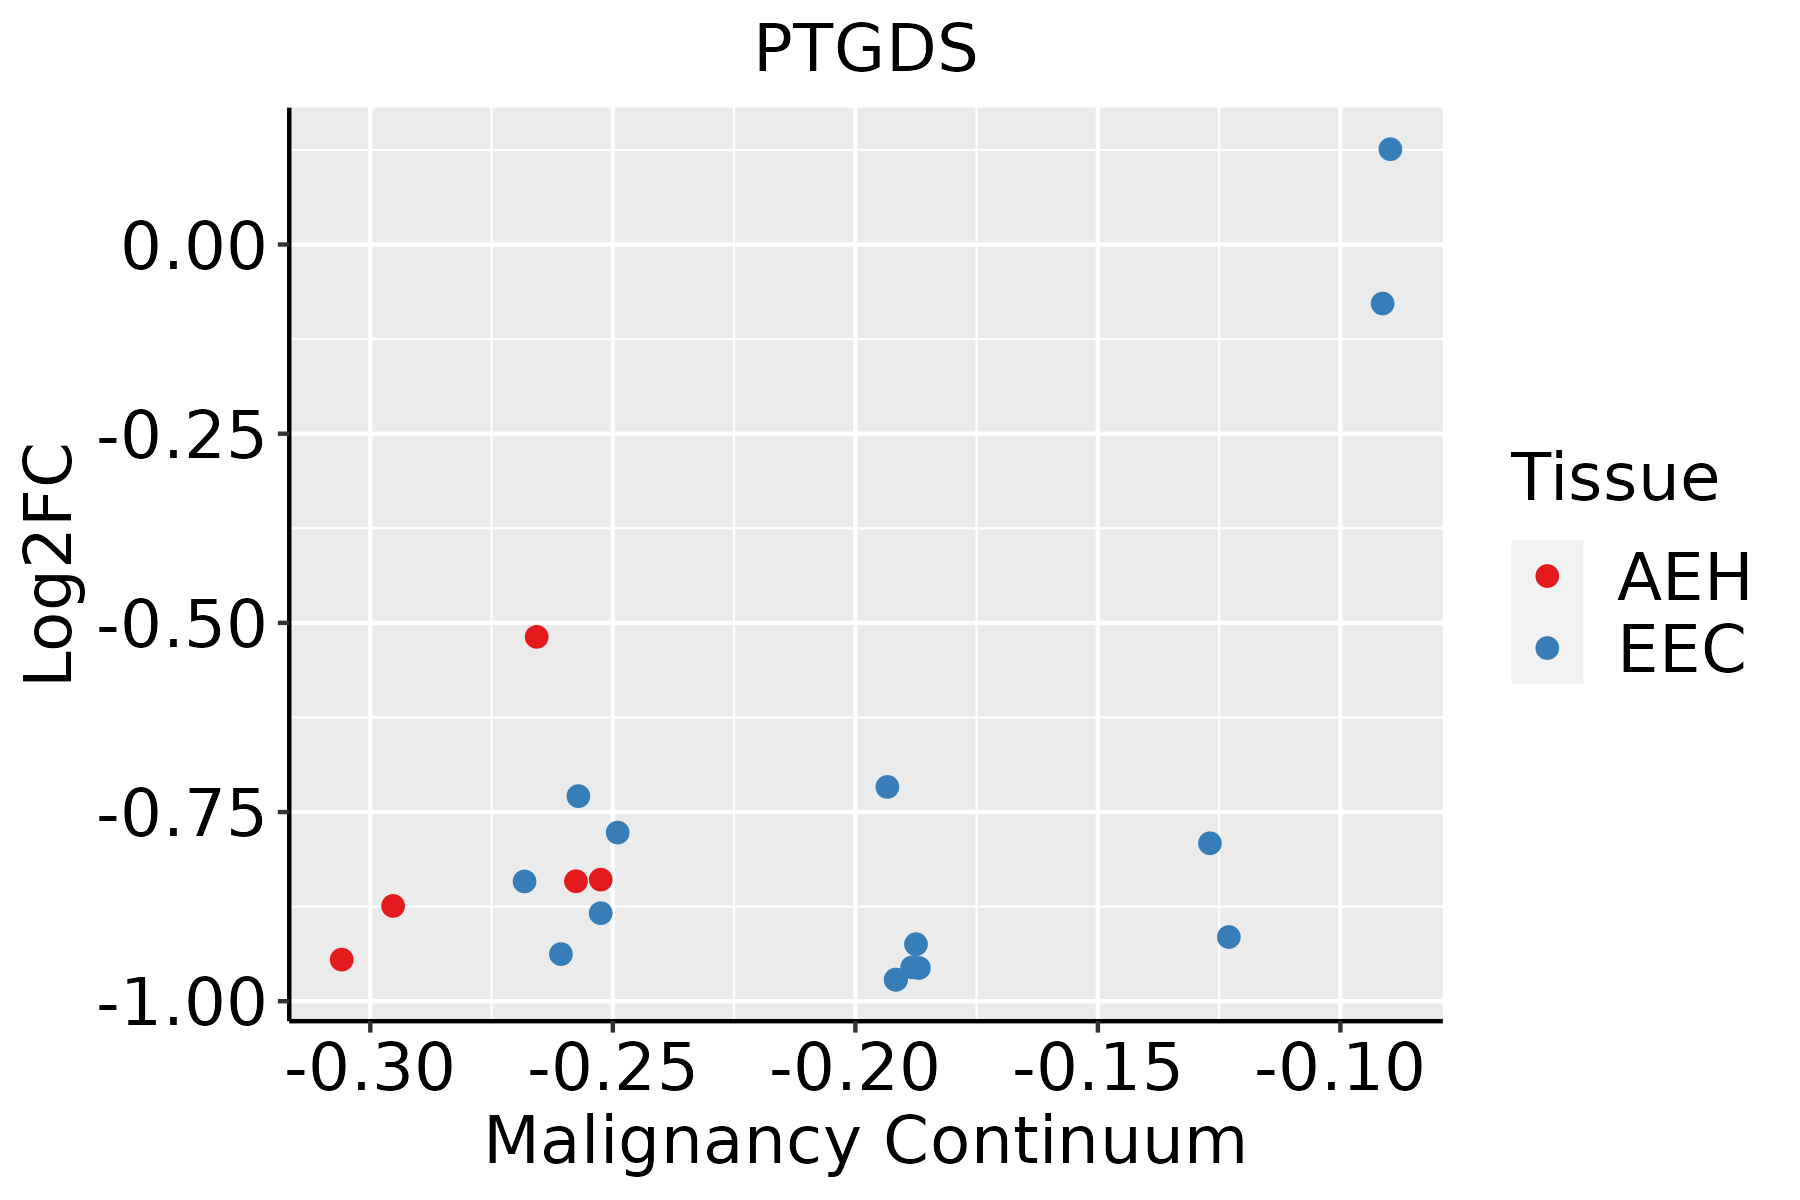 | AEH: Atypical endometrial hyperplasia |
| EEC: Endometrioid Cancer | ||
| Esophagus | 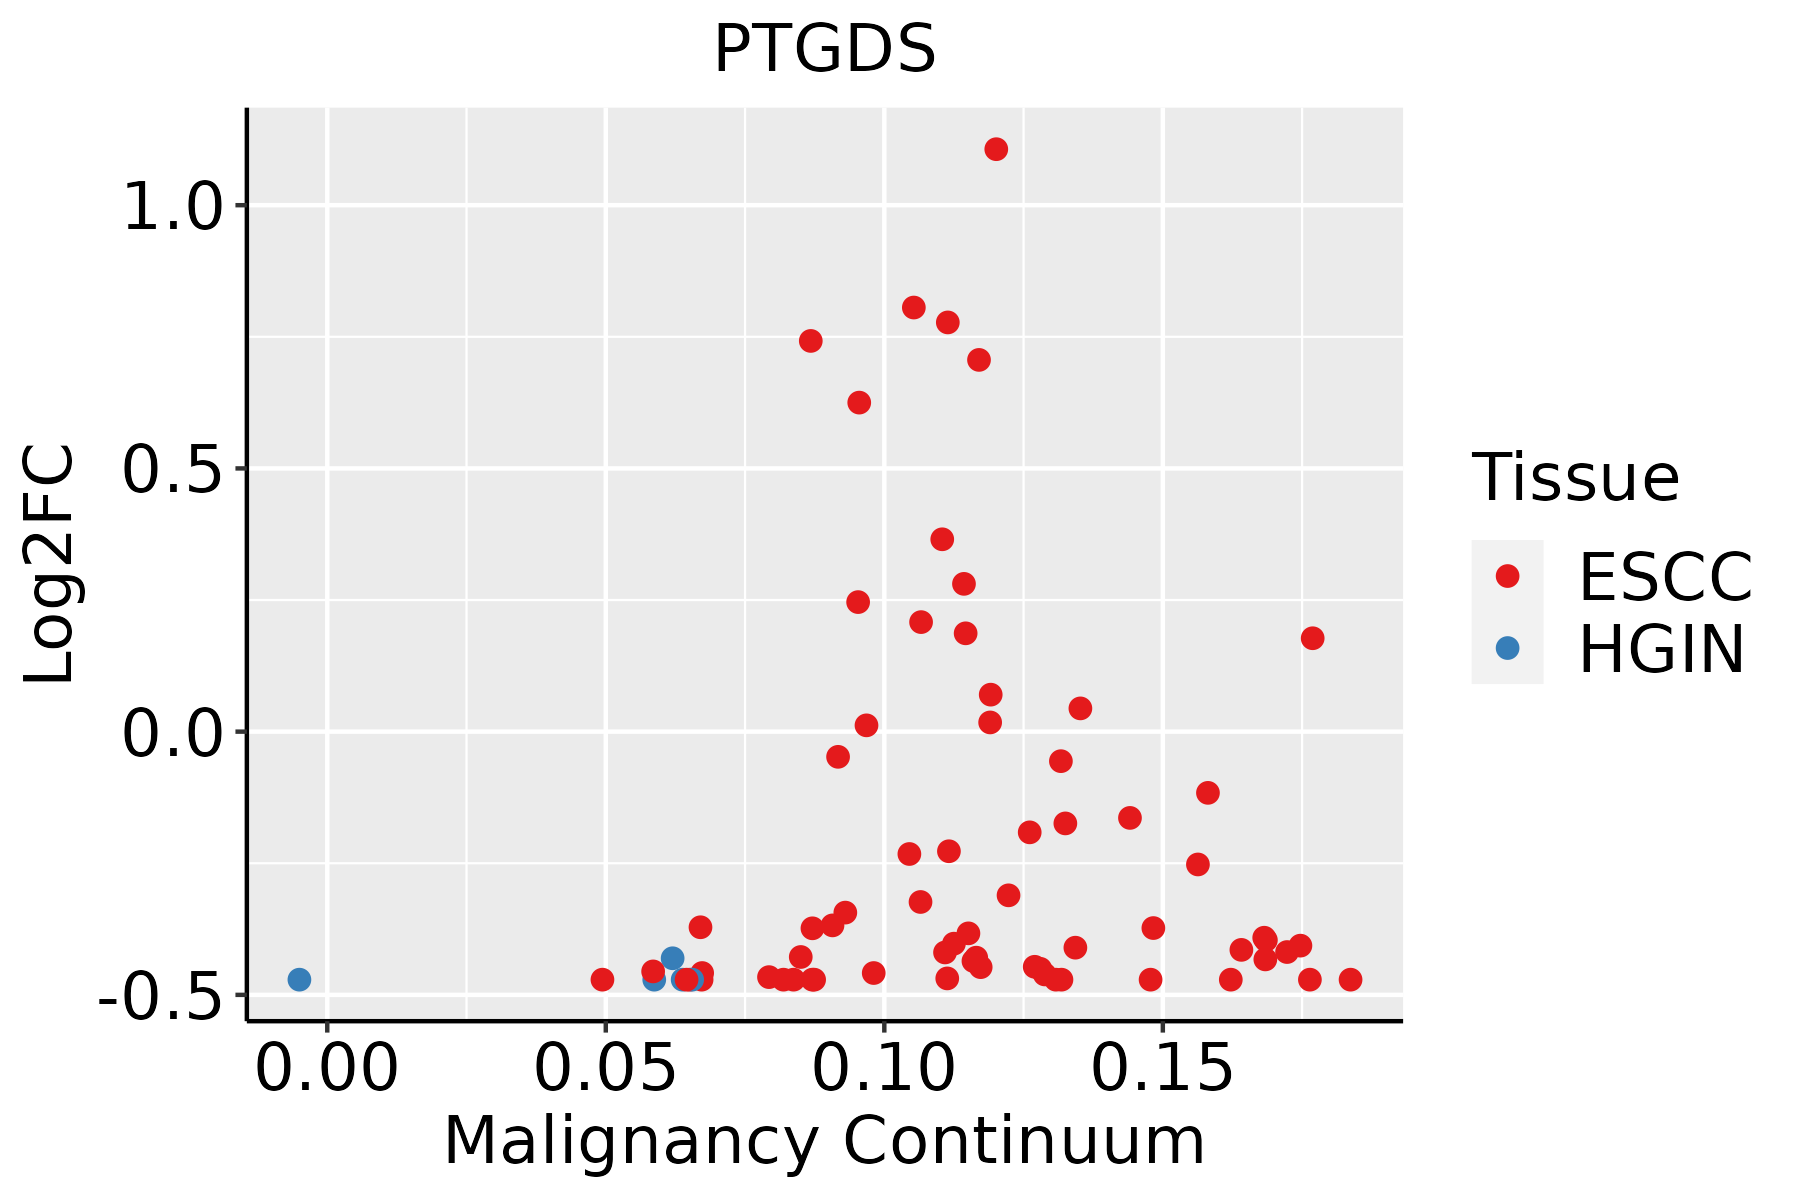 | ESCC: Esophageal squamous cell carcinoma |
| HGIN: High-grade intraepithelial neoplasias | ||
| LGIN: Low-grade intraepithelial neoplasias | ||
| Liver | 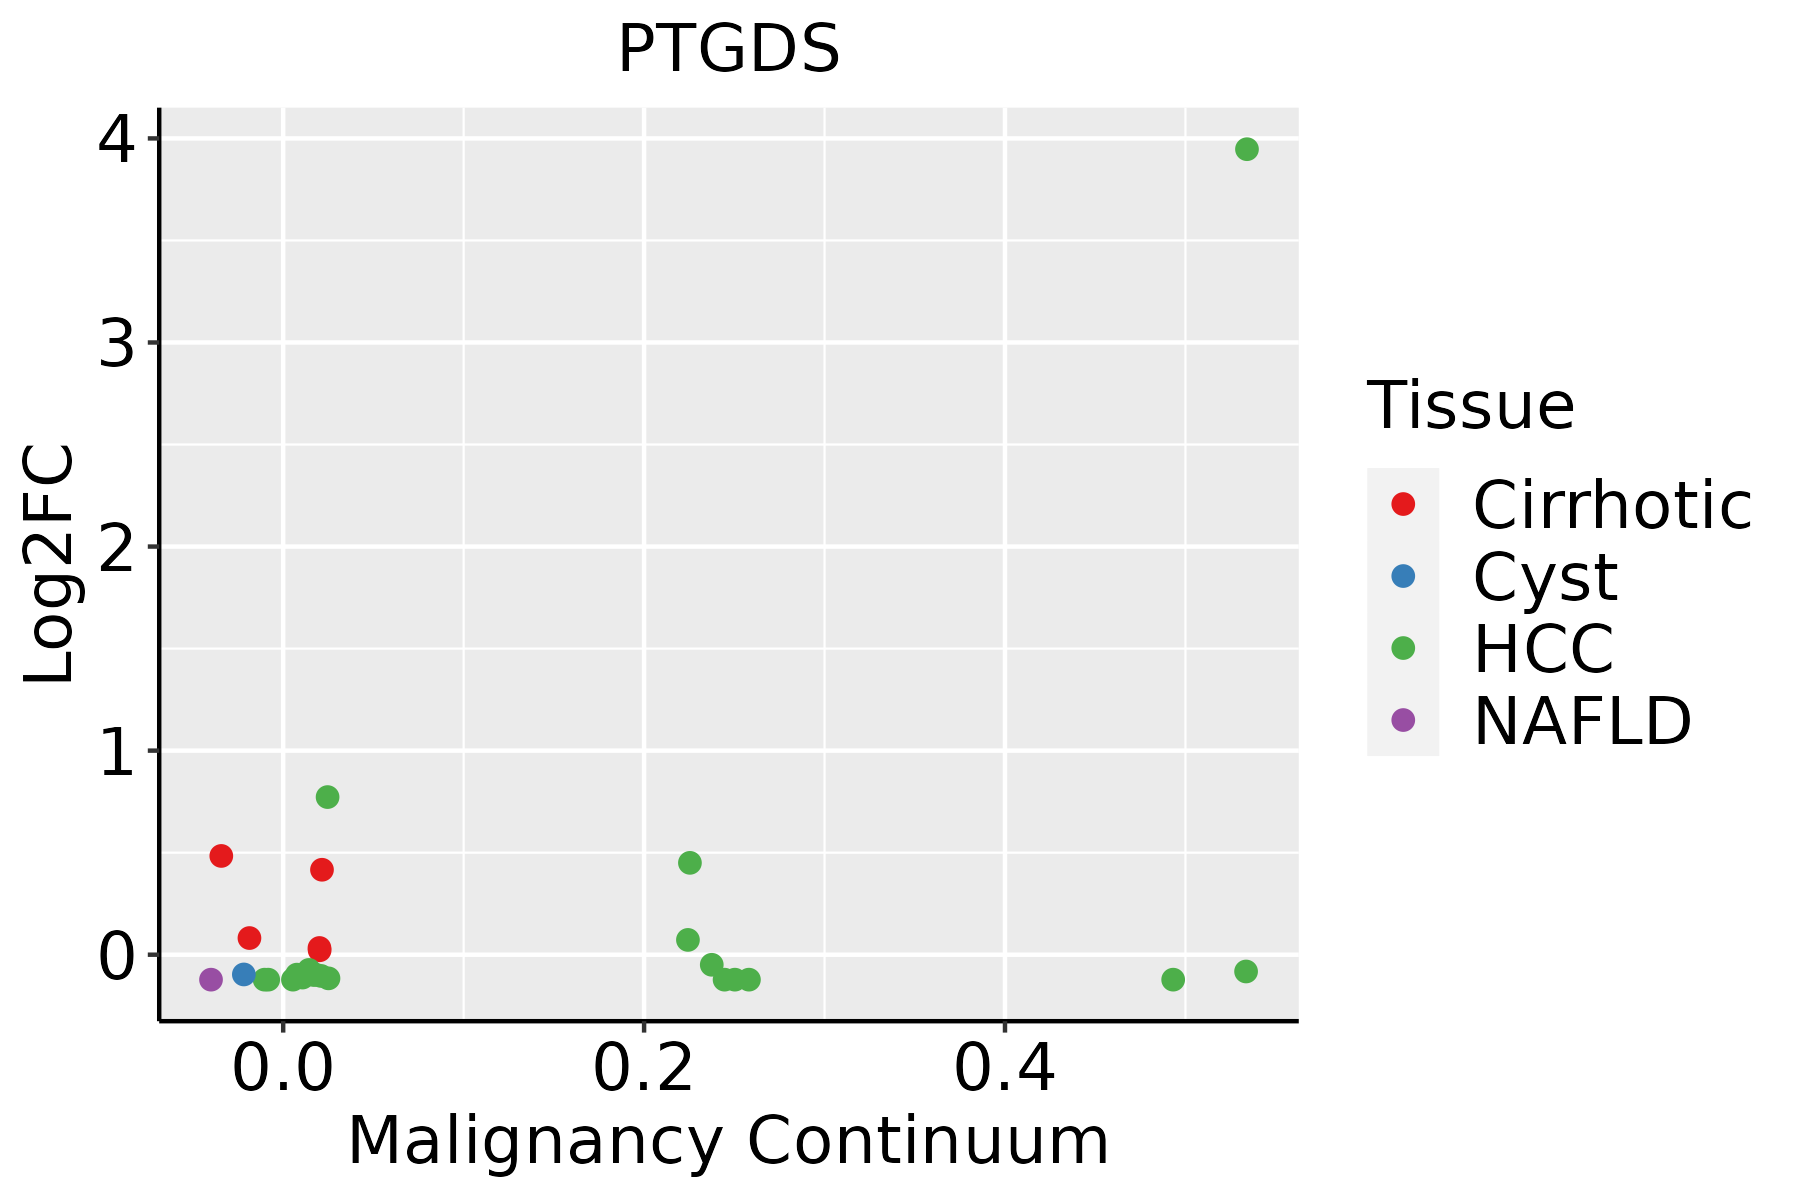 | HCC: Hepatocellular carcinoma |
| NAFLD: Non-alcoholic fatty liver disease | ||
| Oral Cavity | 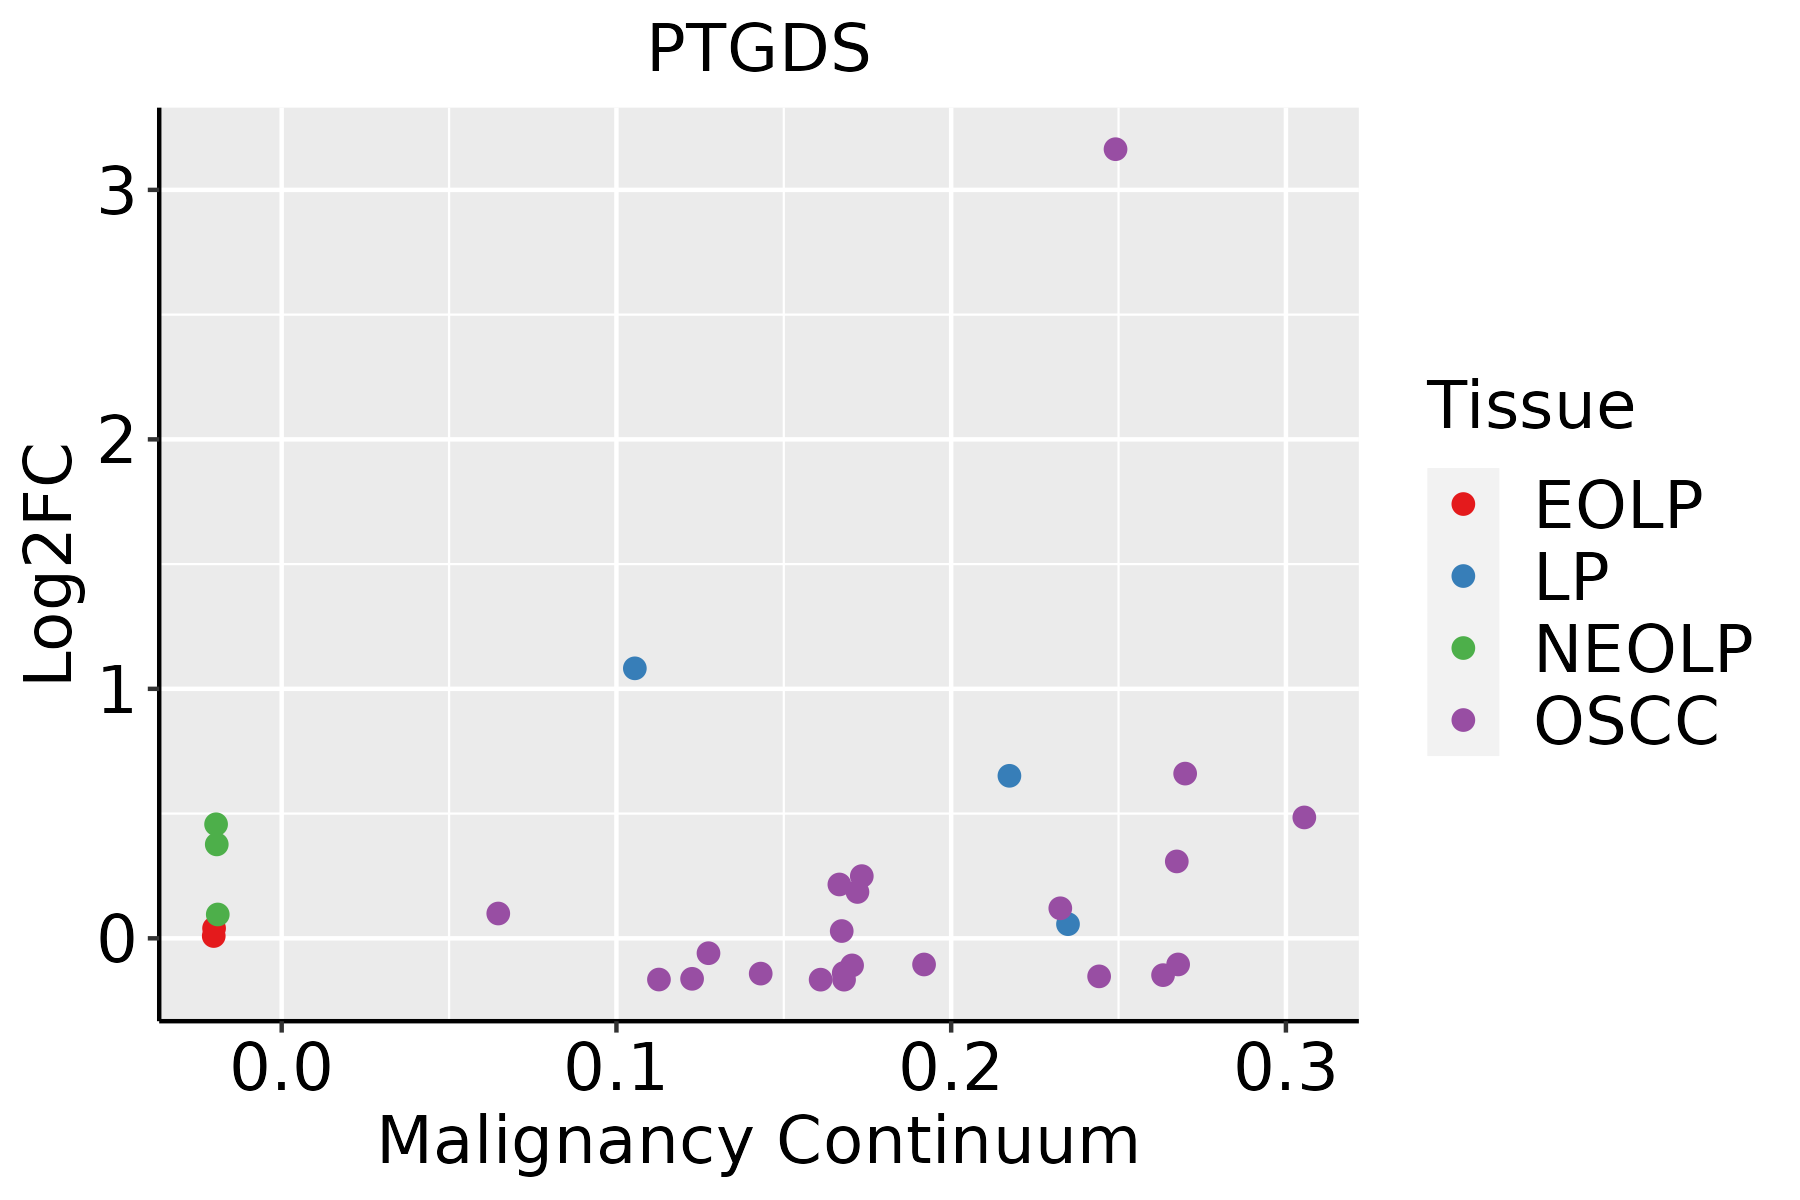 | EOLP: Erosive Oral lichen planus |
| LP: leukoplakia | ||
| NEOLP: Non-erosive oral lichen planus | ||
| OSCC: Oral squamous cell carcinoma | ||
| Prostate | 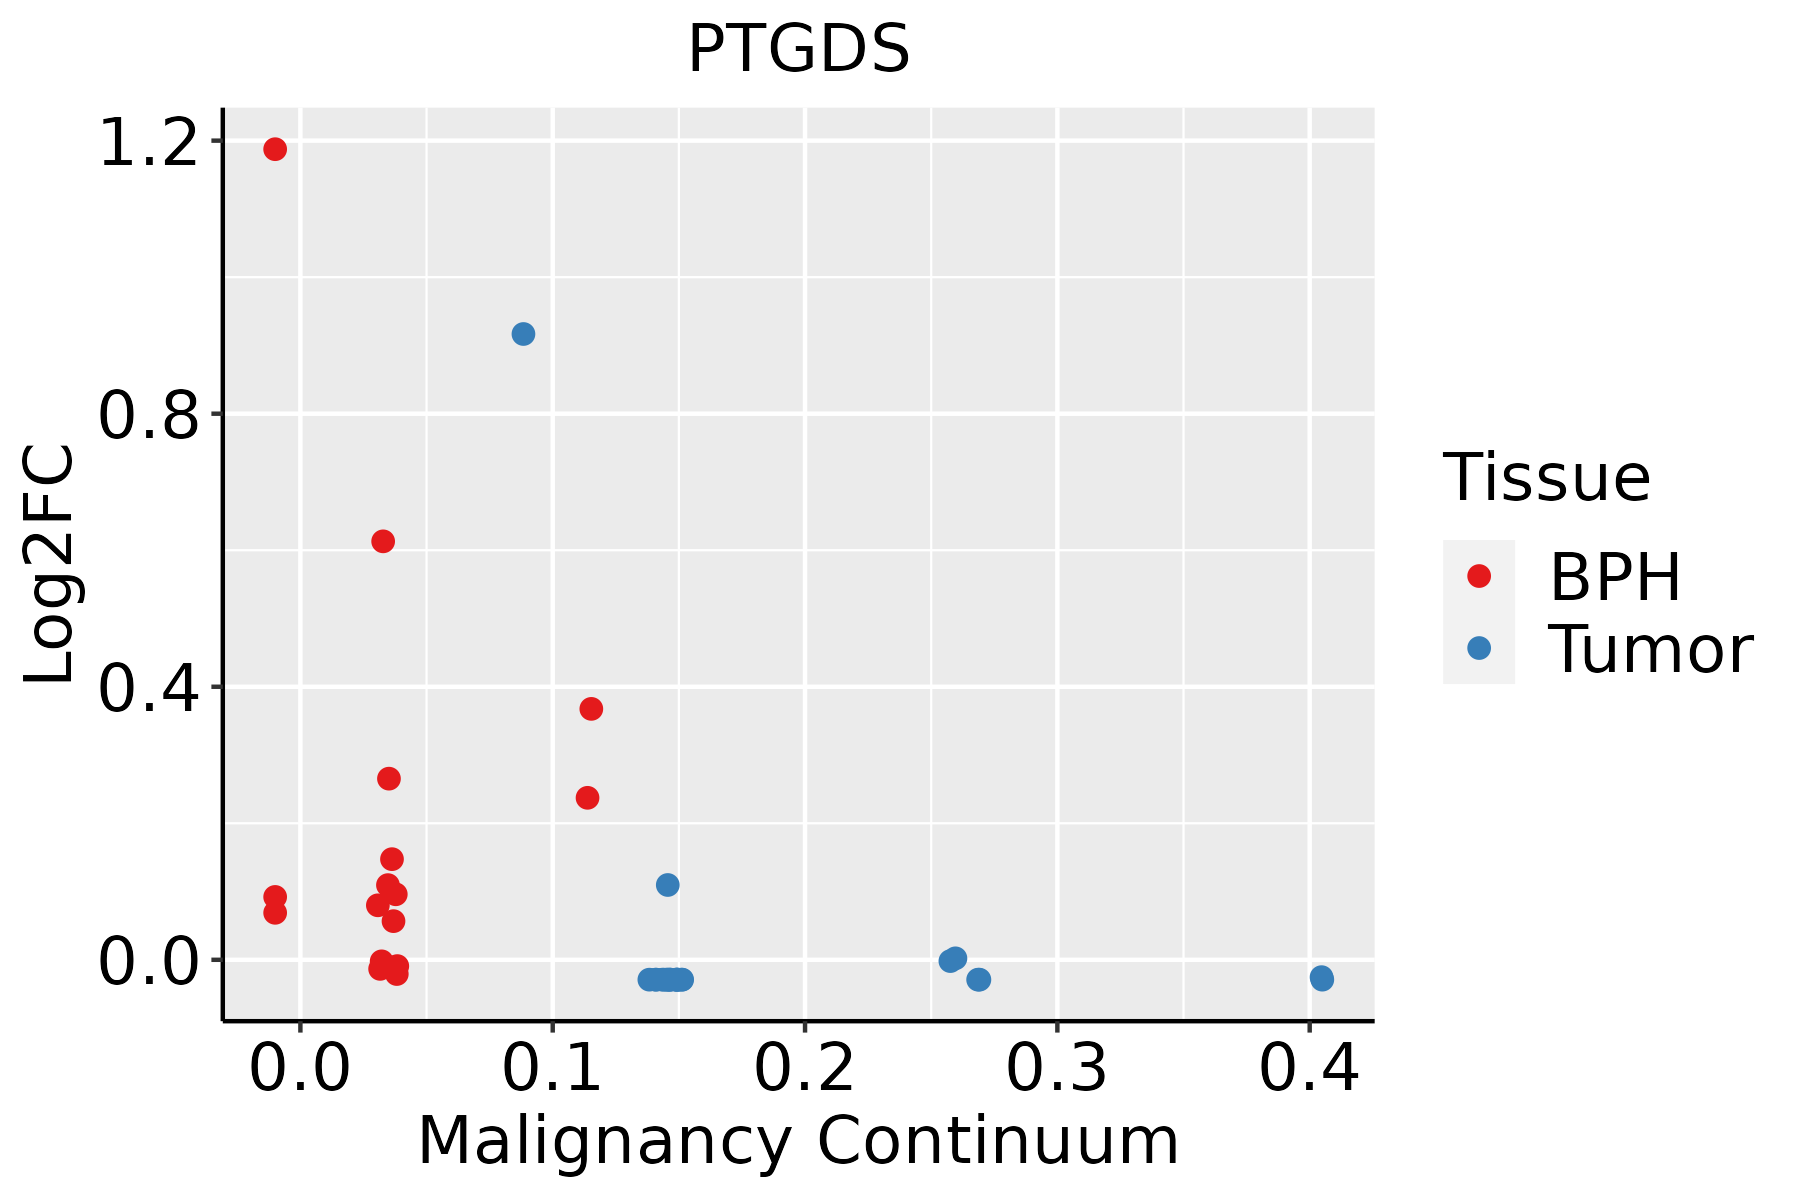 | BPH: Benign Prostatic Hyperplasia |
| Skin | 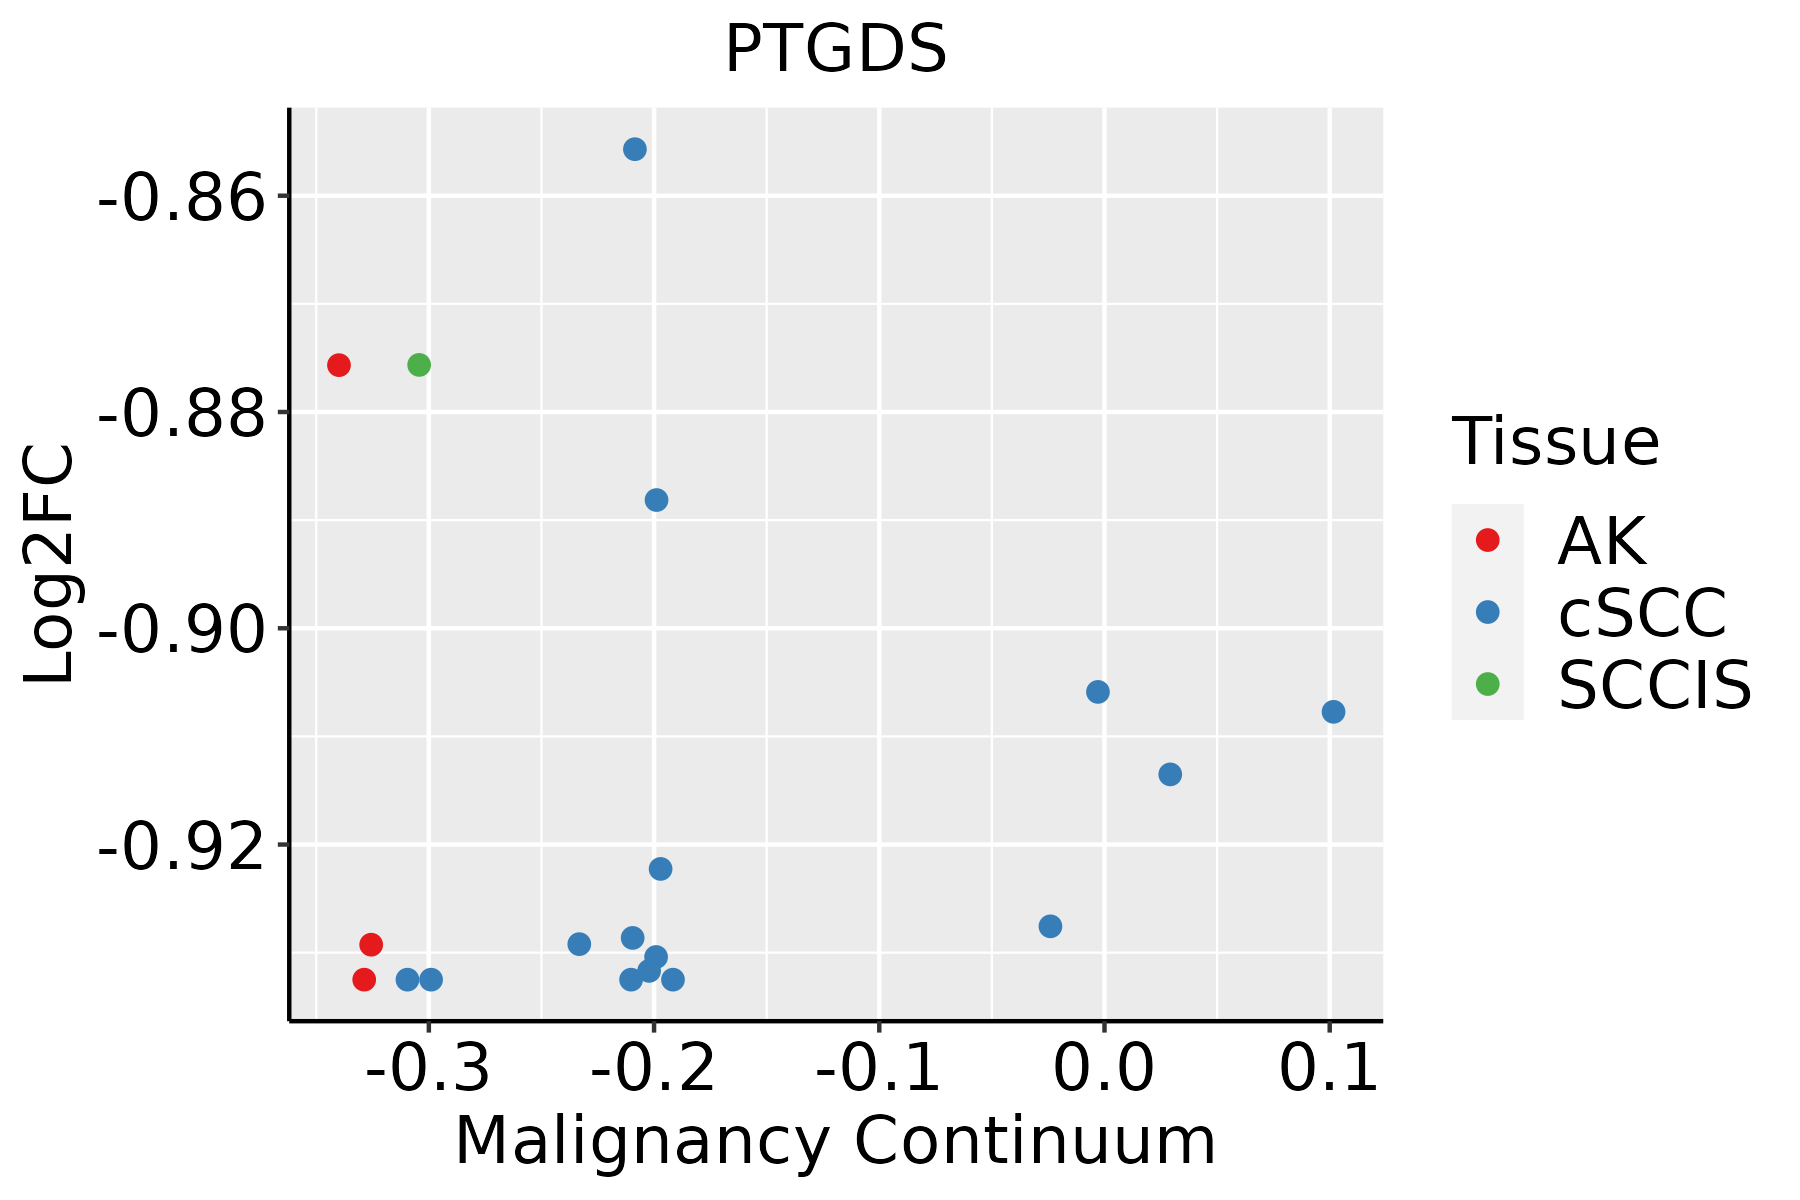 | AK: Actinic keratosis |
| cSCC: Cutaneous squamous cell carcinoma | ||
| SCCIS:squamous cell carcinoma in situ |
| ∗log2FC in expression of this searched gene in stem-like cells from each diseased tissue sample relative to stem-like cells in normal samples in each tissue plotted against the malignancy continuum. Samples are colored based on if they are from different disease stage. |
Top |
Malignant transformation related pathway analysis |
| Find out the enriched GO biological processes and KEGG pathways involved in transition from healthy to precancer to cancer |
| Tissue | Disease Stage | Enriched GO biological Processes |
| Colorectum | AD |  |
| Colorectum | SER |  |
| Colorectum | MSS |  |
| Colorectum | MSI-H |  |
| Colorectum | FAP |  |
| ∗Top 15 enriched GO BP terms are showed in the bar plot of each disease state in each tissue. Each row represents a significant GO biological process which is colored according to the -log10(p.adjust). |
| Page: 1 2 3 4 5 6 7 8 9 |
| GO ID | Tissue | Disease Stage | Description | Gene Ratio | Bg Ratio | pvalue | p.adjust | Count |
| GO:00024431 | Cervix | HSIL_HPV | leukocyte mediated immunity | 41/737 | 440/18723 | 3.14e-07 | 1.76e-05 | 41 |
| GO:00022631 | Cervix | HSIL_HPV | cell activation involved in immune response | 28/737 | 279/18723 | 5.84e-06 | 2.13e-04 | 28 |
| GO:000227411 | Cervix | HSIL_HPV | myeloid leukocyte activation | 23/737 | 223/18723 | 2.53e-05 | 7.53e-04 | 23 |
| GO:0002366 | Cervix | HSIL_HPV | leukocyte activation involved in immune response | 26/737 | 275/18723 | 3.52e-05 | 9.72e-04 | 26 |
| GO:004645611 | Cervix | HSIL_HPV | icosanoid biosynthetic process | 10/737 | 56/18723 | 5.80e-05 | 1.40e-03 | 10 |
| GO:000151611 | Cervix | HSIL_HPV | prostaglandin biosynthetic process | 7/737 | 31/18723 | 1.64e-04 | 3.14e-03 | 7 |
| GO:004645711 | Cervix | HSIL_HPV | prostanoid biosynthetic process | 7/737 | 31/18723 | 1.64e-04 | 3.14e-03 | 7 |
| GO:00066927 | Cervix | HSIL_HPV | prostanoid metabolic process | 8/737 | 49/18723 | 5.99e-04 | 8.37e-03 | 8 |
| GO:00066937 | Cervix | HSIL_HPV | prostaglandin metabolic process | 8/737 | 49/18723 | 5.99e-04 | 8.37e-03 | 8 |
| GO:00066907 | Cervix | HSIL_HPV | icosanoid metabolic process | 12/737 | 123/18723 | 3.36e-03 | 3.04e-02 | 12 |
| GO:00066362 | Cervix | HSIL_HPV | unsaturated fatty acid biosynthetic process | 7/737 | 51/18723 | 3.65e-03 | 3.25e-02 | 7 |
| GO:00024432 | Cervix | N_HPV | leukocyte mediated immunity | 39/534 | 440/18723 | 3.94e-10 | 2.24e-07 | 39 |
| GO:000227421 | Cervix | N_HPV | myeloid leukocyte activation | 21/534 | 223/18723 | 1.78e-06 | 9.21e-05 | 21 |
| GO:00022632 | Cervix | N_HPV | cell activation involved in immune response | 20/534 | 279/18723 | 1.59e-04 | 2.82e-03 | 20 |
| GO:00023661 | Cervix | N_HPV | leukocyte activation involved in immune response | 19/534 | 275/18723 | 3.66e-04 | 5.35e-03 | 19 |
| GO:004645621 | Cervix | N_HPV | icosanoid biosynthetic process | 7/534 | 56/18723 | 1.02e-03 | 1.20e-02 | 7 |
| GO:0043299 | Cervix | N_HPV | leukocyte degranulation | 7/534 | 73/18723 | 4.74e-03 | 3.51e-02 | 7 |
| GO:0002444 | Cervix | N_HPV | myeloid leukocyte mediated immunity | 8/534 | 99/18723 | 7.37e-03 | 4.80e-02 | 8 |
| GO:00485119 | Endometrium | AEH | rhythmic process | 67/2100 | 298/18723 | 1.69e-08 | 1.04e-06 | 67 |
| GO:00516568 | Endometrium | AEH | establishment of organelle localization | 77/2100 | 390/18723 | 4.89e-07 | 1.94e-05 | 77 |
| Page: 1 2 3 4 5 |
| Pathway ID | Tissue | Disease Stage | Description | Gene Ratio | Bg Ratio | pvalue | p.adjust | qvalue | Count |
| Page: 1 |
Top |
Cell-cell communication analysis |
| Identification of potential cell-cell interactions between two cell types and their ligand-receptor pairs for different disease states |
| Ligand | Receptor | LRpair | Pathway | Tissue | Disease Stage |
| Page: 1 |
Top |
Single-cell gene regulatory network inference analysis |
| Find out the significant the regulons (TFs) and the target genes of each regulon across cell types for different disease states |
| TF | Cell Type | Tissue | Disease Stage | Target Gene | RSS | Regulon Activity |
| ∗The dot plots of a searched regulon are shown for all cell subpopulations in each disease state of each tissue based on the regulon specific score inferred using pySCENIC and by calculating the average expression. |
| Page: 1 |
Top |
Somatic mutation of malignant transformation related genes |
| Annotation of somatic variants for genes involved in malignant transformation |
| Hugo Symbol | Variant Class | Variant Classification | dbSNP RS | HGVSc | HGVSp | HGVSp Short | SWISSPROT | BIOTYPE | SIFT | PolyPhen | Tumor Sample Barcode | Tissue | Histology | Sex | Age | Stage | Therapy Types | Drugs | Outcome |
| PTGDS | SNV | Missense_Mutation | rs192576424 | c.268G>A | p.Glu90Lys | p.E90K | P41222 | protein_coding | tolerated(0.11) | probably_damaging(0.972) | TCGA-BH-A0DZ-01 | Breast | breast invasive carcinoma | Female | <65 | I/II | Chemotherapy | docetaxel | SD |
| PTGDS | SNV | Missense_Mutation | rs761916489 | c.421N>A | p.Glu141Lys | p.E141K | P41222 | protein_coding | tolerated(0.32) | benign(0.18) | TCGA-BH-A18G-01 | Breast | breast invasive carcinoma | Female | >=65 | I/II | Unknown | Unknown | SD |
| PTGDS | SNV | Missense_Mutation | novel | c.454N>T | p.Thr152Ser | p.T152S | P41222 | protein_coding | tolerated(0.16) | benign(0.007) | TCGA-E2-A576-01 | Breast | breast invasive carcinoma | Female | >=65 | I/II | Chemotherapy | taxotere | SD |
| PTGDS | SNV | Missense_Mutation | novel | c.34N>C | p.Ala12Pro | p.A12P | P41222 | protein_coding | deleterious(0.03) | benign(0.085) | TCGA-2W-A8YY-01 | Cervix | cervical & endocervical cancer | Female | <65 | I/II | Chemotherapy | cisplatin | CR |
| PTGDS | SNV | Missense_Mutation | c.63N>T | p.Gln21His | p.Q21H | P41222 | protein_coding | tolerated(0.11) | benign(0.045) | TCGA-AA-3663-01 | Colorectum | colon adenocarcinoma | Male | <65 | I/II | Unknown | Unknown | SD | |
| PTGDS | SNV | Missense_Mutation | c.388N>A | p.Leu130Met | p.L130M | P41222 | protein_coding | deleterious(0.02) | probably_damaging(0.978) | TCGA-AZ-6601-01 | Colorectum | colon adenocarcinoma | Male | >=65 | I/II | Unknown | Unknown | PD | |
| PTGDS | SNV | Missense_Mutation | c.26N>C | p.Met9Thr | p.M9T | P41222 | protein_coding | tolerated(0.18) | benign(0.005) | TCGA-D5-6530-01 | Colorectum | colon adenocarcinoma | Male | <65 | I/II | Unknown | Unknown | SD | |
| PTGDS | SNV | Missense_Mutation | novel | c.500N>A | p.Cys167Tyr | p.C167Y | P41222 | protein_coding | tolerated(0.14) | possibly_damaging(0.793) | TCGA-AG-3726-01 | Colorectum | rectum adenocarcinoma | Female | <65 | I/II | Unknown | Unknown | SD |
| PTGDS | SNV | Missense_Mutation | novel | c.506N>T | p.Ala169Val | p.A169V | P41222 | protein_coding | tolerated(0.08) | benign(0.208) | TCGA-A5-A0G1-01 | Endometrium | uterine corpus endometrioid carcinoma | Female | >=65 | I/II | Unknown | Unknown | SD |
| PTGDS | SNV | Missense_Mutation | novel | c.55N>A | p.Asp19Asn | p.D19N | P41222 | protein_coding | tolerated(0.5) | benign(0.006) | TCGA-AJ-A3BH-01 | Endometrium | uterine corpus endometrioid carcinoma | Female | Unknown | I/II | Unknown | Unknown | SD |
| Page: 1 2 3 |
Top |
Related drugs of malignant transformation related genes |
| Identification of chemicals and drugs interact with genes involved in malignant transfromation |
| (DGIdb 4.0) |
| Entrez ID | Symbol | Category | Interaction Types | Drug Claim Name | Drug Name | PMIDs |
| 5730 | PTGDS | ENZYME, TRANSPORTER, DRUGGABLE GENOME | HORMONES | 10387044 | ||
| 5730 | PTGDS | ENZYME, TRANSPORTER, DRUGGABLE GENOME | inhibitor | 381744942 |
| Page: 1 |

Copyright 2023-Present -The University of Texas Health Science Center at Houston |