
|
|||||
|
 | |
| |
| |
| |
| |
| |
|
Gene: PTGDR |
Gene summary for PTGDR |
| Gene information | Species | Human | Gene symbol | PTGDR | Gene ID | 5729 |
| Gene name | prostaglandin D2 receptor | |
| Gene Alias | AS1 | |
| Cytomap | 14q22.1 | |
| Gene Type | protein-coding | GO ID | GO:0001775 | UniProtAcc | Q13258 |
Top |
Malignant transformation analysis |
| Identification of the aberrant gene expression in precancerous and cancerous lesions by comparing the gene expression of stem-like cells in diseased tissues with normal stem cells |
| Entrez ID | Symbol | Replicates | Species | Organ | Tissue | Adj P-value | Log2FC | Malignancy |
| 5729 | PTGDR | HTA11_3410_2000001011 | Human | Colorectum | AD | 4.06e-11 | -5.44e-01 | 0.0155 |
| 5729 | PTGDR | HTA11_2487_2000001011 | Human | Colorectum | SER | 1.15e-07 | -6.51e-01 | -0.1808 |
| 5729 | PTGDR | HTA11_1938_2000001011 | Human | Colorectum | AD | 6.41e-06 | -6.57e-01 | -0.0811 |
| 5729 | PTGDR | HTA11_78_2000001011 | Human | Colorectum | AD | 8.31e-08 | -6.20e-01 | -0.1088 |
| 5729 | PTGDR | HTA11_3361_2000001011 | Human | Colorectum | AD | 1.62e-07 | -6.85e-01 | -0.1207 |
| 5729 | PTGDR | HTA11_83_2000001011 | Human | Colorectum | SER | 1.05e-02 | -5.64e-01 | -0.1526 |
| 5729 | PTGDR | HTA11_696_2000001011 | Human | Colorectum | AD | 1.14e-24 | -6.81e-01 | -0.1464 |
| 5729 | PTGDR | HTA11_866_2000001011 | Human | Colorectum | AD | 7.12e-10 | -4.87e-01 | -0.1001 |
| 5729 | PTGDR | HTA11_1391_2000001011 | Human | Colorectum | AD | 2.19e-19 | -7.60e-01 | -0.059 |
| 5729 | PTGDR | HTA11_5212_2000001011 | Human | Colorectum | AD | 1.64e-04 | -7.70e-01 | -0.2061 |
| 5729 | PTGDR | HTA11_866_3004761011 | Human | Colorectum | AD | 2.46e-04 | -5.07e-01 | 0.096 |
| 5729 | PTGDR | HTA11_7696_3000711011 | Human | Colorectum | AD | 1.05e-12 | -5.34e-01 | 0.0674 |
| 5729 | PTGDR | HTA11_99999970781_79442 | Human | Colorectum | MSS | 5.41e-07 | -2.86e-01 | 0.294 |
| 5729 | PTGDR | HTA11_99999971662_82457 | Human | Colorectum | MSS | 2.30e-41 | -7.95e-01 | 0.3859 |
| 5729 | PTGDR | HTA11_99999973899_84307 | Human | Colorectum | MSS | 1.79e-11 | -7.95e-01 | 0.2585 |
| 5729 | PTGDR | HTA11_99999974143_84620 | Human | Colorectum | MSS | 4.12e-43 | -7.95e-01 | 0.3005 |
| 5729 | PTGDR | F007 | Human | Colorectum | FAP | 9.11e-09 | -6.22e-01 | 0.1176 |
| 5729 | PTGDR | A001-C-207 | Human | Colorectum | FAP | 1.12e-09 | -5.40e-01 | 0.1278 |
| 5729 | PTGDR | A015-C-203 | Human | Colorectum | FAP | 3.54e-24 | -5.09e-01 | -0.1294 |
| 5729 | PTGDR | A015-C-204 | Human | Colorectum | FAP | 1.24e-04 | -3.99e-01 | -0.0228 |
| Page: 1 2 3 |
| Tissue | Expression Dynamics | Abbreviation |
| Colorectum (GSE201348) |  | FAP: Familial adenomatous polyposis |
| CRC: Colorectal cancer | ||
| Colorectum (HTA11) | 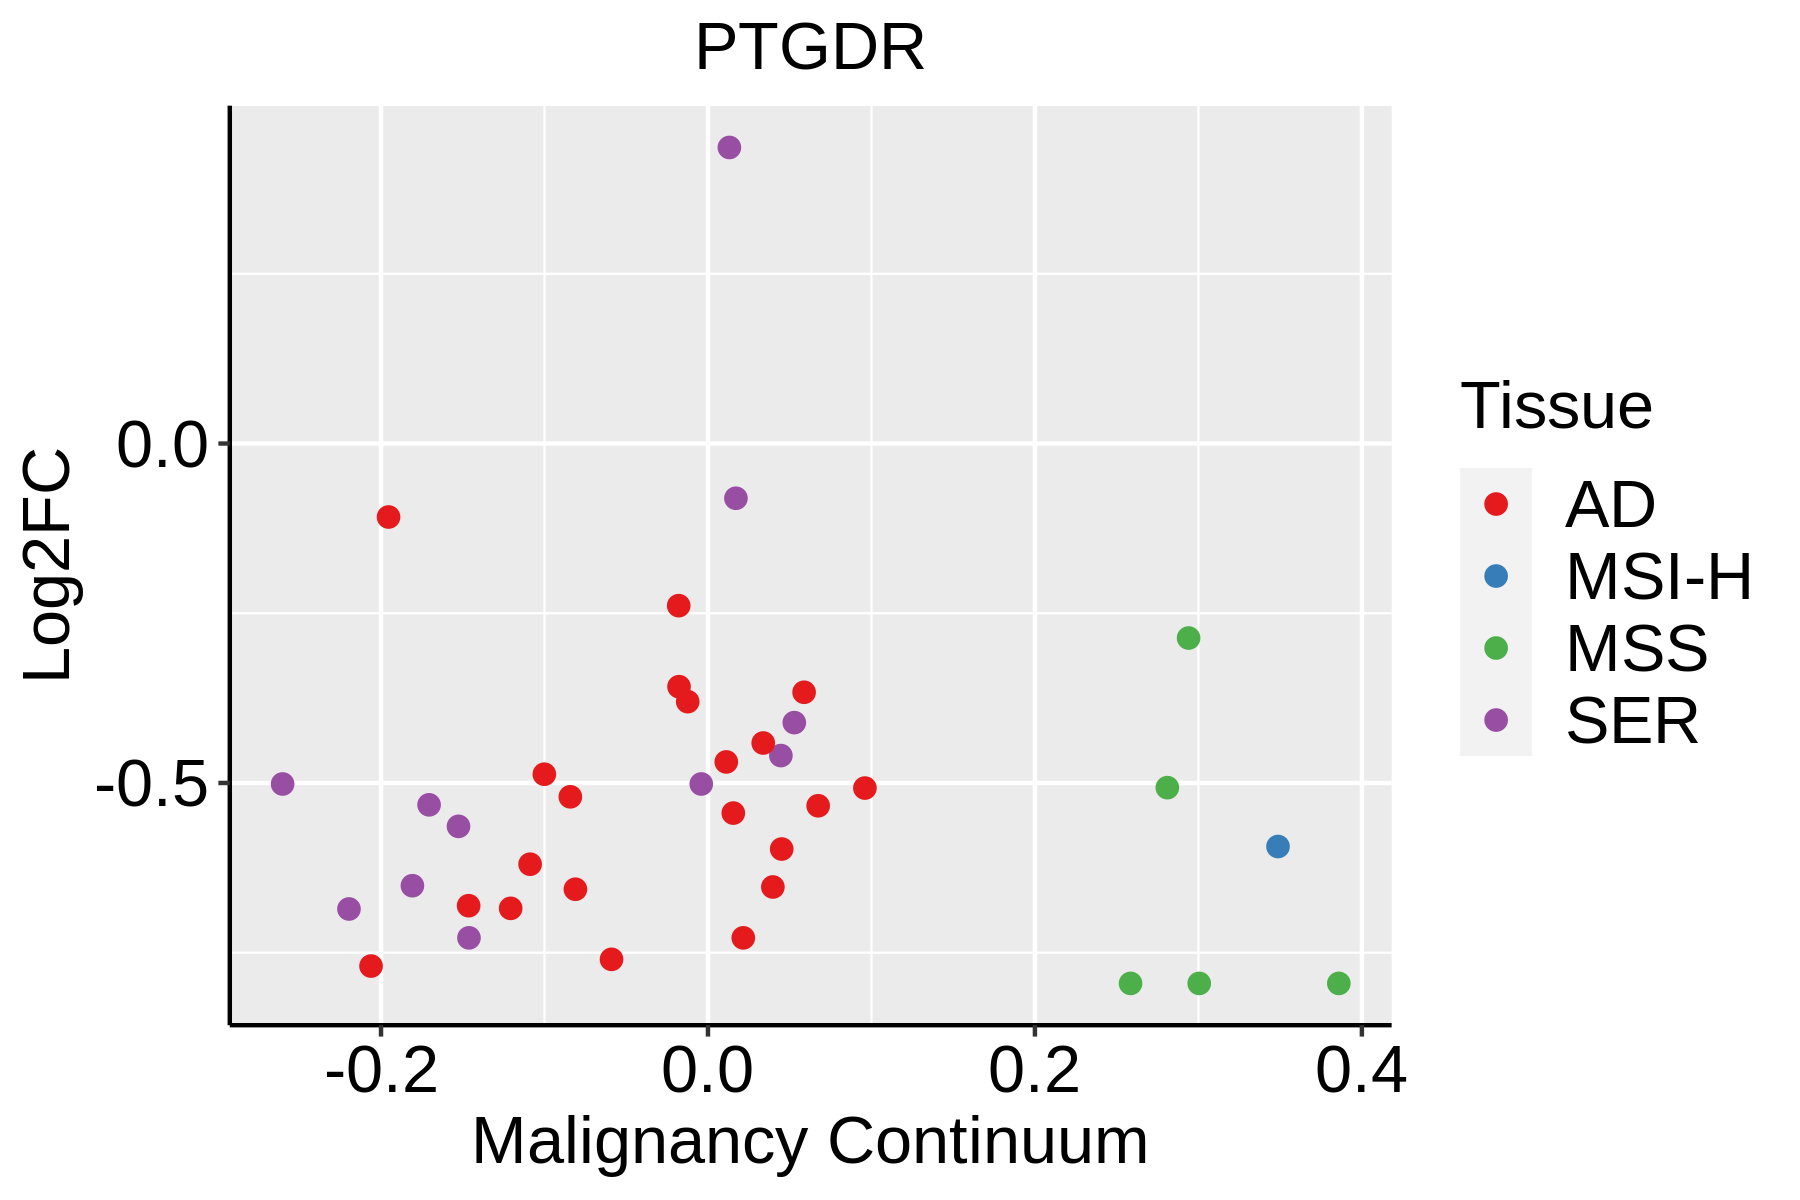 | AD: Adenomas |
| SER: Sessile serrated lesions | ||
| MSI-H: Microsatellite-high colorectal cancer | ||
| MSS: Microsatellite stable colorectal cancer |
| ∗log2FC in expression of this searched gene in stem-like cells from each diseased tissue sample relative to stem-like cells in normal samples in each tissue plotted against the malignancy continuum. Samples are colored based on if they are from different disease stage. |
Top |
Malignant transformation related pathway analysis |
| Find out the enriched GO biological processes and KEGG pathways involved in transition from healthy to precancer to cancer |
| Tissue | Disease Stage | Enriched GO biological Processes |
| Colorectum | AD |  |
| Colorectum | SER |  |
| Colorectum | MSS |  |
| Colorectum | MSI-H |  |
| Colorectum | FAP |  |
| ∗Top 15 enriched GO BP terms are showed in the bar plot of each disease state in each tissue. Each row represents a significant GO biological process which is colored according to the -log10(p.adjust). |
| Page: 1 2 3 4 5 6 7 8 9 |
| GO ID | Tissue | Disease Stage | Description | Gene Ratio | Bg Ratio | pvalue | p.adjust | Count |
| GO:0051656 | Colorectum | AD | establishment of organelle localization | 131/3918 | 390/18723 | 3.00e-09 | 2.06e-07 | 131 |
| GO:0006887 | Colorectum | AD | exocytosis | 96/3918 | 352/18723 | 2.48e-03 | 1.90e-02 | 96 |
| GO:00516561 | Colorectum | SER | establishment of organelle localization | 100/2897 | 390/18723 | 1.11e-07 | 6.79e-06 | 100 |
| GO:00068871 | Colorectum | SER | exocytosis | 75/2897 | 352/18723 | 2.05e-03 | 2.03e-02 | 75 |
| GO:00516562 | Colorectum | MSS | establishment of organelle localization | 115/3467 | 390/18723 | 7.30e-08 | 3.67e-06 | 115 |
| GO:00516563 | Colorectum | FAP | establishment of organelle localization | 97/2622 | 390/18723 | 5.91e-09 | 9.48e-07 | 97 |
| GO:00516564 | Colorectum | CRC | establishment of organelle localization | 76/2078 | 390/18723 | 6.53e-07 | 4.50e-05 | 76 |
| GO:00068872 | Colorectum | CRC | exocytosis | 55/2078 | 352/18723 | 5.62e-03 | 4.24e-02 | 55 |
| Page: 1 |
| Pathway ID | Tissue | Disease Stage | Description | Gene Ratio | Bg Ratio | pvalue | p.adjust | qvalue | Count |
| Page: 1 |
Top |
Cell-cell communication analysis |
| Identification of potential cell-cell interactions between two cell types and their ligand-receptor pairs for different disease states |
| Ligand | Receptor | LRpair | Pathway | Tissue | Disease Stage |
| Page: 1 |
Top |
Single-cell gene regulatory network inference analysis |
| Find out the significant the regulons (TFs) and the target genes of each regulon across cell types for different disease states |
| TF | Cell Type | Tissue | Disease Stage | Target Gene | RSS | Regulon Activity |
| ∗The dot plots of a searched regulon are shown for all cell subpopulations in each disease state of each tissue based on the regulon specific score inferred using pySCENIC and by calculating the average expression. |
| Page: 1 |
Top |
Somatic mutation of malignant transformation related genes |
| Annotation of somatic variants for genes involved in malignant transformation |
| Hugo Symbol | Variant Class | Variant Classification | dbSNP RS | HGVSc | HGVSp | HGVSp Short | SWISSPROT | BIOTYPE | SIFT | PolyPhen | Tumor Sample Barcode | Tissue | Histology | Sex | Age | Stage | Therapy Types | Drugs | Outcome |
| PTGDR | SNV | Missense_Mutation | rs770154151 | c.994N>T | p.Arg332Trp | p.R332W | Q13258 | protein_coding | deleterious(0) | probably_damaging(0.997) | TCGA-AN-A046-01 | Breast | breast invasive carcinoma | Female | >=65 | I/II | Unknown | Unknown | SD |
| PTGDR | SNV | Missense_Mutation | c.532T>G | p.Cys178Gly | p.C178G | Q13258 | protein_coding | deleterious(0) | probably_damaging(0.998) | TCGA-AN-A0XN-01 | Breast | breast invasive carcinoma | Female | >=65 | III/IV | Unknown | Unknown | SD | |
| PTGDR | SNV | Missense_Mutation | rs201541398 | c.853N>A | p.Ala285Thr | p.A285T | Q13258 | protein_coding | deleterious(0.01) | probably_damaging(0.953) | TCGA-PL-A8LZ-01 | Breast | breast invasive carcinoma | Female | <65 | III/IV | Chemotherapy | paclitaxel | SD |
| PTGDR | insertion | In_Frame_Ins | novel | c.412_413insTGG | p.Phe138delinsLeuVal | p.F138delinsLV | Q13258 | protein_coding | TCGA-AN-A0FS-01 | Breast | breast invasive carcinoma | Female | <65 | I/II | Unknown | Unknown | SD | ||
| PTGDR | insertion | Nonsense_Mutation | novel | c.414_415insTCCTAAACCATTTTAGGTTATGGCAA | p.Phe139SerfsTer2 | p.F139Sfs*2 | Q13258 | protein_coding | TCGA-AN-A0FS-01 | Breast | breast invasive carcinoma | Female | <65 | I/II | Unknown | Unknown | SD | ||
| PTGDR | deletion | Frame_Shift_Del | c.392delN | p.Trp131CysfsTer4 | p.W131Cfs*4 | Q13258 | protein_coding | TCGA-D8-A27V-01 | Breast | breast invasive carcinoma | Female | <65 | I/II | Hormone Therapy | tamoxiphen | SD | |||
| PTGDR | SNV | Missense_Mutation | c.81N>A | p.Phe27Leu | p.F27L | Q13258 | protein_coding | deleterious(0) | probably_damaging(0.994) | TCGA-EK-A2PG-01 | Cervix | cervical & endocervical cancer | Female | >=65 | I/II | Unknown | Unknown | SD | |
| PTGDR | SNV | Missense_Mutation | c.439N>T | p.Arg147Cys | p.R147C | Q13258 | protein_coding | deleterious(0) | probably_damaging(0.987) | TCGA-WL-A834-01 | Cervix | cervical & endocervical cancer | Female | <65 | I/II | Chemotherapy | paclitaxel | SD | |
| PTGDR | SNV | Missense_Mutation | c.1017N>A | p.Phe339Leu | p.F339L | Q13258 | protein_coding | tolerated(0.73) | benign(0.071) | TCGA-AA-3510-01 | Colorectum | colon adenocarcinoma | Male | >=65 | I/II | Unknown | Unknown | SD | |
| PTGDR | SNV | Missense_Mutation | c.799N>A | p.Leu267Met | p.L267M | Q13258 | protein_coding | deleterious(0) | probably_damaging(0.99) | TCGA-D5-6930-01 | Colorectum | colon adenocarcinoma | Male | >=65 | I/II | Unknown | Unknown | SD |
| Page: 1 2 3 4 5 6 7 |
Top |
Related drugs of malignant transformation related genes |
| Identification of chemicals and drugs interact with genes involved in malignant transfromation |
| (DGIdb 4.0) |
| Entrez ID | Symbol | Category | Interaction Types | Drug Claim Name | Drug Name | PMIDs |
| 5729 | PTGDR | DRUGGABLE GENOME, G PROTEIN COUPLED RECEPTOR | PGF2alpha | |||
| 5729 | PTGDR | DRUGGABLE GENOME, G PROTEIN COUPLED RECEPTOR | antagonist | 135649910 | ||
| 5729 | PTGDR | DRUGGABLE GENOME, G PROTEIN COUPLED RECEPTOR | TS-022 | |||
| 5729 | PTGDR | DRUGGABLE GENOME, G PROTEIN COUPLED RECEPTOR | agonist | 135650477 | ||
| 5729 | PTGDR | DRUGGABLE GENOME, G PROTEIN COUPLED RECEPTOR | AMG 853 | |||
| 5729 | PTGDR | DRUGGABLE GENOME, G PROTEIN COUPLED RECEPTOR | MK-1029 | MK-1029 | ||
| 5729 | PTGDR | DRUGGABLE GENOME, G PROTEIN COUPLED RECEPTOR | agonist | 135651542 | ||
| 5729 | PTGDR | DRUGGABLE GENOME, G PROTEIN COUPLED RECEPTOR | ONO-4053 | |||
| 5729 | PTGDR | DRUGGABLE GENOME, G PROTEIN COUPLED RECEPTOR | S-555739 | ASAPIPRANT | ||
| 5729 | PTGDR | DRUGGABLE GENOME, G PROTEIN COUPLED RECEPTOR | AM-461 | AM-461 |
| Page: 1 2 3 4 5 |

Copyright 2023-Present -The University of Texas Health Science Center at Houston |