
|
|||||
|
 | |
| |
| |
| |
| |
| |
|
Gene: PTER |
Gene summary for PTER |
| Gene information | Species | Human | Gene symbol | PTER | Gene ID | 9317 |
| Gene name | phosphotriesterase related | |
| Gene Alias | HPHRP | |
| Cytomap | 10p13 | |
| Gene Type | protein-coding | GO ID | GO:0008150 | UniProtAcc | Q96BW5 |
Top |
Malignant transformation analysis |
| Identification of the aberrant gene expression in precancerous and cancerous lesions by comparing the gene expression of stem-like cells in diseased tissues with normal stem cells |
| Entrez ID | Symbol | Replicates | Species | Organ | Tissue | Adj P-value | Log2FC | Malignancy |
| 9317 | PTER | LZE5T | Human | Esophagus | ESCC | 3.86e-02 | 2.26e-01 | 0.0514 |
| 9317 | PTER | LZE24T | Human | Esophagus | ESCC | 6.05e-06 | 1.31e-01 | 0.0596 |
| 9317 | PTER | P2T-E | Human | Esophagus | ESCC | 4.65e-09 | 1.82e-01 | 0.1177 |
| 9317 | PTER | P4T-E | Human | Esophagus | ESCC | 1.90e-03 | 9.67e-02 | 0.1323 |
| 9317 | PTER | P8T-E | Human | Esophagus | ESCC | 4.23e-08 | 2.11e-01 | 0.0889 |
| 9317 | PTER | P9T-E | Human | Esophagus | ESCC | 4.16e-04 | 6.83e-02 | 0.1131 |
| 9317 | PTER | P11T-E | Human | Esophagus | ESCC | 4.95e-04 | 1.67e-01 | 0.1426 |
| 9317 | PTER | P12T-E | Human | Esophagus | ESCC | 1.12e-03 | 1.07e-01 | 0.1122 |
| 9317 | PTER | P16T-E | Human | Esophagus | ESCC | 2.27e-12 | 1.53e-01 | 0.1153 |
| 9317 | PTER | P20T-E | Human | Esophagus | ESCC | 1.31e-07 | 1.52e-01 | 0.1124 |
| 9317 | PTER | P21T-E | Human | Esophagus | ESCC | 2.96e-04 | 1.30e-01 | 0.1617 |
| 9317 | PTER | P23T-E | Human | Esophagus | ESCC | 5.73e-06 | 1.16e-01 | 0.108 |
| 9317 | PTER | P26T-E | Human | Esophagus | ESCC | 9.30e-05 | 1.72e-01 | 0.1276 |
| 9317 | PTER | P27T-E | Human | Esophagus | ESCC | 1.83e-02 | 5.38e-02 | 0.1055 |
| 9317 | PTER | P30T-E | Human | Esophagus | ESCC | 6.69e-04 | 1.22e-01 | 0.137 |
| 9317 | PTER | P32T-E | Human | Esophagus | ESCC | 1.06e-06 | 1.48e-01 | 0.1666 |
| 9317 | PTER | P36T-E | Human | Esophagus | ESCC | 1.18e-05 | 1.43e-01 | 0.1187 |
| 9317 | PTER | P42T-E | Human | Esophagus | ESCC | 1.02e-04 | 9.19e-02 | 0.1175 |
| 9317 | PTER | P52T-E | Human | Esophagus | ESCC | 1.05e-06 | 1.44e-01 | 0.1555 |
| 9317 | PTER | P54T-E | Human | Esophagus | ESCC | 9.77e-09 | 1.98e-01 | 0.0975 |
| Page: 1 2 |
| Tissue | Expression Dynamics | Abbreviation |
| Esophagus | 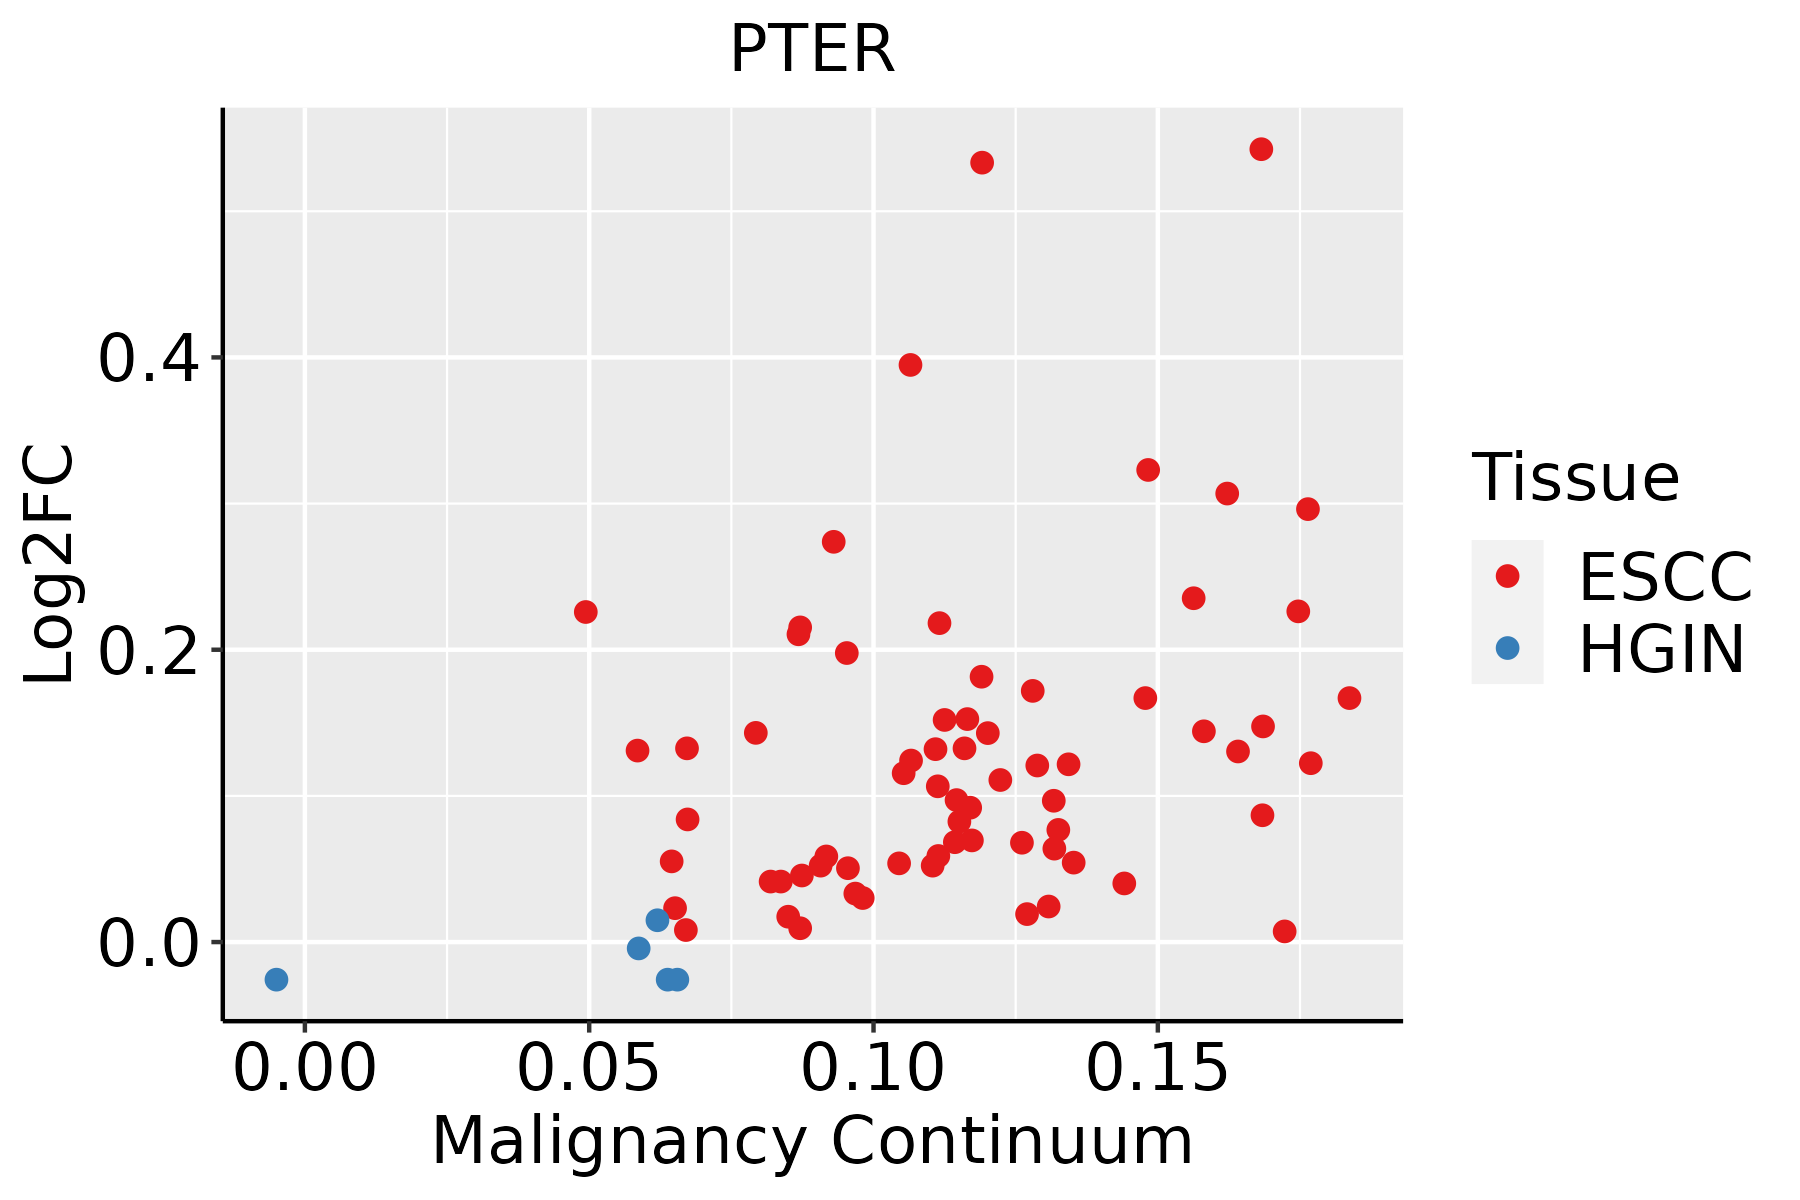 | ESCC: Esophageal squamous cell carcinoma |
| HGIN: High-grade intraepithelial neoplasias | ||
| LGIN: Low-grade intraepithelial neoplasias | ||
| Liver | 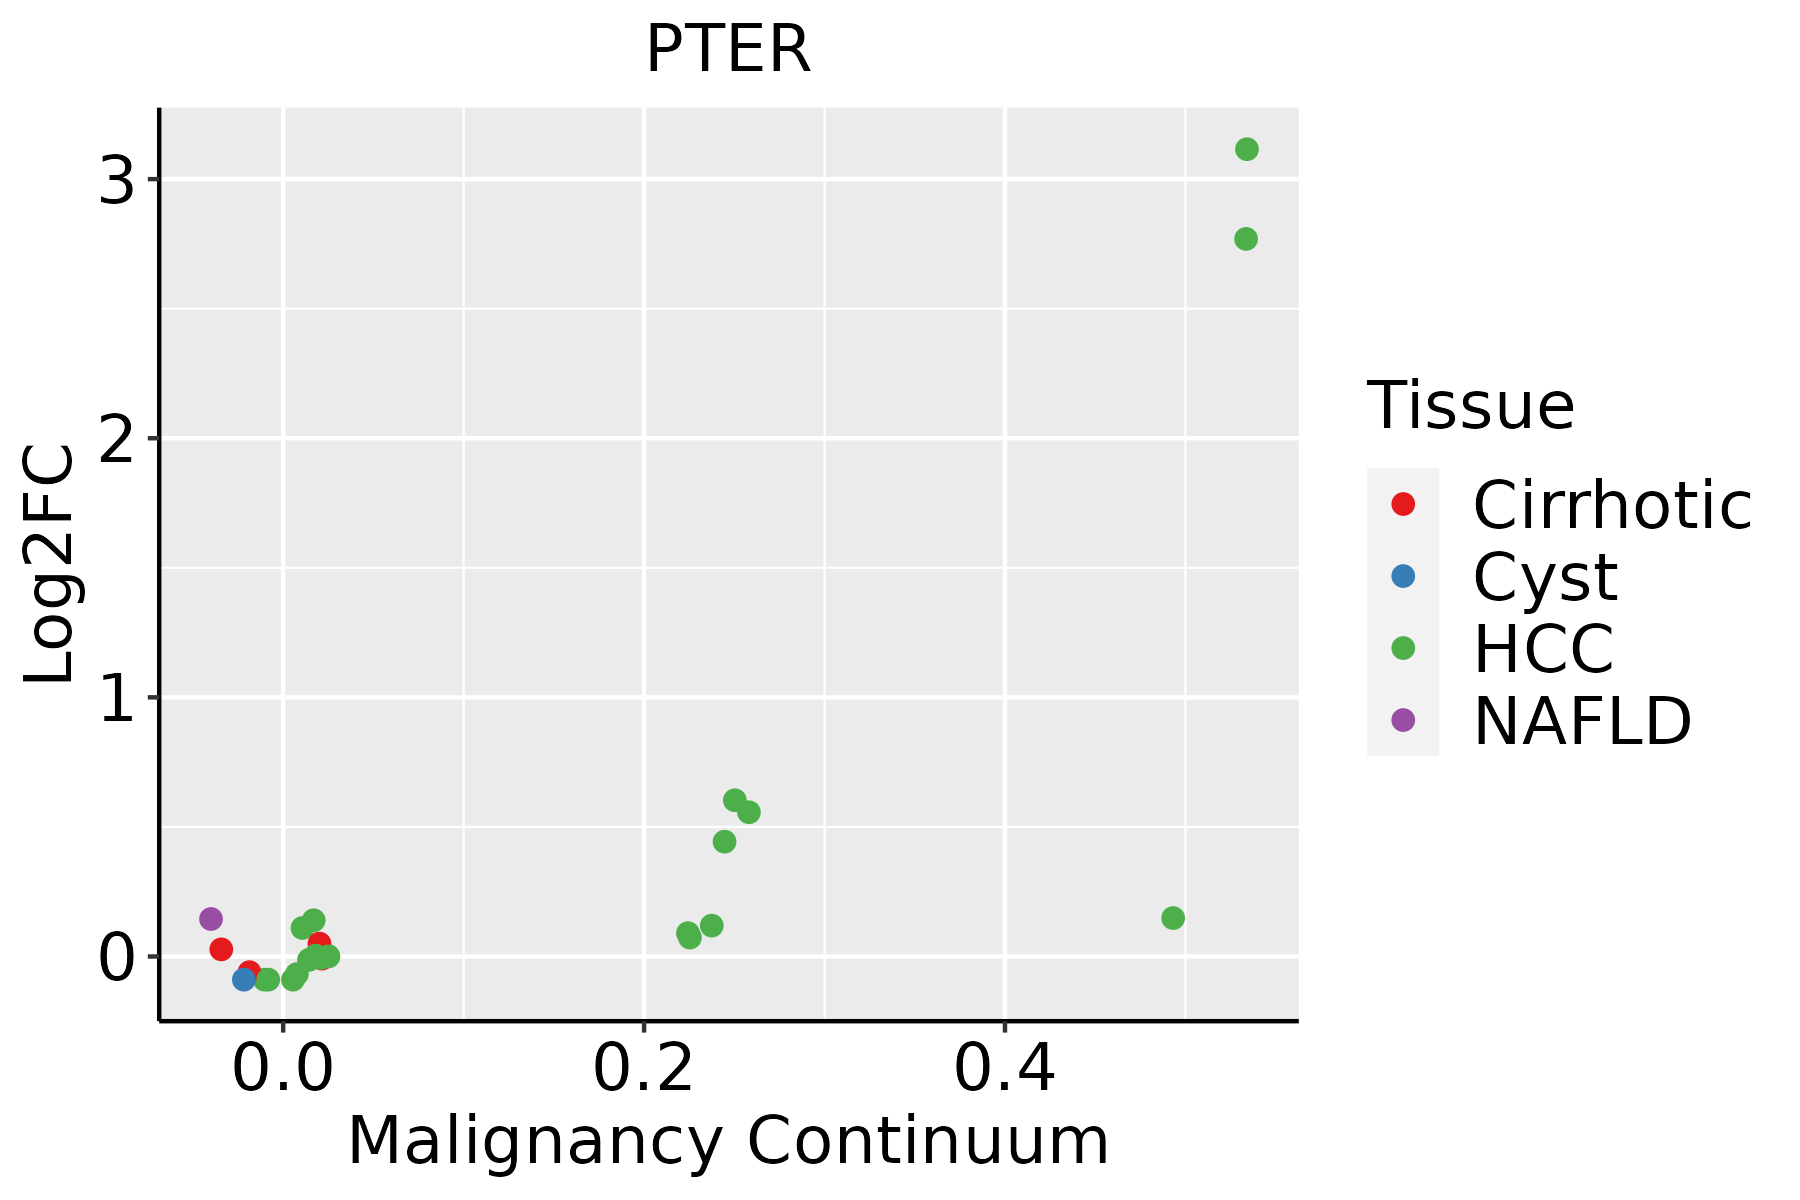 | HCC: Hepatocellular carcinoma |
| NAFLD: Non-alcoholic fatty liver disease |
| ∗log2FC in expression of this searched gene in stem-like cells from each diseased tissue sample relative to stem-like cells in normal samples in each tissue plotted against the malignancy continuum. Samples are colored based on if they are from different disease stage. |
Top |
Malignant transformation related pathway analysis |
| Find out the enriched GO biological processes and KEGG pathways involved in transition from healthy to precancer to cancer |
| Tissue | Disease Stage | Enriched GO biological Processes |
| Colorectum | AD |  |
| Colorectum | SER |  |
| Colorectum | MSS |  |
| Colorectum | MSI-H |  |
| Colorectum | FAP |  |
| ∗Top 15 enriched GO BP terms are showed in the bar plot of each disease state in each tissue. Each row represents a significant GO biological process which is colored according to the -log10(p.adjust). |
| Page: 1 2 3 4 5 6 7 8 9 |
| GO ID | Tissue | Disease Stage | Description | Gene Ratio | Bg Ratio | pvalue | p.adjust | Count |
| Page: 1 |
| Pathway ID | Tissue | Disease Stage | Description | Gene Ratio | Bg Ratio | pvalue | p.adjust | qvalue | Count |
| Page: 1 |
Top |
Cell-cell communication analysis |
| Identification of potential cell-cell interactions between two cell types and their ligand-receptor pairs for different disease states |
| Ligand | Receptor | LRpair | Pathway | Tissue | Disease Stage |
| Page: 1 |
Top |
Single-cell gene regulatory network inference analysis |
| Find out the significant the regulons (TFs) and the target genes of each regulon across cell types for different disease states |
| TF | Cell Type | Tissue | Disease Stage | Target Gene | RSS | Regulon Activity |
| ∗The dot plots of a searched regulon are shown for all cell subpopulations in each disease state of each tissue based on the regulon specific score inferred using pySCENIC and by calculating the average expression. |
| Page: 1 |
Top |
Somatic mutation of malignant transformation related genes |
| Annotation of somatic variants for genes involved in malignant transformation |
| Hugo Symbol | Variant Class | Variant Classification | dbSNP RS | HGVSc | HGVSp | HGVSp Short | SWISSPROT | BIOTYPE | SIFT | PolyPhen | Tumor Sample Barcode | Tissue | Histology | Sex | Age | Stage | Therapy Types | Drugs | Outcome |
| PTER | SNV | Missense_Mutation | c.830N>T | p.Arg277Ile | p.R277I | Q96BW5 | protein_coding | deleterious(0) | probably_damaging(1) | TCGA-AN-A046-01 | Breast | breast invasive carcinoma | Female | >=65 | I/II | Unknown | Unknown | SD | |
| PTER | SNV | Missense_Mutation | novel | c.802G>C | p.Asp268His | p.D268H | Q96BW5 | protein_coding | tolerated(0.09) | possibly_damaging(0.717) | TCGA-BH-A2L8-01 | Breast | breast invasive carcinoma | Female | <65 | I/II | Chemotherapy | cytoxan | CR |
| PTER | deletion | Frame_Shift_Del | novel | c.641delG | p.Arg214GlnfsTer82 | p.R214Qfs*82 | Q96BW5 | protein_coding | TCGA-EW-A2FV-01 | Breast | breast invasive carcinoma | Female | <65 | III/IV | Chemotherapy | docetaxel | SD | ||
| PTER | SNV | Missense_Mutation | novel | c.266C>A | p.Ala89Asp | p.A89D | Q96BW5 | protein_coding | tolerated(0.35) | possibly_damaging(0.703) | TCGA-2W-A8YY-01 | Cervix | cervical & endocervical cancer | Female | <65 | I/II | Chemotherapy | cisplatin | CR |
| PTER | SNV | Missense_Mutation | novel | c.709N>C | p.Asp237His | p.D237H | Q96BW5 | protein_coding | deleterious(0.02) | benign(0.049) | TCGA-C5-A8YQ-01 | Cervix | cervical & endocervical cancer | Female | >=65 | I/II | Chemotherapy | cisplatin | PD |
| PTER | SNV | Missense_Mutation | novel | c.505N>A | p.Glu169Lys | p.E169K | Q96BW5 | protein_coding | deleterious(0) | probably_damaging(0.946) | TCGA-HM-A4S6-01 | Cervix | cervical & endocervical cancer | Female | <65 | III/IV | Chemotherapy | cisplatin | CR |
| PTER | SNV | Missense_Mutation | c.980G>A | p.Arg327Lys | p.R327K | Q96BW5 | protein_coding | tolerated(0.38) | benign(0.326) | TCGA-VS-A959-01 | Cervix | cervical & endocervical cancer | Female | >=65 | I/II | Unknown | Unknown | SD | |
| PTER | SNV | Missense_Mutation | rs376388470 | c.844N>T | p.Arg282Cys | p.R282C | Q96BW5 | protein_coding | deleterious(0.04) | benign(0.022) | TCGA-AA-3715-01 | Colorectum | colon adenocarcinoma | Male | >=65 | I/II | Unknown | Unknown | PD |
| PTER | SNV | Missense_Mutation | rs370657038 | c.353N>A | p.Gly118Asp | p.G118D | Q96BW5 | protein_coding | deleterious(0.04) | benign(0.434) | TCGA-AA-3966-01 | Colorectum | colon adenocarcinoma | Female | >=65 | I/II | Unknown | Unknown | SD |
| PTER | SNV | Missense_Mutation | c.241N>C | p.Lys81Gln | p.K81Q | Q96BW5 | protein_coding | tolerated(0.31) | benign(0.148) | TCGA-AA-3977-01 | Colorectum | colon adenocarcinoma | Male | >=65 | I/II | Unknown | Unknown | SD |
| Page: 1 2 3 4 5 |
Top |
Related drugs of malignant transformation related genes |
| Identification of chemicals and drugs interact with genes involved in malignant transfromation |
| (DGIdb 4.0) |
| Entrez ID | Symbol | Category | Interaction Types | Drug Claim Name | Drug Name | PMIDs |
| Page: 1 |

Copyright 2023-Present -The University of Texas Health Science Center at Houston |