
|
|||||
|
 | |
| |
| |
| |
| |
| |
|
Gene: PTEN |
Gene summary for PTEN |
| Gene information | Species | Human | Gene symbol | PTEN | Gene ID | 5728 |
| Gene name | phosphatase and tensin homolog | |
| Gene Alias | 10q23del | |
| Cytomap | 10q23.31 | |
| Gene Type | protein-coding | GO ID | GO:0000003 | UniProtAcc | F6KD01 |
Top |
Malignant transformation analysis |
| Identification of the aberrant gene expression in precancerous and cancerous lesions by comparing the gene expression of stem-like cells in diseased tissues with normal stem cells |
| Entrez ID | Symbol | Replicates | Species | Organ | Tissue | Adj P-value | Log2FC | Malignancy |
| 5728 | PTEN | HTA11_3410_2000001011 | Human | Colorectum | AD | 2.06e-18 | -6.22e-01 | 0.0155 |
| 5728 | PTEN | HTA11_347_2000001011 | Human | Colorectum | AD | 3.31e-08 | 4.64e-01 | -0.1954 |
| 5728 | PTEN | HTA11_696_2000001011 | Human | Colorectum | AD | 2.93e-02 | -2.95e-01 | -0.1464 |
| 5728 | PTEN | HTA11_9408_2000001011 | Human | Colorectum | AD | 6.87e-03 | -8.39e-01 | 0.0451 |
| 5728 | PTEN | HTA11_8622_2000001021 | Human | Colorectum | SER | 3.14e-02 | -4.65e-01 | 0.0528 |
| 5728 | PTEN | HTA11_7696_3000711011 | Human | Colorectum | AD | 8.09e-13 | -5.16e-01 | 0.0674 |
| 5728 | PTEN | HTA11_6818_2000001011 | Human | Colorectum | AD | 2.24e-05 | -5.70e-01 | 0.0112 |
| 5728 | PTEN | HTA11_6818_2000001021 | Human | Colorectum | AD | 1.36e-08 | -6.76e-01 | 0.0588 |
| 5728 | PTEN | HTA11_99999970781_79442 | Human | Colorectum | MSS | 1.04e-04 | -3.76e-01 | 0.294 |
| 5728 | PTEN | HTA11_99999973899_84307 | Human | Colorectum | MSS | 1.66e-06 | -7.65e-01 | 0.2585 |
| 5728 | PTEN | HTA11_99999974143_84620 | Human | Colorectum | MSS | 4.11e-27 | -6.82e-01 | 0.3005 |
| 5728 | PTEN | A002-C-010 | Human | Colorectum | FAP | 1.42e-02 | -1.92e-01 | 0.242 |
| 5728 | PTEN | A001-C-207 | Human | Colorectum | FAP | 3.53e-06 | -4.40e-01 | 0.1278 |
| 5728 | PTEN | A015-C-203 | Human | Colorectum | FAP | 1.19e-44 | -7.16e-01 | -0.1294 |
| 5728 | PTEN | A015-C-204 | Human | Colorectum | FAP | 5.68e-08 | -4.99e-01 | -0.0228 |
| 5728 | PTEN | A014-C-040 | Human | Colorectum | FAP | 2.47e-05 | -4.96e-01 | -0.1184 |
| 5728 | PTEN | A002-C-201 | Human | Colorectum | FAP | 1.98e-20 | -5.87e-01 | 0.0324 |
| 5728 | PTEN | A002-C-203 | Human | Colorectum | FAP | 8.92e-06 | -2.80e-01 | 0.2786 |
| 5728 | PTEN | A001-C-119 | Human | Colorectum | FAP | 1.55e-23 | -9.40e-01 | -0.1557 |
| 5728 | PTEN | A001-C-108 | Human | Colorectum | FAP | 1.51e-23 | -6.01e-01 | -0.0272 |
| Page: 1 2 3 4 5 6 7 8 9 |
| Tissue | Expression Dynamics | Abbreviation |
| Colorectum (GSE201348) |  | FAP: Familial adenomatous polyposis |
| CRC: Colorectal cancer | ||
| Colorectum (HTA11) |  | AD: Adenomas |
| SER: Sessile serrated lesions | ||
| MSI-H: Microsatellite-high colorectal cancer | ||
| MSS: Microsatellite stable colorectal cancer | ||
| Esophagus | 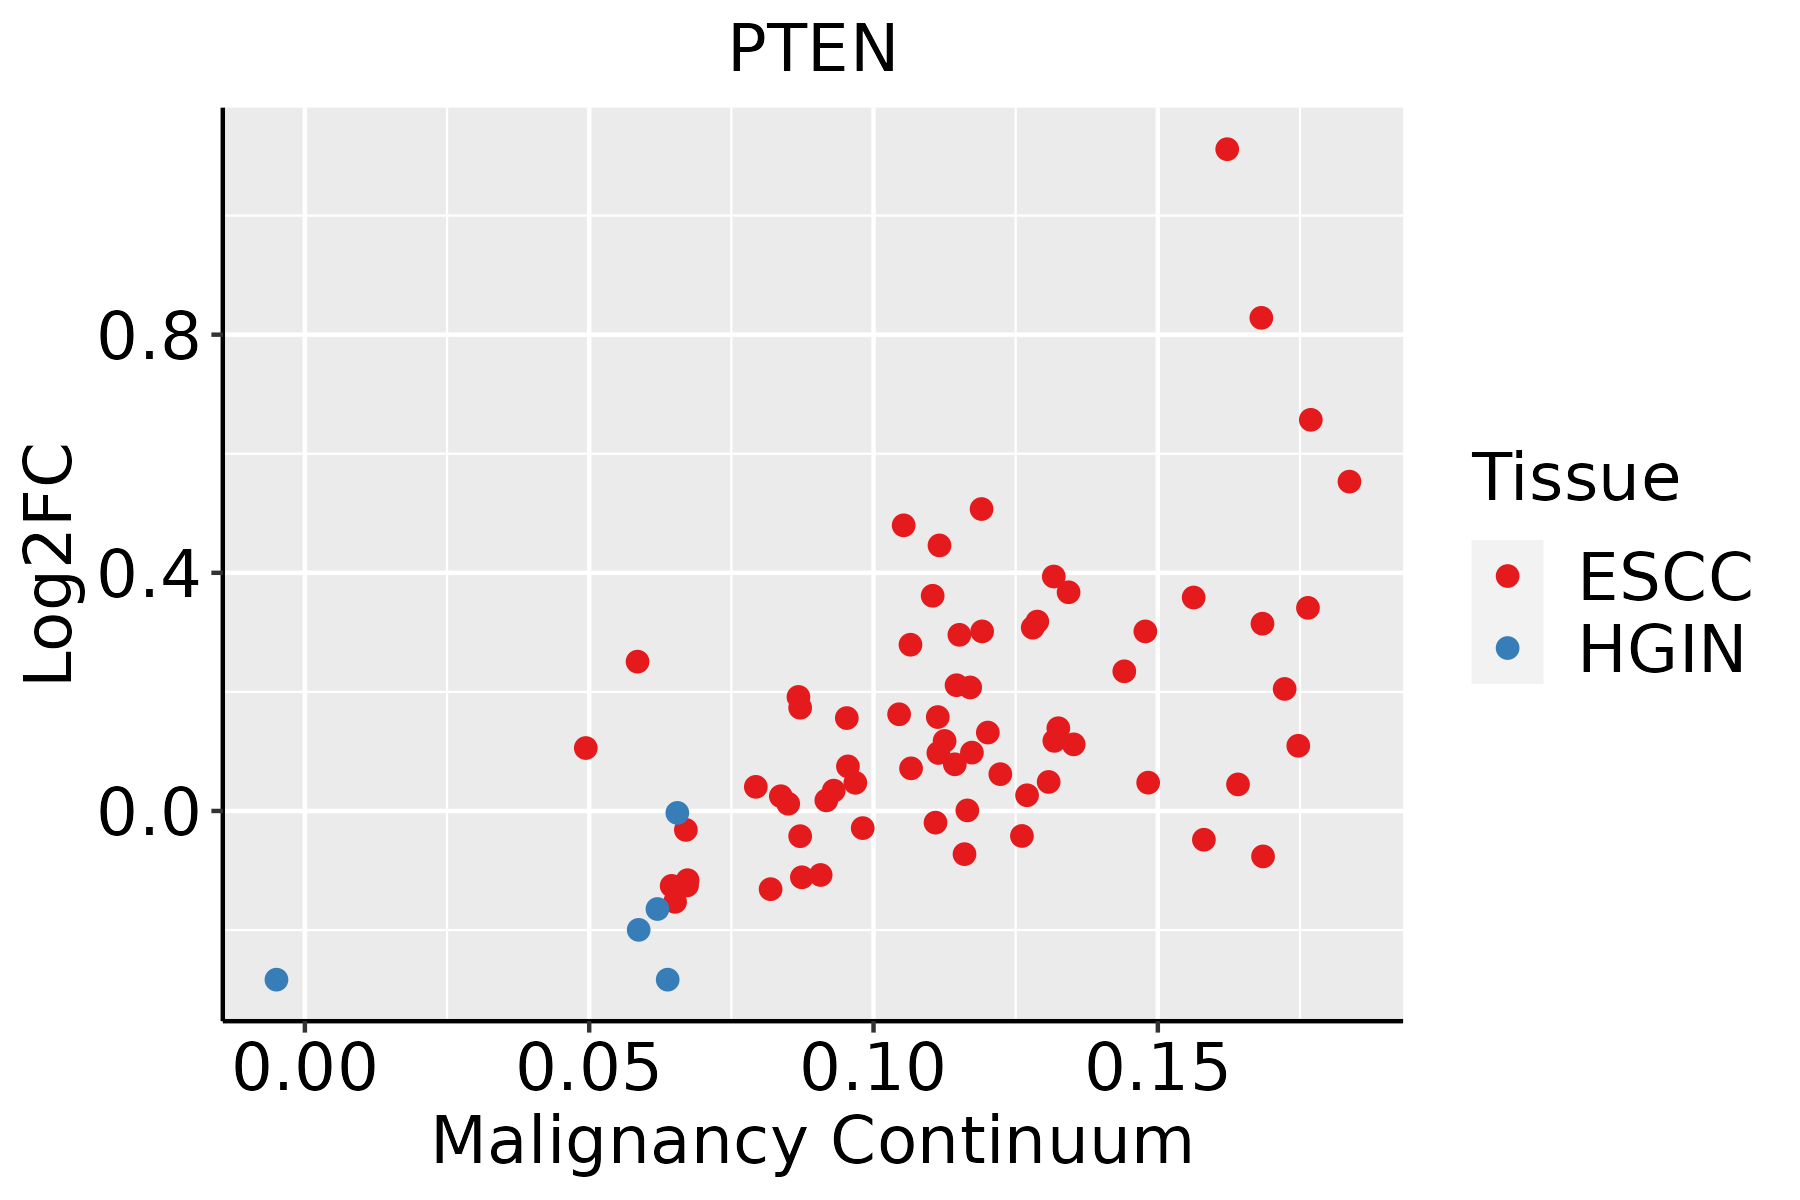 | ESCC: Esophageal squamous cell carcinoma |
| HGIN: High-grade intraepithelial neoplasias | ||
| LGIN: Low-grade intraepithelial neoplasias | ||
| Liver | 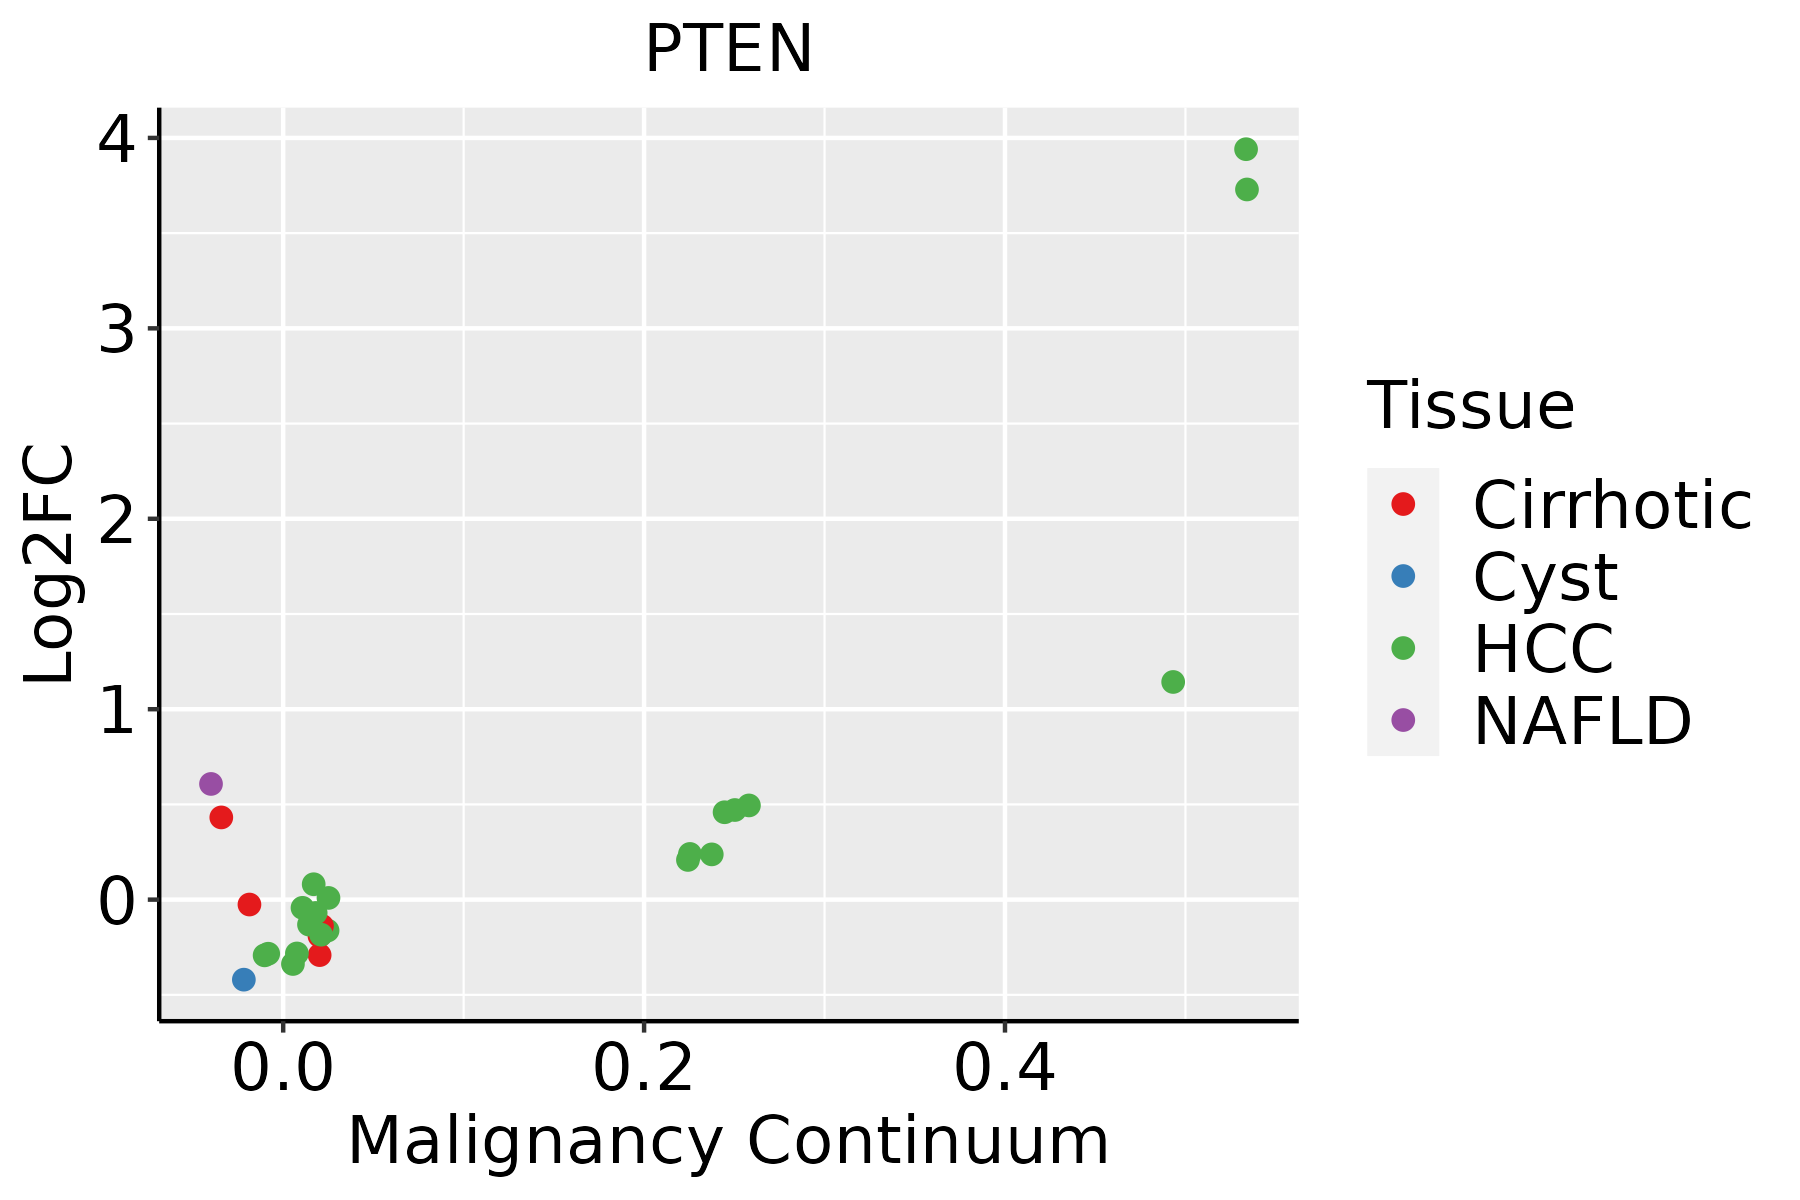 | HCC: Hepatocellular carcinoma |
| NAFLD: Non-alcoholic fatty liver disease | ||
| Lung |  | AAH: Atypical adenomatous hyperplasia |
| AIS: Adenocarcinoma in situ | ||
| IAC: Invasive lung adenocarcinoma | ||
| MIA: Minimally invasive adenocarcinoma | ||
| Oral Cavity | 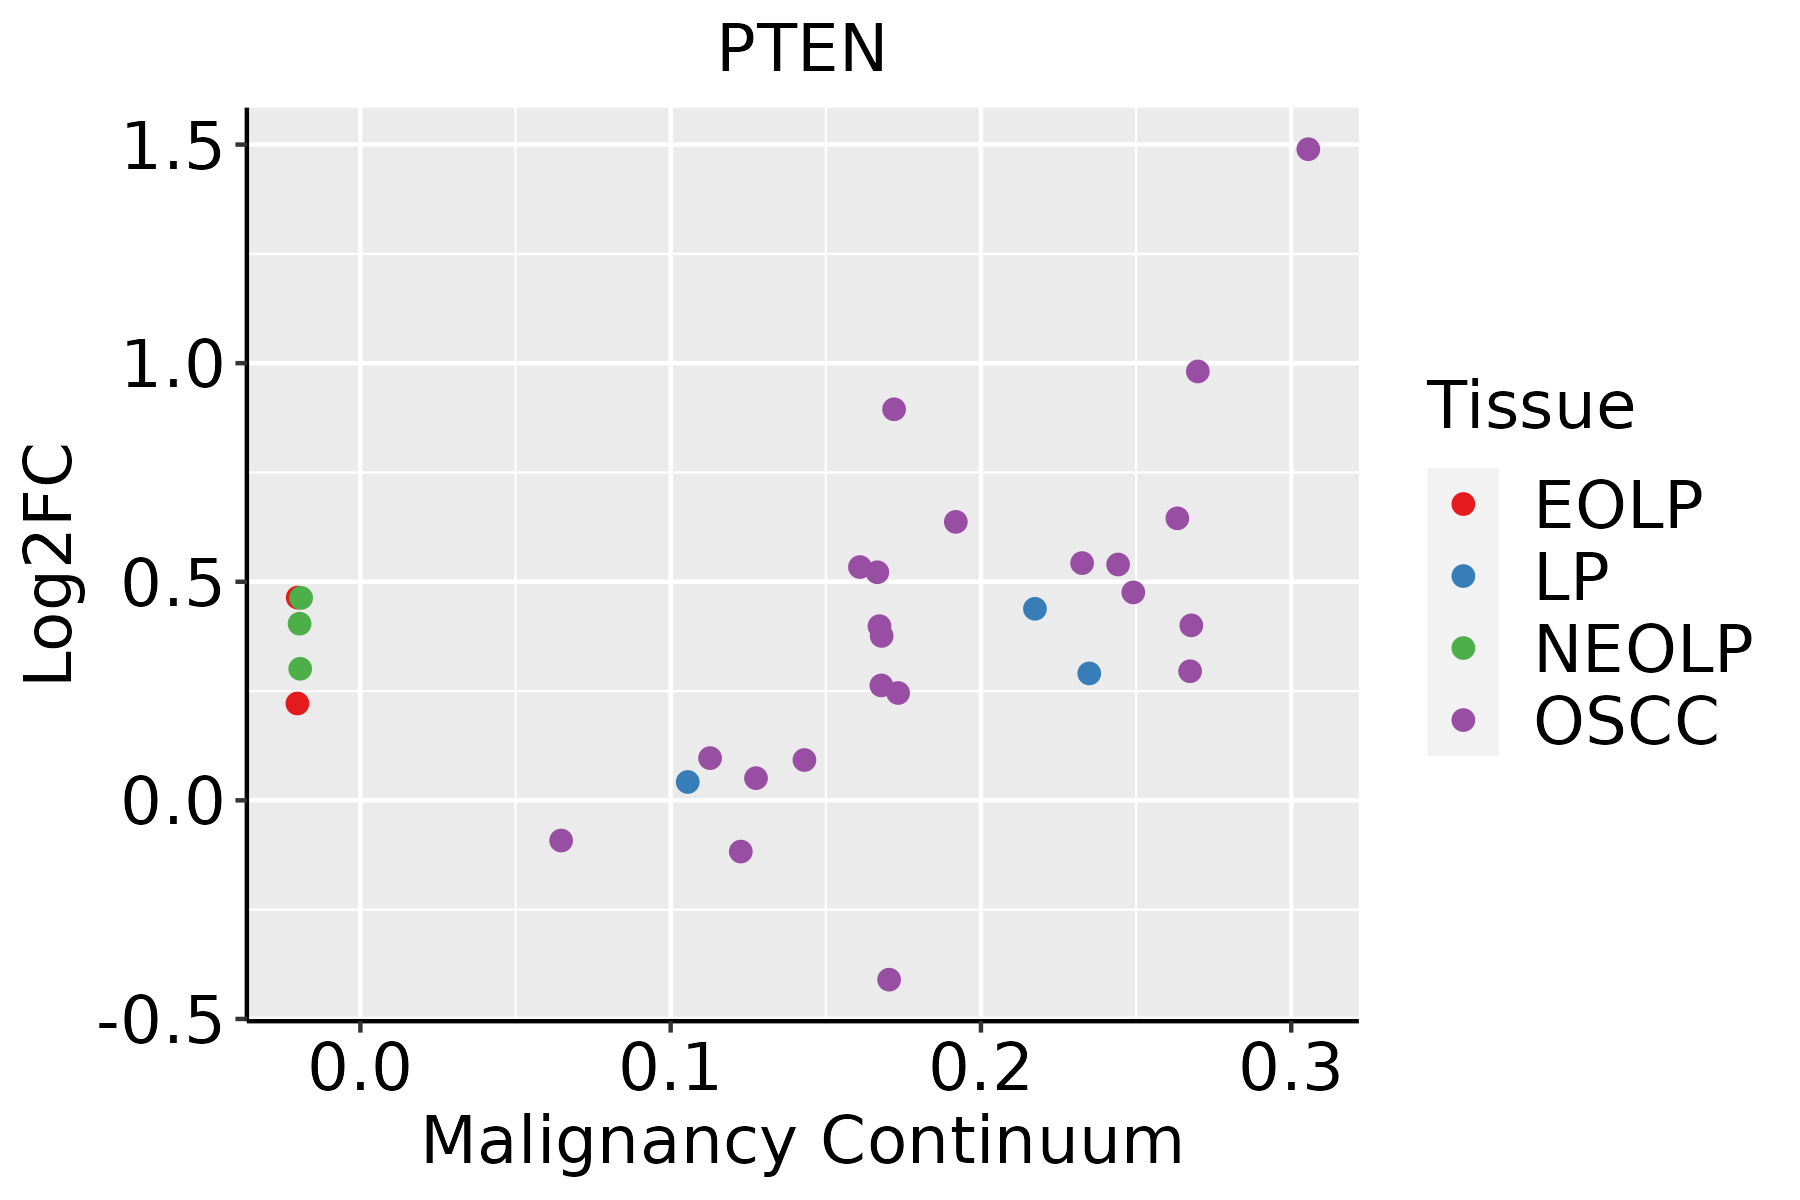 | EOLP: Erosive Oral lichen planus |
| LP: leukoplakia | ||
| NEOLP: Non-erosive oral lichen planus | ||
| OSCC: Oral squamous cell carcinoma | ||
| Prostate |  | BPH: Benign Prostatic Hyperplasia |
| Skin | 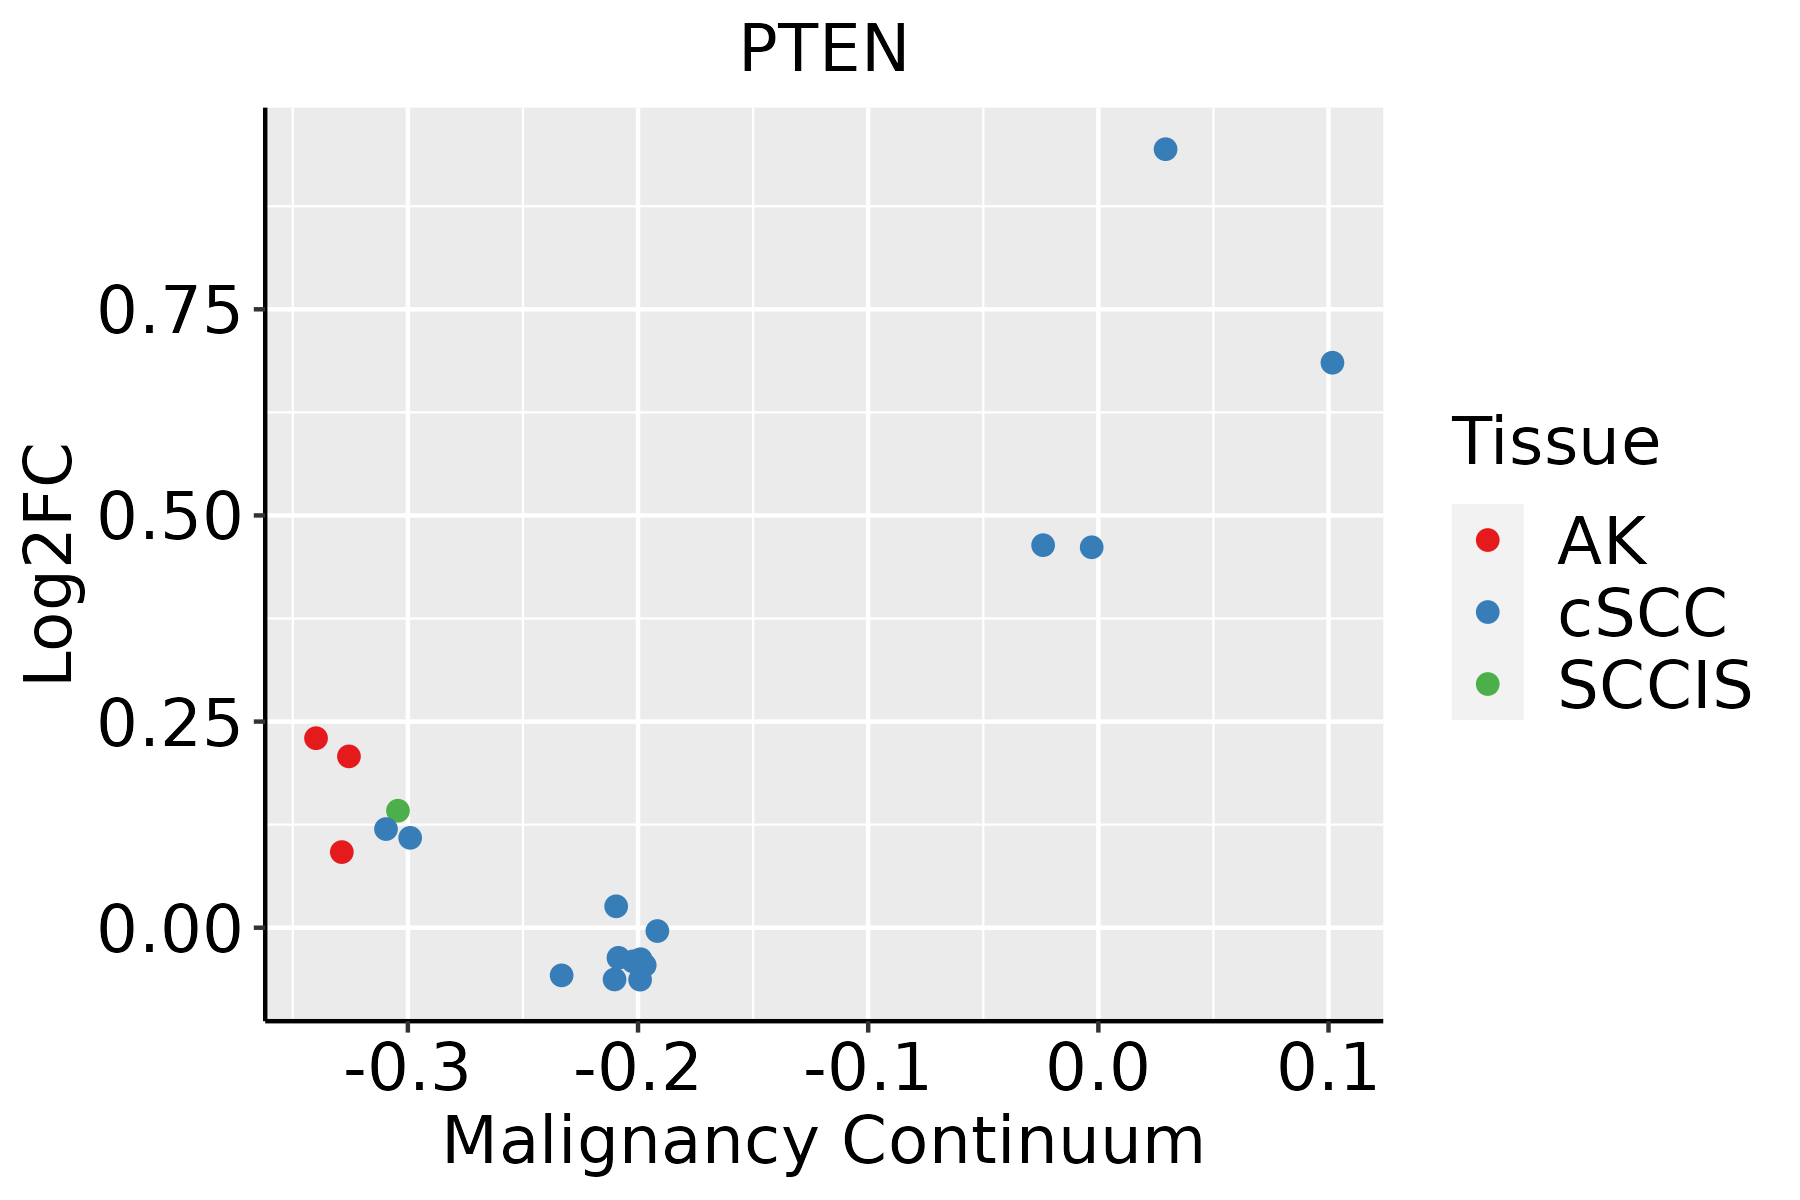 | AK: Actinic keratosis |
| cSCC: Cutaneous squamous cell carcinoma | ||
| SCCIS:squamous cell carcinoma in situ | ||
| Thyroid | 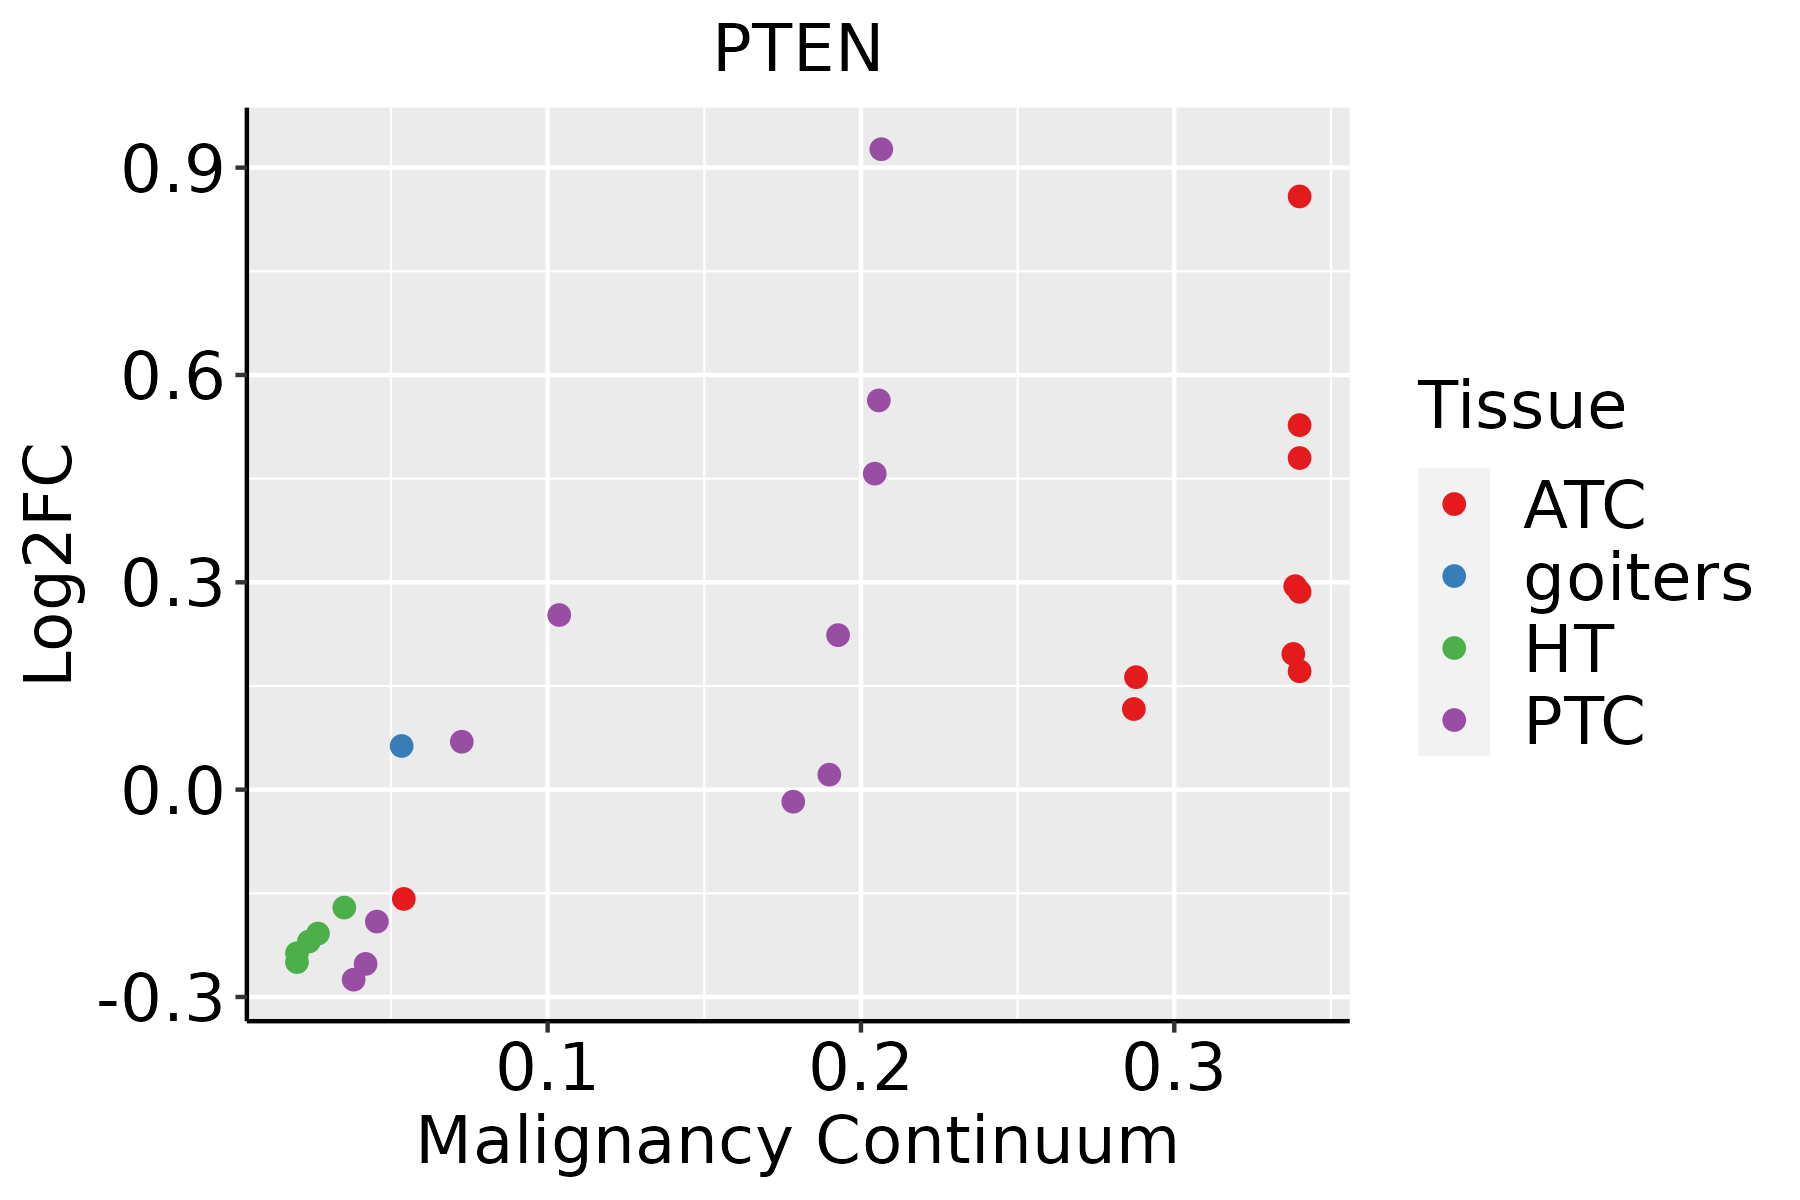 | ATC: Anaplastic thyroid cancer |
| HT: Hashimoto's thyroiditis | ||
| PTC: Papillary thyroid cancer |
| ∗log2FC in expression of this searched gene in stem-like cells from each diseased tissue sample relative to stem-like cells in normal samples in each tissue plotted against the malignancy continuum. Samples are colored based on if they are from different disease stage. |
Top |
Malignant transformation related pathway analysis |
| Find out the enriched GO biological processes and KEGG pathways involved in transition from healthy to precancer to cancer |
| Tissue | Disease Stage | Enriched GO biological Processes |
| Colorectum | AD |  |
| Colorectum | SER |  |
| Colorectum | MSS |  |
| Colorectum | MSI-H |  |
| Colorectum | FAP |  |
| ∗Top 15 enriched GO BP terms are showed in the bar plot of each disease state in each tissue. Each row represents a significant GO biological process which is colored according to the -log10(p.adjust). |
| Page: 1 2 3 4 5 6 7 8 9 |
| GO ID | Tissue | Disease Stage | Description | Gene Ratio | Bg Ratio | pvalue | p.adjust | Count |
| GO:0042176 | Colorectum | AD | regulation of protein catabolic process | 160/3918 | 391/18723 | 1.06e-19 | 7.34e-17 | 160 |
| GO:0009896 | Colorectum | AD | positive regulation of catabolic process | 180/3918 | 492/18723 | 4.33e-16 | 1.94e-13 | 180 |
| GO:1903362 | Colorectum | AD | regulation of cellular protein catabolic process | 109/3918 | 255/18723 | 2.14e-15 | 6.08e-13 | 109 |
| GO:0031331 | Colorectum | AD | positive regulation of cellular catabolic process | 156/3918 | 427/18723 | 4.68e-14 | 1.05e-11 | 156 |
| GO:0032535 | Colorectum | AD | regulation of cellular component size | 142/3918 | 383/18723 | 1.74e-13 | 3.41e-11 | 142 |
| GO:1903050 | Colorectum | AD | regulation of proteolysis involved in cellular protein catabolic process | 92/3918 | 221/18723 | 2.04e-12 | 3.19e-10 | 92 |
| GO:0045732 | Colorectum | AD | positive regulation of protein catabolic process | 92/3918 | 231/18723 | 3.85e-11 | 4.47e-09 | 92 |
| GO:0048732 | Colorectum | AD | gland development | 149/3918 | 436/18723 | 6.07e-11 | 6.33e-09 | 149 |
| GO:0045862 | Colorectum | AD | positive regulation of proteolysis | 129/3918 | 372/18723 | 4.04e-10 | 3.46e-08 | 129 |
| GO:0031647 | Colorectum | AD | regulation of protein stability | 108/3918 | 298/18723 | 6.33e-10 | 5.08e-08 | 108 |
| GO:2000058 | Colorectum | AD | regulation of ubiquitin-dependent protein catabolic process | 68/3918 | 164/18723 | 1.82e-09 | 1.31e-07 | 68 |
| GO:0022613 | Colorectum | AD | ribonucleoprotein complex biogenesis | 151/3918 | 463/18723 | 1.96e-09 | 1.39e-07 | 151 |
| GO:0034329 | Colorectum | AD | cell junction assembly | 136/3918 | 420/18723 | 2.02e-08 | 1.15e-06 | 136 |
| GO:2001233 | Colorectum | AD | regulation of apoptotic signaling pathway | 119/3918 | 356/18723 | 2.14e-08 | 1.21e-06 | 119 |
| GO:0050821 | Colorectum | AD | protein stabilization | 73/3918 | 191/18723 | 3.02e-08 | 1.64e-06 | 73 |
| GO:1903364 | Colorectum | AD | positive regulation of cellular protein catabolic process | 62/3918 | 155/18723 | 4.66e-08 | 2.51e-06 | 62 |
| GO:0010810 | Colorectum | AD | regulation of cell-substrate adhesion | 81/3918 | 221/18723 | 4.80e-08 | 2.55e-06 | 81 |
| GO:1903320 | Colorectum | AD | regulation of protein modification by small protein conjugation or removal | 86/3918 | 242/18723 | 9.43e-08 | 4.65e-06 | 86 |
| GO:0032868 | Colorectum | AD | response to insulin | 91/3918 | 264/18723 | 2.02e-07 | 8.48e-06 | 91 |
| GO:0150115 | Colorectum | AD | cell-substrate junction organization | 44/3918 | 101/18723 | 2.38e-07 | 9.81e-06 | 44 |
| Page: 1 2 3 4 5 6 7 8 9 10 11 12 13 14 15 16 17 18 19 20 21 22 23 24 25 26 27 28 29 30 31 32 33 34 35 36 37 38 39 40 41 42 43 44 45 46 47 48 49 50 51 52 53 54 55 56 57 58 59 60 61 62 63 64 65 66 67 68 69 70 71 72 73 74 75 76 77 78 79 80 81 82 83 84 85 86 87 88 89 90 91 92 93 94 95 96 97 98 99 100 101 102 103 104 105 106 107 108 109 110 111 112 113 114 115 116 117 118 119 120 121 122 123 124 125 126 127 128 129 130 131 132 133 134 135 136 137 138 139 140 141 142 143 144 145 146 |
| Pathway ID | Tissue | Disease Stage | Description | Gene Ratio | Bg Ratio | pvalue | p.adjust | qvalue | Count |
| hsa05208 | Colorectum | AD | Chemical carcinogenesis - reactive oxygen species | 126/2092 | 223/8465 | 1.01e-24 | 1.68e-22 | 1.07e-22 | 126 |
| hsa05415 | Colorectum | AD | Diabetic cardiomyopathy | 114/2092 | 203/8465 | 3.65e-22 | 3.06e-20 | 1.95e-20 | 114 |
| hsa05213 | Colorectum | AD | Endometrial cancer | 29/2092 | 58/8465 | 2.69e-05 | 2.57e-04 | 1.64e-04 | 29 |
| hsa05230 | Colorectum | AD | Central carbon metabolism in cancer | 33/2092 | 70/8465 | 3.61e-05 | 3.19e-04 | 2.03e-04 | 33 |
| hsa05225 | Colorectum | AD | Hepatocellular carcinoma | 59/2092 | 168/8465 | 1.50e-03 | 8.69e-03 | 5.54e-03 | 59 |
| hsa04510 | Colorectum | AD | Focal adhesion | 67/2092 | 203/8465 | 4.40e-03 | 2.17e-02 | 1.38e-02 | 67 |
| hsa04140 | Colorectum | AD | Autophagy - animal | 49/2092 | 141/8465 | 4.58e-03 | 2.20e-02 | 1.40e-02 | 49 |
| hsa04071 | Colorectum | AD | Sphingolipid signaling pathway | 43/2092 | 121/8465 | 4.83e-03 | 2.28e-02 | 1.45e-02 | 43 |
| hsa05166 | Colorectum | AD | Human T-cell leukemia virus 1 infection | 72/2092 | 222/8465 | 5.24e-03 | 2.44e-02 | 1.55e-02 | 72 |
| hsa04218 | Colorectum | AD | Cellular senescence | 53/2092 | 156/8465 | 5.55e-03 | 2.48e-02 | 1.58e-02 | 53 |
| hsa05215 | Colorectum | AD | Prostate cancer | 35/2092 | 97/8465 | 7.95e-03 | 3.13e-02 | 2.00e-02 | 35 |
| hsa01521 | Colorectum | AD | EGFR tyrosine kinase inhibitor resistance | 29/2092 | 79/8465 | 1.15e-02 | 4.24e-02 | 2.71e-02 | 29 |
| hsa052081 | Colorectum | AD | Chemical carcinogenesis - reactive oxygen species | 126/2092 | 223/8465 | 1.01e-24 | 1.68e-22 | 1.07e-22 | 126 |
| hsa054151 | Colorectum | AD | Diabetic cardiomyopathy | 114/2092 | 203/8465 | 3.65e-22 | 3.06e-20 | 1.95e-20 | 114 |
| hsa052131 | Colorectum | AD | Endometrial cancer | 29/2092 | 58/8465 | 2.69e-05 | 2.57e-04 | 1.64e-04 | 29 |
| hsa052301 | Colorectum | AD | Central carbon metabolism in cancer | 33/2092 | 70/8465 | 3.61e-05 | 3.19e-04 | 2.03e-04 | 33 |
| hsa052251 | Colorectum | AD | Hepatocellular carcinoma | 59/2092 | 168/8465 | 1.50e-03 | 8.69e-03 | 5.54e-03 | 59 |
| hsa045101 | Colorectum | AD | Focal adhesion | 67/2092 | 203/8465 | 4.40e-03 | 2.17e-02 | 1.38e-02 | 67 |
| hsa041401 | Colorectum | AD | Autophagy - animal | 49/2092 | 141/8465 | 4.58e-03 | 2.20e-02 | 1.40e-02 | 49 |
| hsa040711 | Colorectum | AD | Sphingolipid signaling pathway | 43/2092 | 121/8465 | 4.83e-03 | 2.28e-02 | 1.45e-02 | 43 |
| Page: 1 2 3 4 5 6 7 8 9 10 11 12 13 14 15 16 17 18 19 20 21 22 23 |
Top |
Cell-cell communication analysis |
| Identification of potential cell-cell interactions between two cell types and their ligand-receptor pairs for different disease states |
| Ligand | Receptor | LRpair | Pathway | Tissue | Disease Stage |
| Page: 1 |
Top |
Single-cell gene regulatory network inference analysis |
| Find out the significant the regulons (TFs) and the target genes of each regulon across cell types for different disease states |
| TF | Cell Type | Tissue | Disease Stage | Target Gene | RSS | Regulon Activity |
| ∗The dot plots of a searched regulon are shown for all cell subpopulations in each disease state of each tissue based on the regulon specific score inferred using pySCENIC and by calculating the average expression. |
| Page: 1 |
Top |
Somatic mutation of malignant transformation related genes |
| Annotation of somatic variants for genes involved in malignant transformation |
| Hugo Symbol | Variant Class | Variant Classification | dbSNP RS | HGVSc | HGVSp | HGVSp Short | SWISSPROT | BIOTYPE | SIFT | PolyPhen | Tumor Sample Barcode | Tissue | Histology | Sex | Age | Stage | Therapy Types | Drugs | Outcome |
| PTEN | SNV | Missense_Mutation | rs121909229 | c.389N>A | p.Arg130Gln | p.R130Q | P60484 | protein_coding | deleterious(0.02) | probably_damaging(0.998) | TCGA-A2-A4RX-01 | Breast | breast invasive carcinoma | Female | >=65 | I/II | Unknown | Unknown | SD |
| PTEN | SNV | Missense_Mutation | c.404T>A | p.Ile135Lys | p.I135K | P60484 | protein_coding | deleterious(0.03) | probably_damaging(0.999) | TCGA-A7-A26G-01 | Breast | breast invasive carcinoma | Female | <65 | I/II | Chemotherapy | taxotere | SD | |
| PTEN | SNV | Missense_Mutation | rs121909229 | c.389G>A | p.Arg130Gln | p.R130Q | P60484 | protein_coding | deleterious(0.02) | probably_damaging(0.998) | TCGA-A7-A4SC-01 | Breast | breast invasive carcinoma | Female | <65 | I/II | Hormone Therapy | tamoxiphen | SD |
| PTEN | SNV | Missense_Mutation | c.593N>A | p.Met198Lys | p.M198K | P60484 | protein_coding | deleterious(0) | benign(0.285) | TCGA-AC-A2FF-01 | Breast | breast invasive carcinoma | Female | <65 | I/II | Chemotherapy | cytoxan | CR | |
| PTEN | SNV | Missense_Mutation | c.384N>C | p.Lys128Asn | p.K128N | P60484 | protein_coding | deleterious(0.03) | probably_damaging(0.998) | TCGA-AN-A0XW-01 | Breast | breast invasive carcinoma | Female | <65 | III/IV | Unknown | Unknown | SD | |
| PTEN | SNV | Missense_Mutation | c.28N>C | p.Ser10Arg | p.S10R | P60484 | protein_coding | deleterious(0) | benign(0.188) | TCGA-AR-A1AJ-01 | Breast | breast invasive carcinoma | Female | >=65 | I/II | Unknown | Unknown | SD | |
| PTEN | SNV | Missense_Mutation | rs786201995 | c.70G>A | p.Asp24Asn | p.D24N | P60484 | protein_coding | deleterious(0) | benign(0.012) | TCGA-AR-A1AM-01 | Breast | breast invasive carcinoma | Female | <65 | III/IV | Chemotherapy | adriamycin | SD |
| PTEN | SNV | Missense_Mutation | c.367C>G | p.His123Asp | p.H123D | P60484 | protein_coding | deleterious(0) | probably_damaging(0.998) | TCGA-AR-A24Q-01 | Breast | breast invasive carcinoma | Female | <65 | I/II | Chemotherapy | doxorubicin | SD | |
| PTEN | SNV | Missense_Mutation | c.370N>A | p.Cys124Ser | p.C124S | P60484 | protein_coding | deleterious(0) | probably_damaging(0.998) | TCGA-AR-A2LL-01 | Breast | breast invasive carcinoma | Female | >=65 | I/II | Hormone Therapy | tamoxiphen | SD | |
| PTEN | SNV | Missense_Mutation | rs121909229 | c.389N>A | p.Arg130Gln | p.R130Q | P60484 | protein_coding | deleterious(0.02) | probably_damaging(0.998) | TCGA-AR-A5QQ-01 | Breast | breast invasive carcinoma | Female | >=65 | III/IV | Chemotherapy | carboplatin | PD |
| Page: 1 2 3 4 5 6 7 8 9 10 11 12 13 14 15 16 17 18 19 20 21 22 23 24 25 26 27 28 29 30 31 32 33 34 35 36 37 38 39 40 41 42 43 44 45 46 47 48 49 |
Top |
Related drugs of malignant transformation related genes |
| Identification of chemicals and drugs interact with genes involved in malignant transfromation |
| (DGIdb 4.0) |
| Entrez ID | Symbol | Category | Interaction Types | Drug Claim Name | Drug Name | PMIDs |
| 5728 | PTEN | PTEN FAMILY, ENZYME, PROTEIN PHOSPHATASE, DRUG RESISTANCE, CLINICALLY ACTIONABLE, KINASE | PI3KBETA INHIBITOR AZD8186 | 25544636 | ||
| 5728 | PTEN | PTEN FAMILY, ENZYME, PROTEIN PHOSPHATASE, DRUG RESISTANCE, CLINICALLY ACTIONABLE, KINASE | TEMSIROLIMUS | TEMSIROLIMUS | 11504908,23674493 | |
| 5728 | PTEN | PTEN FAMILY, ENZYME, PROTEIN PHOSPHATASE, DRUG RESISTANCE, CLINICALLY ACTIONABLE, KINASE | Temsirolimus | TEMSIROLIMUS | 27016228 | |
| 5728 | PTEN | PTEN FAMILY, ENZYME, PROTEIN PHOSPHATASE, DRUG RESISTANCE, CLINICALLY ACTIONABLE, KINASE | PF-04691502 | PF-04691502 | 21750219 | |
| 5728 | PTEN | PTEN FAMILY, ENZYME, PROTEIN PHOSPHATASE, DRUG RESISTANCE, CLINICALLY ACTIONABLE, KINASE | PANITUMUMAB | PANITUMUMAB | 19223544 | |
| 5728 | PTEN | PTEN FAMILY, ENZYME, PROTEIN PHOSPHATASE, DRUG RESISTANCE, CLINICALLY ACTIONABLE, KINASE | Oxaliplatin | OXALIPLATIN | 24100628 | |
| 5728 | PTEN | PTEN FAMILY, ENZYME, PROTEIN PHOSPHATASE, DRUG RESISTANCE, CLINICALLY ACTIONABLE, KINASE | DETD-35 | 27048951 | ||
| 5728 | PTEN | PTEN FAMILY, ENZYME, PROTEIN PHOSPHATASE, DRUG RESISTANCE, CLINICALLY ACTIONABLE, KINASE | cisplatin | CISPLATIN | ||
| 5728 | PTEN | PTEN FAMILY, ENZYME, PROTEIN PHOSPHATASE, DRUG RESISTANCE, CLINICALLY ACTIONABLE, KINASE | Copanlisib | COPANLISIB | 27672108 | |
| 5728 | PTEN | PTEN FAMILY, ENZYME, PROTEIN PHOSPHATASE, DRUG RESISTANCE, CLINICALLY ACTIONABLE, KINASE | Fulvestrant | FULVESTRANT | 26733612 |
| Page: 1 2 3 4 5 6 7 8 9 10 11 12 13 14 15 16 17 |

Copyright 2023-Present -The University of Texas Health Science Center at Houston |