
|
|||||
|
 | |
| |
| |
| |
| |
| |
|
Gene: PTDSS2 |
Gene summary for PTDSS2 |
| Gene information | Species | Human | Gene symbol | PTDSS2 | Gene ID | 81490 |
| Gene name | phosphatidylserine synthase 2 | |
| Gene Alias | PSS2 | |
| Cytomap | 11p15.5 | |
| Gene Type | protein-coding | GO ID | GO:0006575 | UniProtAcc | A0A024RC97 |
Top |
Malignant transformation analysis |
| Identification of the aberrant gene expression in precancerous and cancerous lesions by comparing the gene expression of stem-like cells in diseased tissues with normal stem cells |
| Entrez ID | Symbol | Replicates | Species | Organ | Tissue | Adj P-value | Log2FC | Malignancy |
| 81490 | PTDSS2 | HCC1_Meng | Human | Liver | HCC | 5.52e-26 | 8.98e-02 | 0.0246 |
| 81490 | PTDSS2 | HCC1 | Human | Liver | HCC | 4.11e-08 | 3.87e+00 | 0.5336 |
| 81490 | PTDSS2 | HCC2 | Human | Liver | HCC | 1.15e-04 | 2.13e+00 | 0.5341 |
| 81490 | PTDSS2 | S014 | Human | Liver | HCC | 1.88e-18 | 5.21e-01 | 0.2254 |
| 81490 | PTDSS2 | S015 | Human | Liver | HCC | 3.84e-10 | 4.23e-01 | 0.2375 |
| 81490 | PTDSS2 | S016 | Human | Liver | HCC | 1.69e-15 | 4.60e-01 | 0.2243 |
| 81490 | PTDSS2 | S027 | Human | Liver | HCC | 5.15e-06 | 5.54e-01 | 0.2446 |
| 81490 | PTDSS2 | S028 | Human | Liver | HCC | 6.61e-20 | 5.70e-01 | 0.2503 |
| 81490 | PTDSS2 | S029 | Human | Liver | HCC | 3.94e-19 | 6.77e-01 | 0.2581 |
| 81490 | PTDSS2 | C04 | Human | Oral cavity | OSCC | 5.09e-04 | 2.74e-01 | 0.2633 |
| 81490 | PTDSS2 | C21 | Human | Oral cavity | OSCC | 2.07e-10 | 4.52e-01 | 0.2678 |
| 81490 | PTDSS2 | C30 | Human | Oral cavity | OSCC | 5.74e-09 | 5.21e-01 | 0.3055 |
| 81490 | PTDSS2 | C43 | Human | Oral cavity | OSCC | 2.95e-07 | 2.50e-01 | 0.1704 |
| 81490 | PTDSS2 | C46 | Human | Oral cavity | OSCC | 1.77e-02 | 1.63e-01 | 0.1673 |
| 81490 | PTDSS2 | C51 | Human | Oral cavity | OSCC | 6.60e-13 | 6.01e-01 | 0.2674 |
| 81490 | PTDSS2 | LN38 | Human | Oral cavity | OSCC | 1.69e-03 | 5.16e-01 | 0.168 |
| 81490 | PTDSS2 | SYSMH2 | Human | Oral cavity | OSCC | 1.56e-06 | 2.33e-01 | 0.2326 |
| 81490 | PTDSS2 | SYSMH3 | Human | Oral cavity | OSCC | 1.61e-15 | 4.15e-01 | 0.2442 |
| 81490 | PTDSS2 | SYSMH5 | Human | Oral cavity | OSCC | 9.34e-05 | 2.03e-01 | 0.0647 |
| 81490 | PTDSS2 | male-WTA | Human | Thyroid | PTC | 4.68e-03 | 9.82e-02 | 0.1037 |
| Page: 1 2 |
| Tissue | Expression Dynamics | Abbreviation |
| Liver | 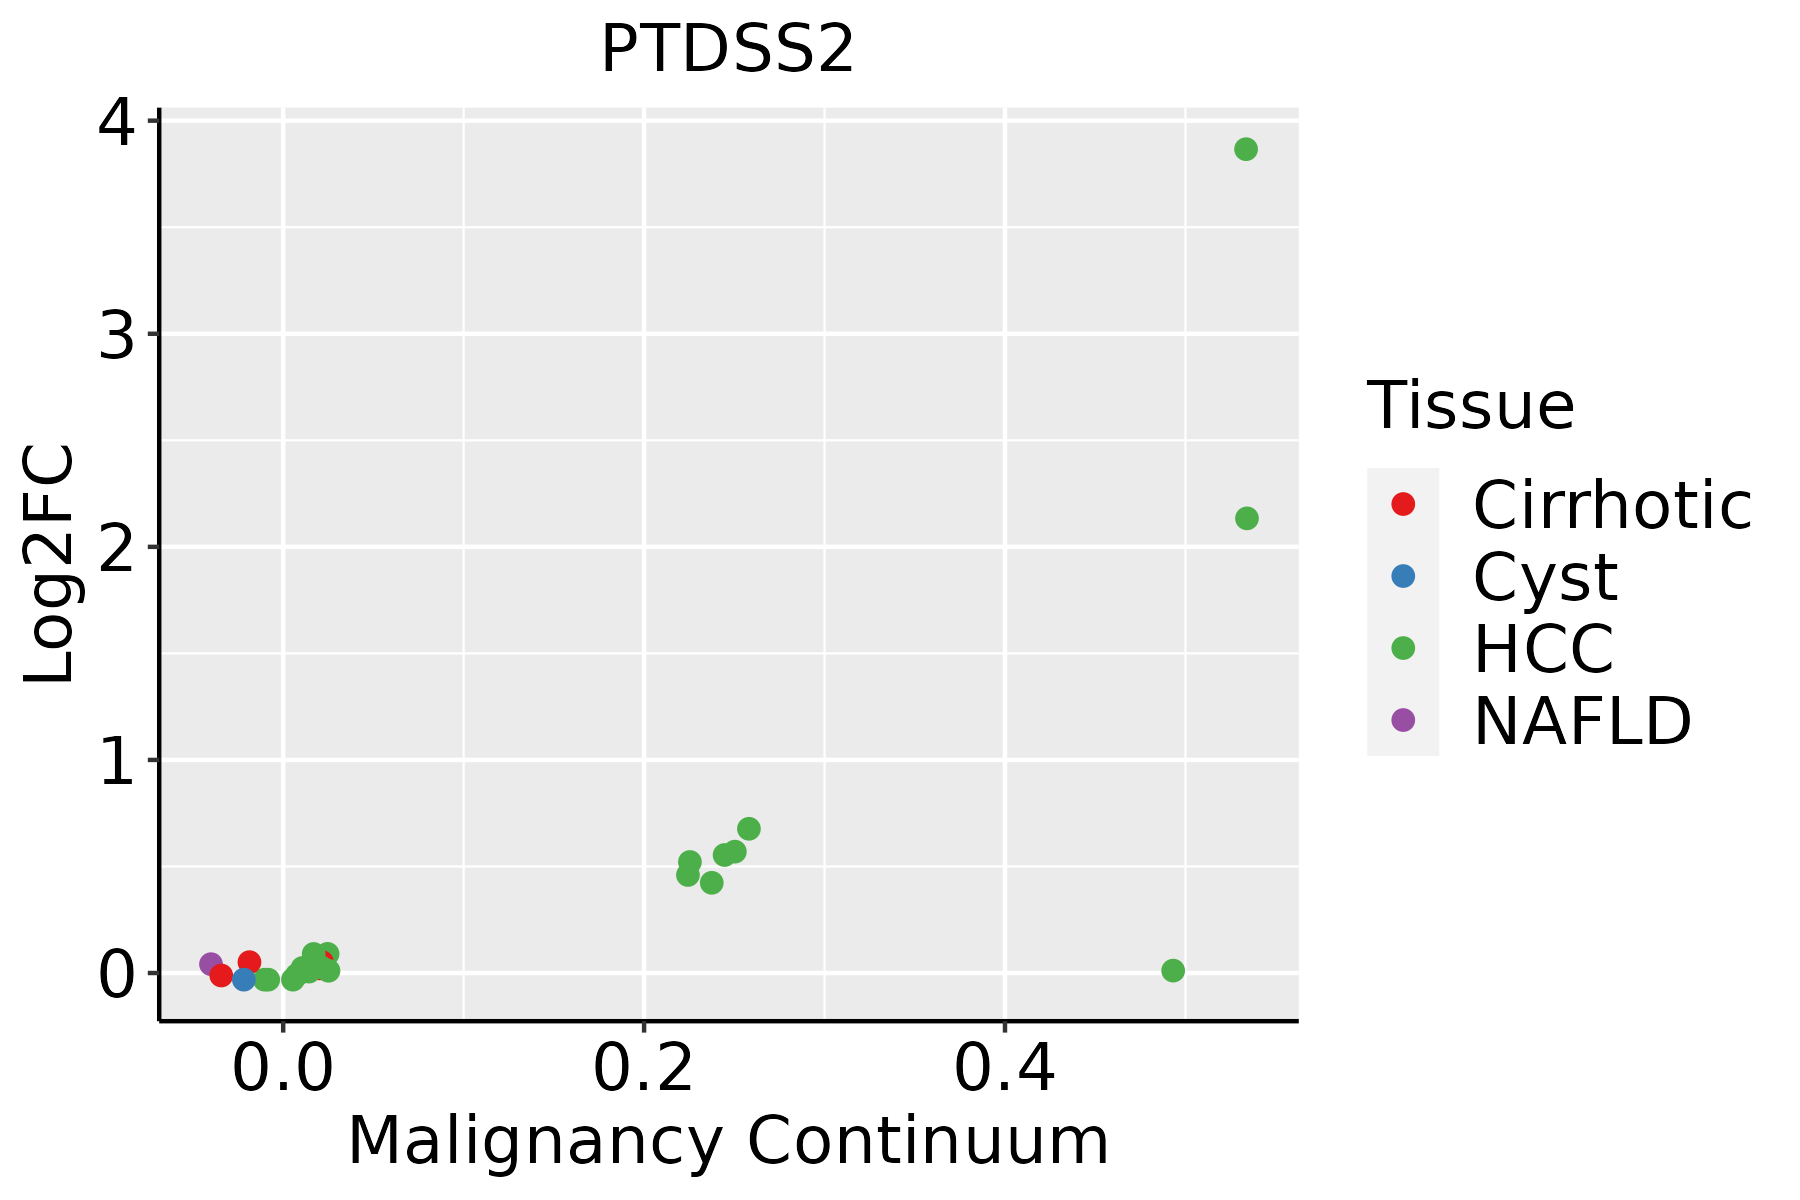 | HCC: Hepatocellular carcinoma |
| NAFLD: Non-alcoholic fatty liver disease | ||
| Oral Cavity | 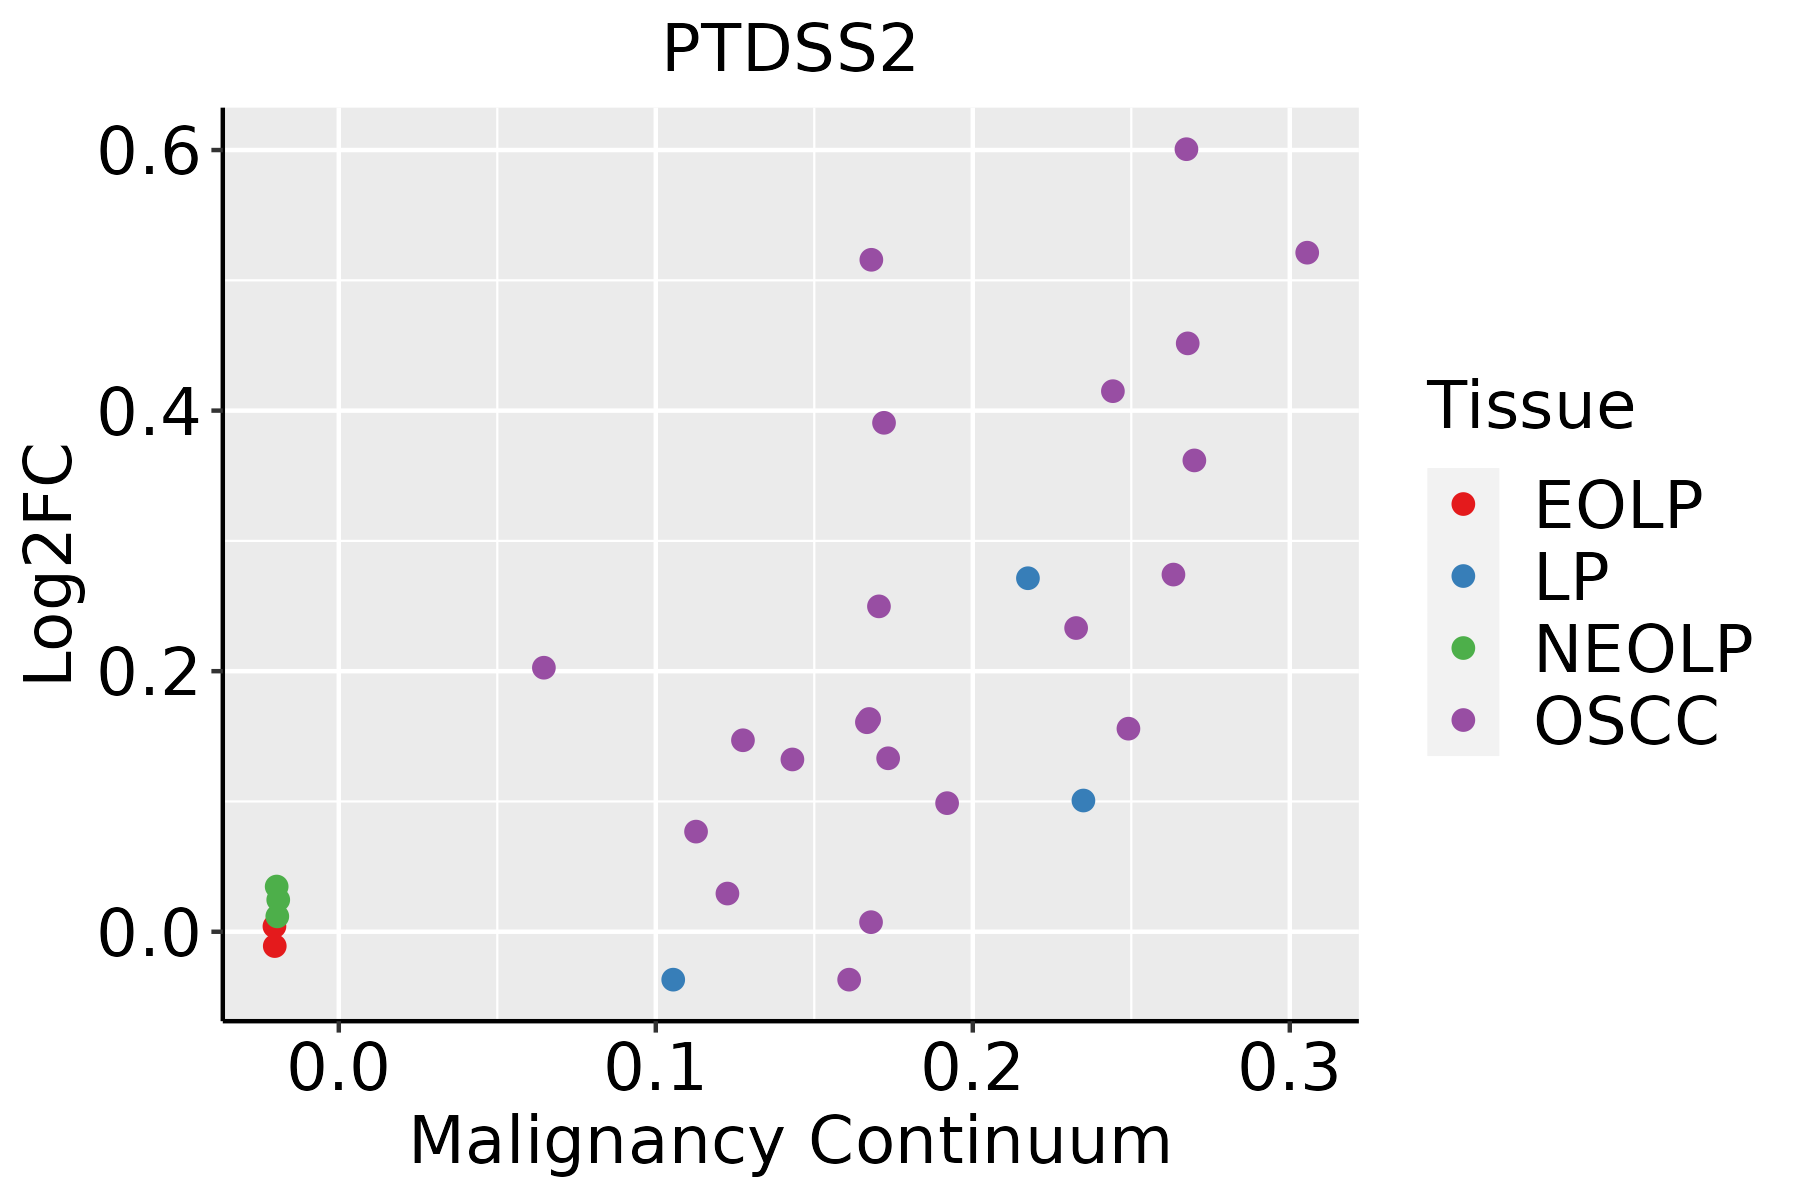 | EOLP: Erosive Oral lichen planus |
| LP: leukoplakia | ||
| NEOLP: Non-erosive oral lichen planus | ||
| OSCC: Oral squamous cell carcinoma | ||
| Thyroid |  | ATC: Anaplastic thyroid cancer |
| HT: Hashimoto's thyroiditis | ||
| PTC: Papillary thyroid cancer |
| ∗log2FC in expression of this searched gene in stem-like cells from each diseased tissue sample relative to stem-like cells in normal samples in each tissue plotted against the malignancy continuum. Samples are colored based on if they are from different disease stage. |
Top |
Malignant transformation related pathway analysis |
| Find out the enriched GO biological processes and KEGG pathways involved in transition from healthy to precancer to cancer |
| Tissue | Disease Stage | Enriched GO biological Processes |
| Colorectum | AD |  |
| Colorectum | SER |  |
| Colorectum | MSS |  |
| Colorectum | MSI-H |  |
| Colorectum | FAP |  |
| ∗Top 15 enriched GO BP terms are showed in the bar plot of each disease state in each tissue. Each row represents a significant GO biological process which is colored according to the -log10(p.adjust). |
| Page: 1 2 3 4 5 6 7 8 9 |
| GO ID | Tissue | Disease Stage | Description | Gene Ratio | Bg Ratio | pvalue | p.adjust | Count |
| GO:000657521 | Liver | HCC | cellular modified amino acid metabolic process | 119/7958 | 188/18723 | 6.47e-09 | 1.67e-07 | 119 |
| GO:00086542 | Liver | HCC | phospholipid biosynthetic process | 150/7958 | 253/18723 | 4.77e-08 | 1.03e-06 | 150 |
| GO:00066444 | Liver | HCC | phospholipid metabolic process | 214/7958 | 383/18723 | 7.25e-08 | 1.48e-06 | 214 |
| GO:004648611 | Liver | HCC | glycerolipid metabolic process | 215/7958 | 392/18723 | 4.54e-07 | 7.49e-06 | 215 |
| GO:004501711 | Liver | HCC | glycerolipid biosynthetic process | 143/7958 | 252/18723 | 3.27e-06 | 4.31e-05 | 143 |
| GO:00066504 | Liver | HCC | glycerophospholipid metabolic process | 168/7958 | 306/18723 | 7.27e-06 | 8.62e-05 | 168 |
| GO:004647411 | Liver | HCC | glycerophospholipid biosynthetic process | 121/7958 | 211/18723 | 9.12e-06 | 1.06e-04 | 121 |
| GO:004239821 | Liver | HCC | cellular modified amino acid biosynthetic process | 34/7958 | 46/18723 | 1.53e-05 | 1.67e-04 | 34 |
| GO:00086543 | Oral cavity | OSCC | phospholipid biosynthetic process | 130/7305 | 253/18723 | 3.96e-05 | 3.46e-04 | 130 |
| GO:00423985 | Oral cavity | OSCC | cellular modified amino acid biosynthetic process | 31/7305 | 46/18723 | 9.03e-05 | 6.88e-04 | 31 |
| GO:00464743 | Oral cavity | OSCC | glycerophospholipid biosynthetic process | 102/7305 | 211/18723 | 3.50e-03 | 1.48e-02 | 102 |
| GO:00066445 | Oral cavity | OSCC | phospholipid metabolic process | 175/7305 | 383/18723 | 4.21e-03 | 1.71e-02 | 175 |
| GO:00065756 | Oral cavity | OSCC | cellular modified amino acid metabolic process | 91/7305 | 188/18723 | 5.33e-03 | 2.07e-02 | 91 |
| GO:000657513 | Thyroid | PTC | cellular modified amino acid metabolic process | 85/5968 | 188/18723 | 8.29e-05 | 7.01e-04 | 85 |
| GO:004239813 | Thyroid | PTC | cellular modified amino acid biosynthetic process | 25/5968 | 46/18723 | 1.31e-03 | 7.43e-03 | 25 |
| GO:000657522 | Thyroid | ATC | cellular modified amino acid metabolic process | 82/6293 | 188/18723 | 2.60e-03 | 1.20e-02 | 82 |
| GO:004239822 | Thyroid | ATC | cellular modified amino acid biosynthetic process | 25/6293 | 46/18723 | 3.00e-03 | 1.36e-02 | 25 |
| Page: 1 |
| Pathway ID | Tissue | Disease Stage | Description | Gene Ratio | Bg Ratio | pvalue | p.adjust | qvalue | Count |
| Page: 1 |
Top |
Cell-cell communication analysis |
| Identification of potential cell-cell interactions between two cell types and their ligand-receptor pairs for different disease states |
| Ligand | Receptor | LRpair | Pathway | Tissue | Disease Stage |
| Page: 1 |
Top |
Single-cell gene regulatory network inference analysis |
| Find out the significant the regulons (TFs) and the target genes of each regulon across cell types for different disease states |
| TF | Cell Type | Tissue | Disease Stage | Target Gene | RSS | Regulon Activity |
| ∗The dot plots of a searched regulon are shown for all cell subpopulations in each disease state of each tissue based on the regulon specific score inferred using pySCENIC and by calculating the average expression. |
| Page: 1 |
Top |
Somatic mutation of malignant transformation related genes |
| Annotation of somatic variants for genes involved in malignant transformation |
| Hugo Symbol | Variant Class | Variant Classification | dbSNP RS | HGVSc | HGVSp | HGVSp Short | SWISSPROT | BIOTYPE | SIFT | PolyPhen | Tumor Sample Barcode | Tissue | Histology | Sex | Age | Stage | Therapy Types | Drugs | Outcome |
| PTDSS2 | SNV | Missense_Mutation | novel | c.1230C>G | p.Phe410Leu | p.F410L | Q9BVG9 | protein_coding | tolerated(0.45) | benign(0.003) | TCGA-3C-AALI-01 | Breast | breast invasive carcinoma | Female | <65 | I/II | Unspecific | Poly E | Complete Response |
| PTDSS2 | SNV | Missense_Mutation | c.937N>T | p.Arg313Cys | p.R313C | Q9BVG9 | protein_coding | deleterious(0) | probably_damaging(0.994) | TCGA-A2-A0YD-01 | Breast | breast invasive carcinoma | Female | <65 | I/II | Chemotherapy | cytoxan | SD | |
| PTDSS2 | SNV | Missense_Mutation | c.286N>T | p.Gly96Cys | p.G96C | Q9BVG9 | protein_coding | deleterious(0) | probably_damaging(0.989) | TCGA-AO-A128-01 | Breast | breast invasive carcinoma | Female | <65 | I/II | Chemotherapy | doxorubicin | SD | |
| PTDSS2 | SNV | Missense_Mutation | rs777043477 | c.1069G>A | p.Val357Met | p.V357M | Q9BVG9 | protein_coding | tolerated(0.11) | benign(0.223) | TCGA-AQ-A0Y5-01 | Breast | breast invasive carcinoma | Female | >=65 | III/IV | Chemotherapy | cytoxan | SD |
| PTDSS2 | SNV | Missense_Mutation | novel | c.874N>A | p.Ala292Thr | p.A292T | Q9BVG9 | protein_coding | tolerated(0.18) | benign(0.356) | TCGA-2W-A8YY-01 | Cervix | cervical & endocervical cancer | Female | <65 | I/II | Chemotherapy | cisplatin | CR |
| PTDSS2 | SNV | Missense_Mutation | rs140991730 | c.1408N>A | p.Glu470Lys | p.E470K | Q9BVG9 | protein_coding | deleterious_low_confidence(0.04) | benign(0) | TCGA-C5-A8XH-01 | Cervix | cervical & endocervical cancer | Female | <65 | I/II | Unknown | Unknown | SD |
| PTDSS2 | SNV | Missense_Mutation | c.774N>G | p.Ile258Met | p.I258M | Q9BVG9 | protein_coding | deleterious(0.01) | probably_damaging(0.997) | TCGA-DR-A0ZM-01 | Cervix | cervical & endocervical cancer | Female | <65 | III/IV | Unspecific | Cisplatin | SD | |
| PTDSS2 | SNV | Missense_Mutation | c.1090N>C | p.Glu364Gln | p.E364Q | Q9BVG9 | protein_coding | deleterious(0) | probably_damaging(0.942) | TCGA-FU-A23L-01 | Cervix | cervical & endocervical cancer | Female | <65 | I/II | Chemotherapy | cisplatin | CR | |
| PTDSS2 | SNV | Missense_Mutation | novel | c.1453N>G | p.Thr485Ala | p.T485A | Q9BVG9 | protein_coding | tolerated_low_confidence(1) | benign(0) | TCGA-AA-3851-01 | Colorectum | colon adenocarcinoma | Male | >=65 | I/II | Unknown | Unknown | SD |
| PTDSS2 | SNV | Missense_Mutation | rs766899176 | c.185G>A | p.Arg62Gln | p.R62Q | Q9BVG9 | protein_coding | tolerated(0.1) | benign(0.03) | TCGA-AA-A00N-01 | Colorectum | colon adenocarcinoma | Male | >=65 | I/II | Unknown | Unknown | PD |
| Page: 1 2 3 |
Top |
Related drugs of malignant transformation related genes |
| Identification of chemicals and drugs interact with genes involved in malignant transfromation |
| (DGIdb 4.0) |
| Entrez ID | Symbol | Category | Interaction Types | Drug Claim Name | Drug Name | PMIDs |
| Page: 1 |

Copyright 2023-Present -The University of Texas Health Science Center at Houston |