
|
|||||
|
 | |
| |
| |
| |
| |
| |
|
Gene: PTCH1 |
Gene summary for PTCH1 |
| Gene information | Species | Human | Gene symbol | PTCH1 | Gene ID | 5727 |
| Gene name | patched 1 | |
| Gene Alias | BCNS | |
| Cytomap | 9q22.32 | |
| Gene Type | protein-coding | GO ID | GO:0000003 | UniProtAcc | Q13635 |
Top |
Malignant transformation analysis |
| Identification of the aberrant gene expression in precancerous and cancerous lesions by comparing the gene expression of stem-like cells in diseased tissues with normal stem cells |
| Entrez ID | Symbol | Replicates | Species | Organ | Tissue | Adj P-value | Log2FC | Malignancy |
| 5727 | PTCH1 | AEH-subject1 | Human | Endometrium | AEH | 7.56e-13 | -4.24e-01 | -0.3059 |
| 5727 | PTCH1 | AEH-subject2 | Human | Endometrium | AEH | 2.24e-13 | -4.20e-01 | -0.2525 |
| 5727 | PTCH1 | AEH-subject3 | Human | Endometrium | AEH | 4.43e-10 | -3.71e-01 | -0.2576 |
| 5727 | PTCH1 | AEH-subject5 | Human | Endometrium | AEH | 5.49e-10 | -3.80e-01 | -0.2953 |
| 5727 | PTCH1 | EEC-subject1 | Human | Endometrium | EEC | 2.10e-12 | -4.15e-01 | -0.2682 |
| 5727 | PTCH1 | EEC-subject2 | Human | Endometrium | EEC | 2.90e-16 | -4.47e-01 | -0.2607 |
| 5727 | PTCH1 | EEC-subject3 | Human | Endometrium | EEC | 2.11e-24 | -4.90e-01 | -0.2525 |
| 5727 | PTCH1 | EEC-subject4 | Human | Endometrium | EEC | 2.58e-06 | -3.30e-01 | -0.2571 |
| 5727 | PTCH1 | EEC-subject5 | Human | Endometrium | EEC | 2.86e-16 | -4.76e-01 | -0.249 |
| 5727 | PTCH1 | GSM5276934 | Human | Endometrium | EEC | 4.38e-28 | -5.38e-01 | -0.0913 |
| 5727 | PTCH1 | GSM5276935 | Human | Endometrium | EEC | 1.52e-13 | -4.42e-01 | -0.123 |
| 5727 | PTCH1 | GSM5276937 | Human | Endometrium | EEC | 4.21e-18 | -4.98e-01 | -0.0897 |
| 5727 | PTCH1 | GSM6177620_NYU_UCEC1_lib1_lib1 | Human | Endometrium | EEC | 2.95e-17 | -4.70e-01 | -0.1869 |
| 5727 | PTCH1 | GSM6177620_NYU_UCEC1_lib2_lib2 | Human | Endometrium | EEC | 5.19e-16 | -4.91e-01 | -0.1875 |
| 5727 | PTCH1 | GSM6177620_NYU_UCEC1_lib3_lib3 | Human | Endometrium | EEC | 1.66e-20 | -4.13e-01 | -0.1883 |
| 5727 | PTCH1 | GSM6177621_NYU_UCEC2_lib1_lib1 | Human | Endometrium | EEC | 1.69e-21 | -4.64e-01 | -0.1934 |
| 5727 | PTCH1 | GSM6177622_NYU_UCEC3_lib1_lib1 | Human | Endometrium | EEC | 2.23e-29 | -5.22e-01 | -0.1917 |
| 5727 | PTCH1 | GSM6177622_NYU_UCEC3_lib2_lib2 | Human | Endometrium | EEC | 1.59e-32 | -5.53e-01 | -0.1916 |
| 5727 | PTCH1 | GSM6177623_NYU_UCEC3_Vis | Human | Endometrium | EEC | 4.47e-17 | -4.43e-01 | -0.1269 |
| 5727 | PTCH1 | P2T-E | Human | Esophagus | ESCC | 4.22e-09 | 2.86e-01 | 0.1177 |
| Page: 1 2 3 |
| Tissue | Expression Dynamics | Abbreviation |
| Endometrium | 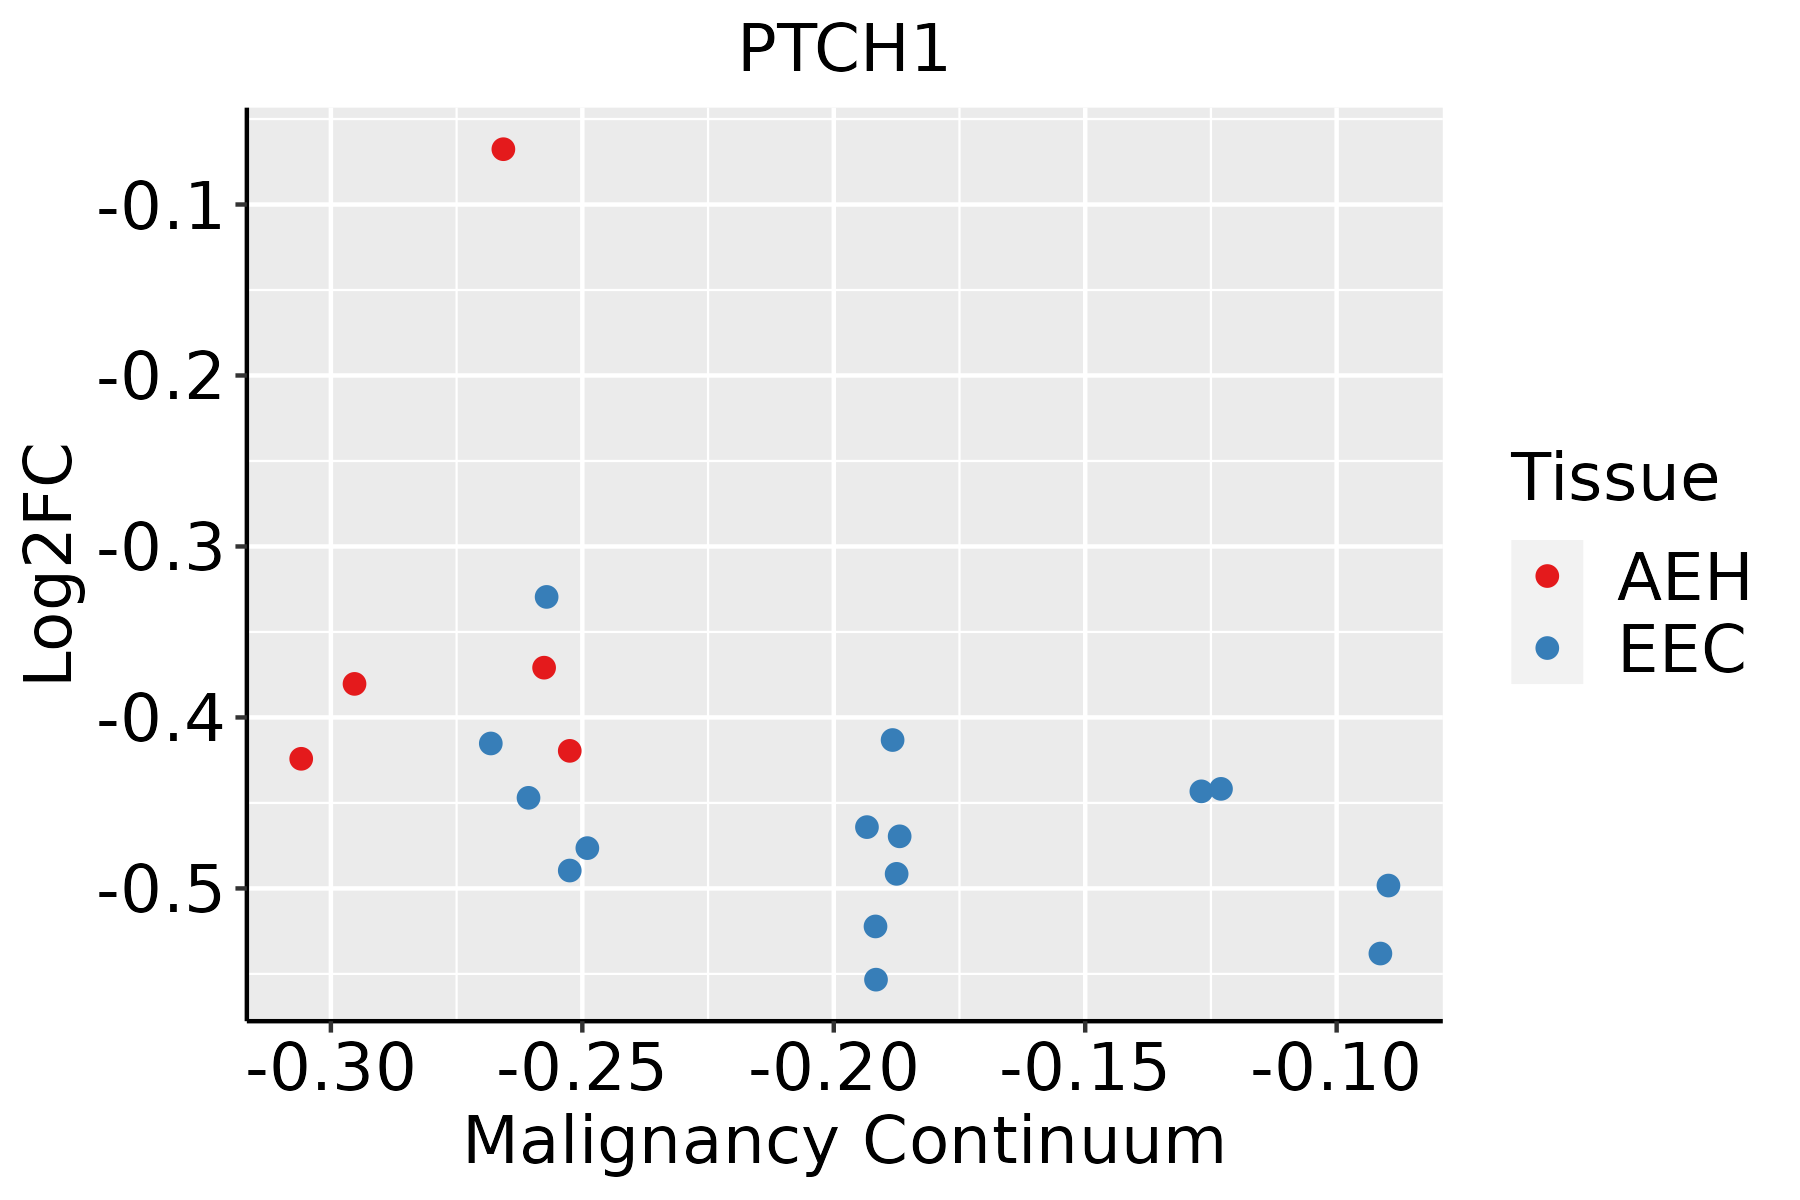 | AEH: Atypical endometrial hyperplasia |
| EEC: Endometrioid Cancer | ||
| Esophagus |  | ESCC: Esophageal squamous cell carcinoma |
| HGIN: High-grade intraepithelial neoplasias | ||
| LGIN: Low-grade intraepithelial neoplasias | ||
| Thyroid | 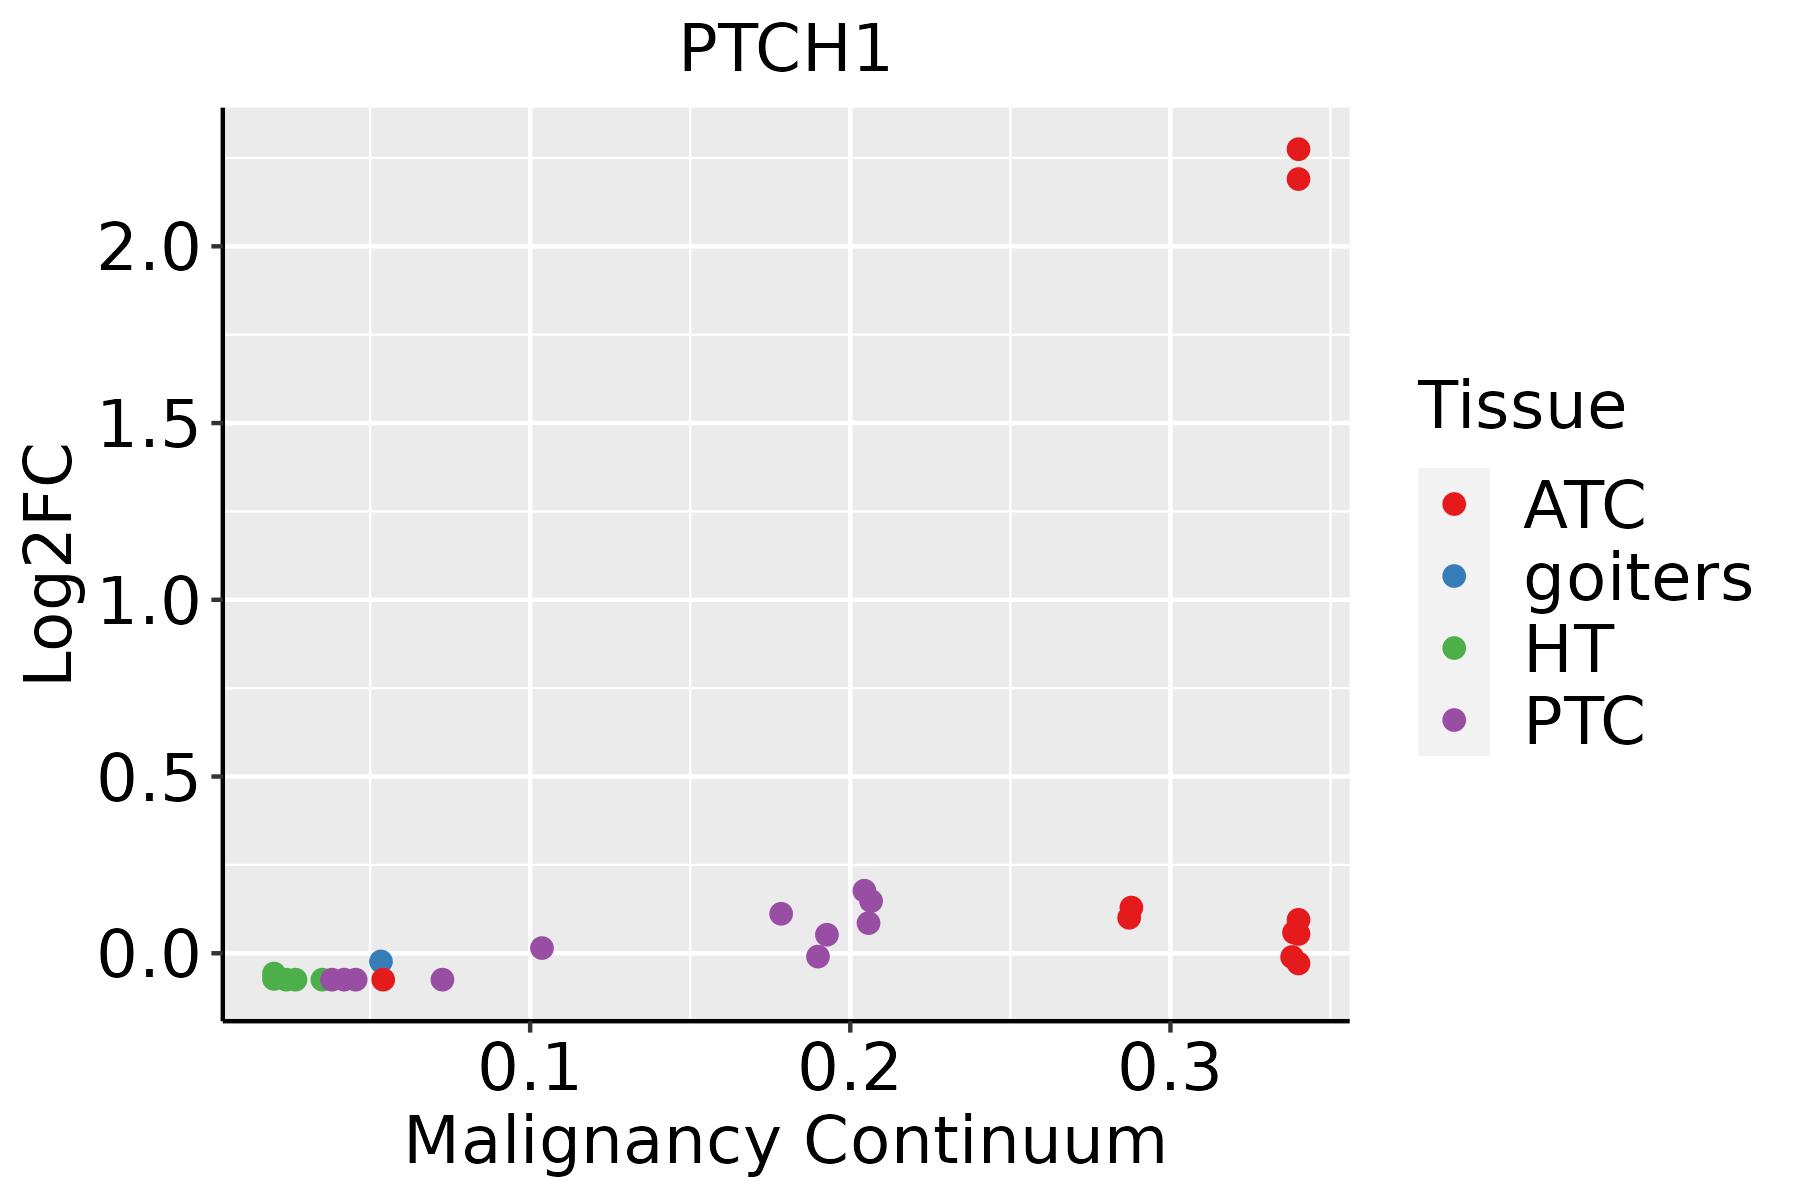 | ATC: Anaplastic thyroid cancer |
| HT: Hashimoto's thyroiditis | ||
| PTC: Papillary thyroid cancer |
| ∗log2FC in expression of this searched gene in stem-like cells from each diseased tissue sample relative to stem-like cells in normal samples in each tissue plotted against the malignancy continuum. Samples are colored based on if they are from different disease stage. |
Top |
Malignant transformation related pathway analysis |
| Find out the enriched GO biological processes and KEGG pathways involved in transition from healthy to precancer to cancer |
| Tissue | Disease Stage | Enriched GO biological Processes |
| Colorectum | AD |  |
| Colorectum | SER |  |
| Colorectum | MSS |  |
| Colorectum | MSI-H |  |
| Colorectum | FAP |  |
| ∗Top 15 enriched GO BP terms are showed in the bar plot of each disease state in each tissue. Each row represents a significant GO biological process which is colored according to the -log10(p.adjust). |
| Page: 1 2 3 4 5 6 7 8 9 |
| GO ID | Tissue | Disease Stage | Description | Gene Ratio | Bg Ratio | pvalue | p.adjust | Count |
| GO:00614589 | Endometrium | AEH | reproductive system development | 88/2100 | 427/18723 | 9.50e-09 | 6.41e-07 | 88 |
| GO:00486089 | Endometrium | AEH | reproductive structure development | 87/2100 | 424/18723 | 1.43e-08 | 9.12e-07 | 87 |
| GO:00605376 | Endometrium | AEH | muscle tissue development | 83/2100 | 403/18723 | 2.57e-08 | 1.50e-06 | 83 |
| GO:007265914 | Endometrium | AEH | protein localization to plasma membrane | 63/2100 | 284/18723 | 7.58e-08 | 3.92e-06 | 63 |
| GO:00016498 | Endometrium | AEH | osteoblast differentiation | 52/2100 | 229/18723 | 4.74e-07 | 1.92e-05 | 52 |
| GO:00506738 | Endometrium | AEH | epithelial cell proliferation | 84/2100 | 437/18723 | 4.88e-07 | 1.94e-05 | 84 |
| GO:00074098 | Endometrium | AEH | axonogenesis | 81/2100 | 418/18723 | 5.54e-07 | 2.12e-05 | 81 |
| GO:19907789 | Endometrium | AEH | protein localization to cell periphery | 68/2100 | 333/18723 | 6.38e-07 | 2.38e-05 | 68 |
| GO:00615648 | Endometrium | AEH | axon development | 88/2100 | 467/18723 | 6.39e-07 | 2.38e-05 | 88 |
| GO:00017019 | Endometrium | AEH | in utero embryonic development | 73/2100 | 367/18723 | 7.18e-07 | 2.63e-05 | 73 |
| GO:004873216 | Endometrium | AEH | gland development | 83/2100 | 436/18723 | 8.62e-07 | 3.11e-05 | 83 |
| GO:00015038 | Endometrium | AEH | ossification | 78/2100 | 408/18723 | 1.54e-06 | 4.85e-05 | 78 |
| GO:004259310 | Endometrium | AEH | glucose homeostasis | 55/2100 | 258/18723 | 1.87e-06 | 5.74e-05 | 55 |
| GO:003350010 | Endometrium | AEH | carbohydrate homeostasis | 55/2100 | 259/18723 | 2.12e-06 | 6.31e-05 | 55 |
| GO:00016556 | Endometrium | AEH | urogenital system development | 67/2100 | 338/18723 | 2.30e-06 | 6.76e-05 | 67 |
| GO:00506788 | Endometrium | AEH | regulation of epithelial cell proliferation | 73/2100 | 381/18723 | 3.04e-06 | 8.44e-05 | 73 |
| GO:00720015 | Endometrium | AEH | renal system development | 61/2100 | 302/18723 | 3.43e-06 | 9.24e-05 | 61 |
| GO:00605627 | Endometrium | AEH | epithelial tube morphogenesis | 63/2100 | 325/18723 | 9.63e-06 | 2.23e-04 | 63 |
| GO:00323557 | Endometrium | AEH | response to estradiol | 34/2100 | 141/18723 | 1.13e-05 | 2.53e-04 | 34 |
| GO:00226129 | Endometrium | AEH | gland morphogenesis | 30/2100 | 118/18723 | 1.21e-05 | 2.68e-04 | 30 |
| Page: 1 2 3 4 5 6 7 8 9 10 11 12 13 14 15 16 17 |
| Pathway ID | Tissue | Disease Stage | Description | Gene Ratio | Bg Ratio | pvalue | p.adjust | qvalue | Count |
| hsa0520518 | Endometrium | AEH | Proteoglycans in cancer | 53/1197 | 205/8465 | 5.43e-06 | 6.53e-05 | 4.78e-05 | 53 |
| hsa0436010 | Endometrium | AEH | Axon guidance | 39/1197 | 182/8465 | 4.47e-03 | 2.46e-02 | 1.80e-02 | 39 |
| hsa0520519 | Endometrium | AEH | Proteoglycans in cancer | 53/1197 | 205/8465 | 5.43e-06 | 6.53e-05 | 4.78e-05 | 53 |
| hsa0436013 | Endometrium | AEH | Axon guidance | 39/1197 | 182/8465 | 4.47e-03 | 2.46e-02 | 1.80e-02 | 39 |
| hsa0520524 | Endometrium | EEC | Proteoglycans in cancer | 52/1237 | 205/8465 | 3.01e-05 | 3.19e-04 | 2.38e-04 | 52 |
| hsa0436022 | Endometrium | EEC | Axon guidance | 39/1237 | 182/8465 | 7.78e-03 | 3.66e-02 | 2.73e-02 | 39 |
| hsa0520534 | Endometrium | EEC | Proteoglycans in cancer | 52/1237 | 205/8465 | 3.01e-05 | 3.19e-04 | 2.38e-04 | 52 |
| hsa0436032 | Endometrium | EEC | Axon guidance | 39/1237 | 182/8465 | 7.78e-03 | 3.66e-02 | 2.73e-02 | 39 |
| hsa0520529 | Esophagus | ESCC | Proteoglycans in cancer | 138/4205 | 205/8465 | 1.79e-07 | 1.40e-06 | 7.15e-07 | 138 |
| hsa0436016 | Esophagus | ESCC | Axon guidance | 108/4205 | 182/8465 | 5.13e-03 | 1.30e-02 | 6.67e-03 | 108 |
| hsa0520537 | Esophagus | ESCC | Proteoglycans in cancer | 138/4205 | 205/8465 | 1.79e-07 | 1.40e-06 | 7.15e-07 | 138 |
| hsa0436017 | Esophagus | ESCC | Axon guidance | 108/4205 | 182/8465 | 5.13e-03 | 1.30e-02 | 6.67e-03 | 108 |
| Page: 1 |
Top |
Cell-cell communication analysis |
| Identification of potential cell-cell interactions between two cell types and their ligand-receptor pairs for different disease states |
| Ligand | Receptor | LRpair | Pathway | Tissue | Disease Stage |
| Page: 1 |
Top |
Single-cell gene regulatory network inference analysis |
| Find out the significant the regulons (TFs) and the target genes of each regulon across cell types for different disease states |
| TF | Cell Type | Tissue | Disease Stage | Target Gene | RSS | Regulon Activity |
| ∗The dot plots of a searched regulon are shown for all cell subpopulations in each disease state of each tissue based on the regulon specific score inferred using pySCENIC and by calculating the average expression. |
| Page: 1 |
Top |
Somatic mutation of malignant transformation related genes |
| Annotation of somatic variants for genes involved in malignant transformation |
| Hugo Symbol | Variant Class | Variant Classification | dbSNP RS | HGVSc | HGVSp | HGVSp Short | SWISSPROT | BIOTYPE | SIFT | PolyPhen | Tumor Sample Barcode | Tissue | Histology | Sex | Age | Stage | Therapy Types | Drugs | Outcome |
| PTCH1 | SNV | Missense_Mutation | rs769287098 | c.3668C>T | p.Ser1223Leu | p.S1223L | Q13635 | protein_coding | deleterious(0.01) | possibly_damaging(0.565) | TCGA-A2-A0ER-01 | Breast | breast invasive carcinoma | Female | <65 | I/II | Chemotherapy | cytoxan | SD |
| PTCH1 | SNV | Missense_Mutation | rs748726158 | c.3292N>A | p.Val1098Ile | p.V1098I | Q13635 | protein_coding | tolerated(0.06) | possibly_damaging(0.903) | TCGA-A2-A3XV-01 | Breast | breast invasive carcinoma | Female | <65 | I/II | Chemotherapy | carboplatin | CR |
| PTCH1 | SNV | Missense_Mutation | rs748812637 | c.4181N>A | p.Arg1394Gln | p.R1394Q | Q13635 | protein_coding | tolerated_low_confidence(0.63) | benign(0.04) | TCGA-A7-A3IZ-01 | Breast | breast invasive carcinoma | Female | <65 | I/II | Chemotherapy | cytoxan | SD |
| PTCH1 | SNV | Missense_Mutation | novel | c.1603N>T | p.Asp535Tyr | p.D535Y | Q13635 | protein_coding | deleterious(0) | probably_damaging(0.954) | TCGA-A7-A4SE-01 | Breast | breast invasive carcinoma | Female | <65 | I/II | Chemotherapy | adriamycin | CR |
| PTCH1 | SNV | Missense_Mutation | c.2578N>C | p.Asp860His | p.D860H | Q13635 | protein_coding | deleterious(0) | probably_damaging(0.999) | TCGA-AC-A23H-01 | Breast | breast invasive carcinoma | Female | >=65 | I/II | Unknown | Unknown | PD | |
| PTCH1 | SNV | Missense_Mutation | c.3196N>A | p.Glu1066Lys | p.E1066K | Q13635 | protein_coding | deleterious(0) | probably_damaging(0.966) | TCGA-AN-A046-01 | Breast | breast invasive carcinoma | Female | >=65 | I/II | Unknown | Unknown | SD | |
| PTCH1 | SNV | Missense_Mutation | rs769924767 | c.3005C>T | p.Thr1002Met | p.T1002M | Q13635 | protein_coding | tolerated(0.1) | benign(0.227) | TCGA-AN-A0AK-01 | Breast | breast invasive carcinoma | Female | >=65 | I/II | Unknown | Unknown | SD |
| PTCH1 | SNV | Missense_Mutation | rs566619057 | c.3391N>A | p.Val1131Met | p.V1131M | Q13635 | protein_coding | deleterious(0.04) | possibly_damaging(0.68) | TCGA-B6-A0RN-01 | Breast | breast invasive carcinoma | Female | <65 | I/II | Unknown | Unknown | SD |
| PTCH1 | SNV | Missense_Mutation | c.3223N>A | p.Gly1075Arg | p.G1075R | Q13635 | protein_coding | deleterious(0) | probably_damaging(0.999) | TCGA-BH-A0DS-01 | Breast | breast invasive carcinoma | Female | >=65 | III/IV | Chemotherapy | cyclophosphamide | SD | |
| PTCH1 | SNV | Missense_Mutation | rs773389781 | c.3573N>A | p.Asn1191Lys | p.N1191K | Q13635 | protein_coding | tolerated(0.1) | benign(0.015) | TCGA-BH-A18H-01 | Breast | breast invasive carcinoma | Female | <65 | I/II | Chemotherapy | adriamycin | CR |
| Page: 1 2 3 4 5 6 7 8 9 10 11 12 13 14 15 16 17 |
Top |
Related drugs of malignant transformation related genes |
| Identification of chemicals and drugs interact with genes involved in malignant transfromation |
| (DGIdb 4.0) |
| Entrez ID | Symbol | Category | Interaction Types | Drug Claim Name | Drug Name | PMIDs |
| 5727 | PTCH1 | CLINICALLY ACTIONABLE, TRANSPORTER | SONIDEGIB | SONIDEGIB | 24651015 | |
| 5727 | PTCH1 | CLINICALLY ACTIONABLE, TRANSPORTER | inhibitor | VISMODEGIB | VISMODEGIB | |
| 5727 | PTCH1 | CLINICALLY ACTIONABLE, TRANSPORTER | RETINOIC ACID | 12455633 | ||
| 5727 | PTCH1 | CLINICALLY ACTIONABLE, TRANSPORTER | Vismodegib | VISMODEGIB | ||
| 5727 | PTCH1 | CLINICALLY ACTIONABLE, TRANSPORTER | Sonidegib | SONIDEGIB |
| Page: 1 |

Copyright 2023-Present -The University of Texas Health Science Center at Houston |